Key takeaways
- Benchmark three inputs first: operator hours per day, zone size and traffic, and the share of runtime that runs autonomously.
- Compare only sites with similar floor area, surfaces and shift length, or the gap means nothing.
- Vendor case studies give useful before and after hours, but the vendors wrote them about customers they chose.
- IFR industry totals show fast market growth, yet they cannot tell you what a peer site spends on floor care.
- Pilot one overnight zone, then decide from your own log rather than from a headline.
Is your floor care falling behind peer sites?
Most operators find out they are behind when a customer mentions a cleaner lobby, or when a peer site turns its floors faster than yours. By then the gap has been running for months. A short benchmark against comparable sites will show it sooner, and it needs only a few inputs measured the same way every time.
Three inputs do most of the work: operator hours per day on floor care, the area and traffic each machine covers, and how much of the scrubbing runs without a person aboard. Published data supports part of this picture. It is thin on the rest, and most of what exists comes from vendors describing their own deployments.
Benchmark against your own log first, then against a small set of peers that look like you. Treat any published figure as a direction to test, not a target to hit.
What makes a peer site comparable?
A comparison is only as honest as the peer set. A large hospital wing scrubbed overnight is not the same job as a warehouse aisle system that takes forklift traffic at dawn, even when the square footage matches. Match floor area, surface type, shift length and traffic pattern before you match anything else.
The SoftBank Robotics healthcare case study, dated 2023, describes two scrubbers running overnight across about 50,000 sq ft at a top five US hospital network. Read it for the questions it raises, such as which hours were counted and what the floor carried, rather than lifting its numbers into your plan. The study's setting was its own.
Which inputs should you log before comparing?

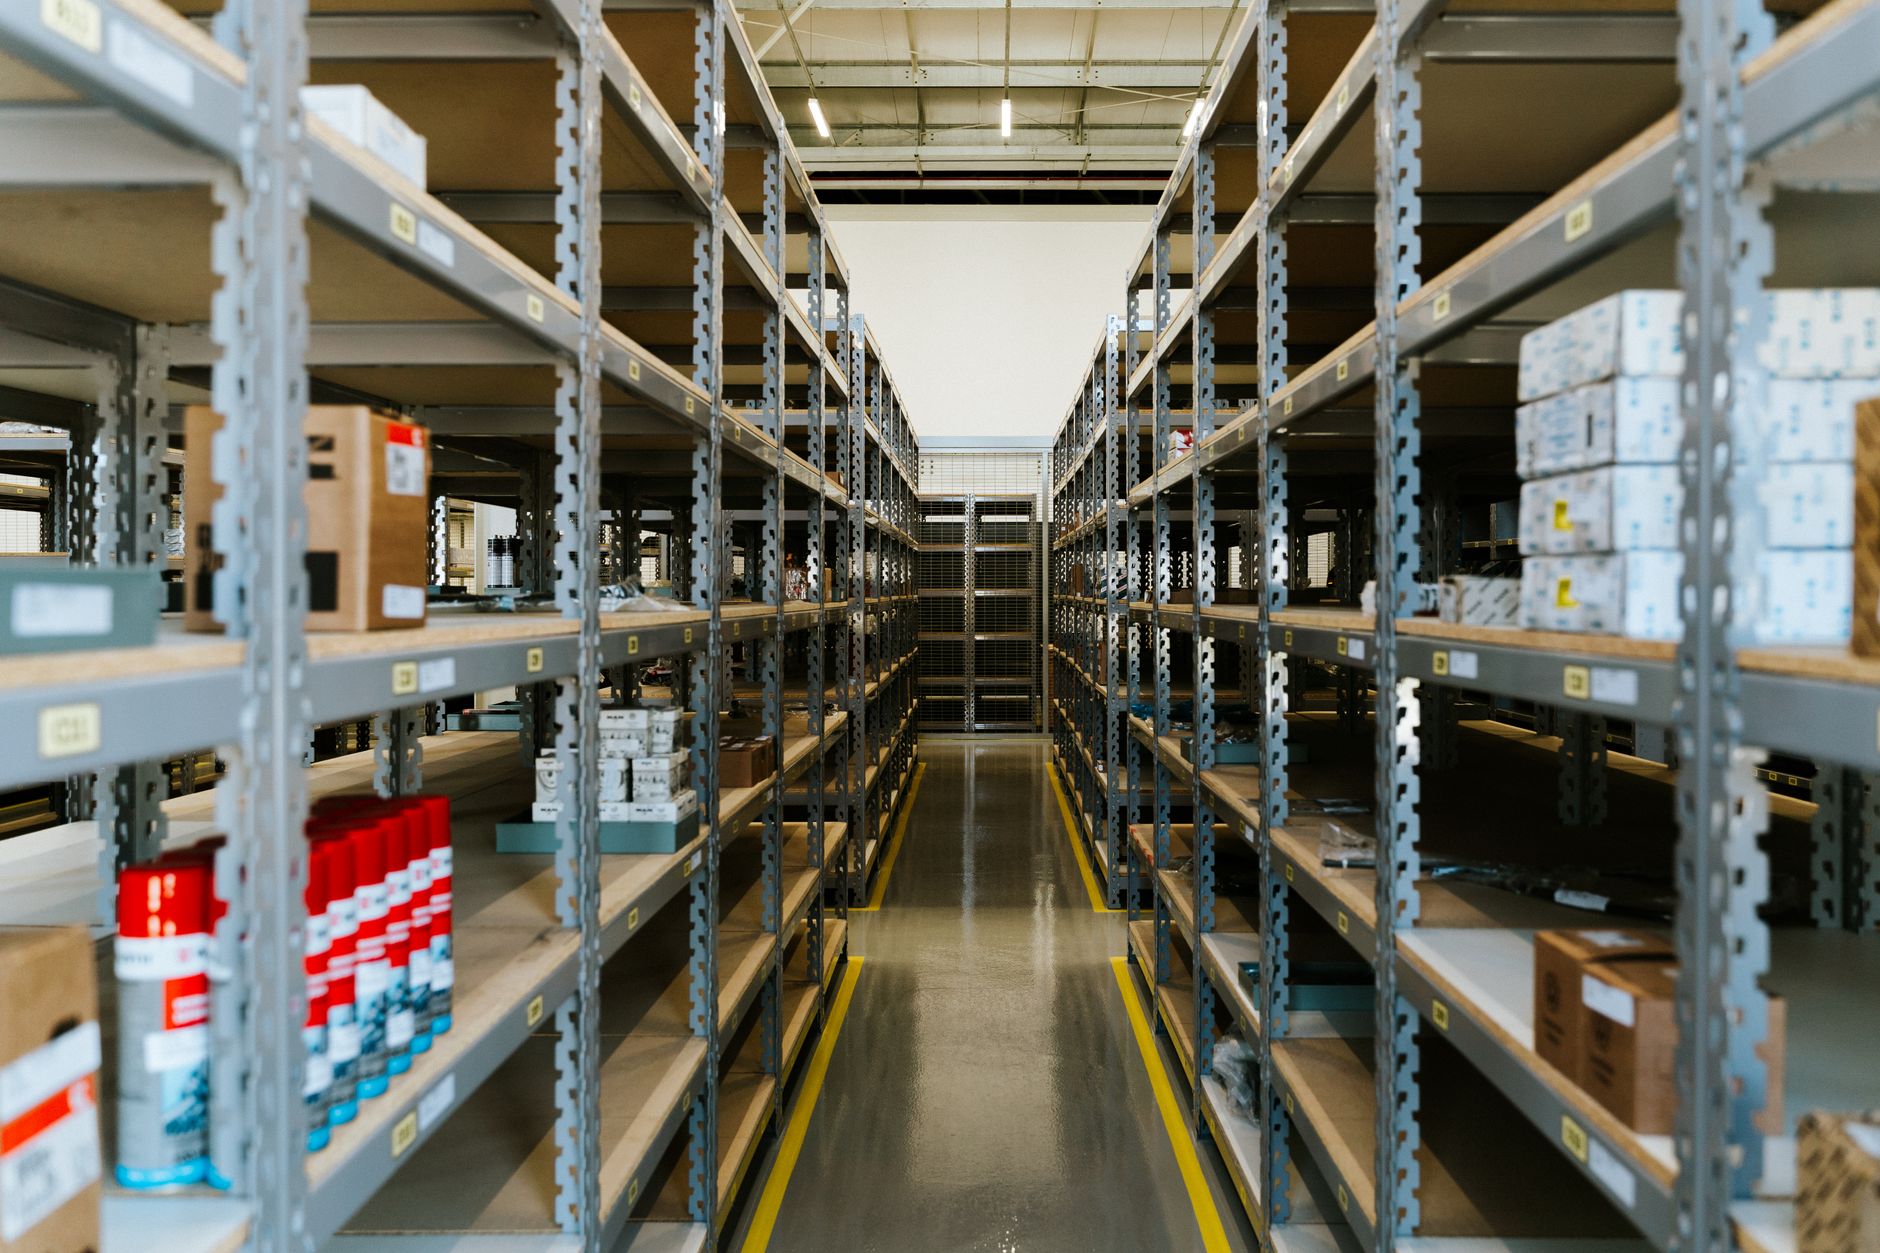
Log the same inputs at every site, or the comparison collapses. Four measures are enough to start, and each one should come from a record rather than memory.
Most sites already track the first two. The autonomous share and the readiness hour are the ones that usually go missing, and they decide whether a robot shift actually relieves the crew.
- Operator hours per day on floor care, logged for the same zone rather than the whole building
- Square feet covered per run, and the number of runs completed per shift
- Share of scheduled runtime spent in autonomous mode
- The hour the floor must be ready for the first business day
What do published case figures actually show?
Performance Food Group's case study for the Tennant T16 AMR says a manager put the prior manual scrubber at two to four hours of operator time per day. It reports more than 110 hours of autonomous runtime, with deployment beginning in 2024. That is one site, reported by the vendor, but it gives a before and after pair you can test against your own labor log.
Domus Building Cleaning, in its Tennant X6 ROVR case study, reports about 20 autonomous cleaning hours per week, more than 2.5 hours per day on average, and 99.2% of runtime in autonomous mode. Those are useful shape markers for a benchmark. They say little about traffic, which often matters more than hours.
Two other cases are harder to use. Brain Corp reports that a major grocery retailer saved 33,649 hours across its stores in 2024 with Tennant T380 AMRs, but that figure is chain wide and cumulative, so it cannot be divided into a per store number. Avidbots says its scrubber saved hundreds of hours at DSV Canada, with no exact figure published.
What does industry data add to a benchmark?
According to the International Federation of Robotics, as reported by Robotics Tomorrow in October 2025, professional cleaning robot sales rose 34% to more than 25,000 units in 2024. That made cleaning the third largest professional service robot segment, and most of those units were deployed for floor cleaning. Total professional service robot sales reached almost 200,000 units, up 9%.
These totals show where the market is heading. They say nothing about what a peer site spends on its floors. IFR also advises against comparing figures across separate World Robotics reports, so do not splice a 2024 number onto a later one and call the result a trend. No 2025 cleaning breakdown turned up in the sources reviewed for this piece, so check the IFR release directly before anyone quotes one.
Where is the published data still thin?
Four gaps stand out. First, nearly every operator figure is vendor reported, which means it reflects the customers the vendor chose and the metrics it chose to publish. Second, hour definitions vary. One case counts operator time, another counts autonomous runtime, and a third counts chain wide hours saved.
Third, few published studies pair hours with zone size, traffic and surface type, so the numbers cannot be normalized for your building. Fourth, some labor cut percentages and dollar savings on hotel and retail blogs trace back to no checkable primary source. Keep them out of your budget until a source you can open backs them up.
How do you compare without guessing?
Start with eight weeks of your own log for one zone. Pick three to five peers that share your surface and shift pattern, then ask each for the same four inputs. Where a peer will not share its hours, record that gap as unknown rather than filling it with an estimate.
Compare trends, not single nights. One bad shift does not mean you have fallen behind, and one good week does not mean you have caught up. A drift that holds for several weeks, against peers who are holding steady, is the signal worth acting on. Write down the date each change started so the comparison stays honest.

What should you do once a gap is confirmed?
Test the fix on one overnight zone before changing the whole building. A floor scrubber lease quoted after a site assessment lets you measure one night shift against your log, which is a cleaner decision than reacting to a headline. Service Robot Co. works this way for US businesses. We are OEM neutral, so we select robots across manufacturers for the floor in front of us, then finance, deploy, integrate, train and service each unit through a nationwide US engineer network.
Our site assessment comes first, and the robot lease is then quoted as one fixed payment on a three year lease. Run the pilot against the four inputs above, and let the log decide whether the rest of the building follows.
Frequently asked questions
Want a robot working for you?
Tell us the job and the site. We will recommend the robot, quote the lease, and keep it serviced.
Sources
- Robotics Tomorrow: IFR service robots report, October 7, 2025
- Performance Food Group Tennant T16 AMR case study
- Domus Building Cleaning Tennant X6 ROVR case study
- Brain Corp: major grocery retailer Tennant T380 AMR case
- SoftBank Robotics S50 healthcare case study, 2023
- Avidbots: DSV Canada case study, Modern Materials Handling