Key takeaways
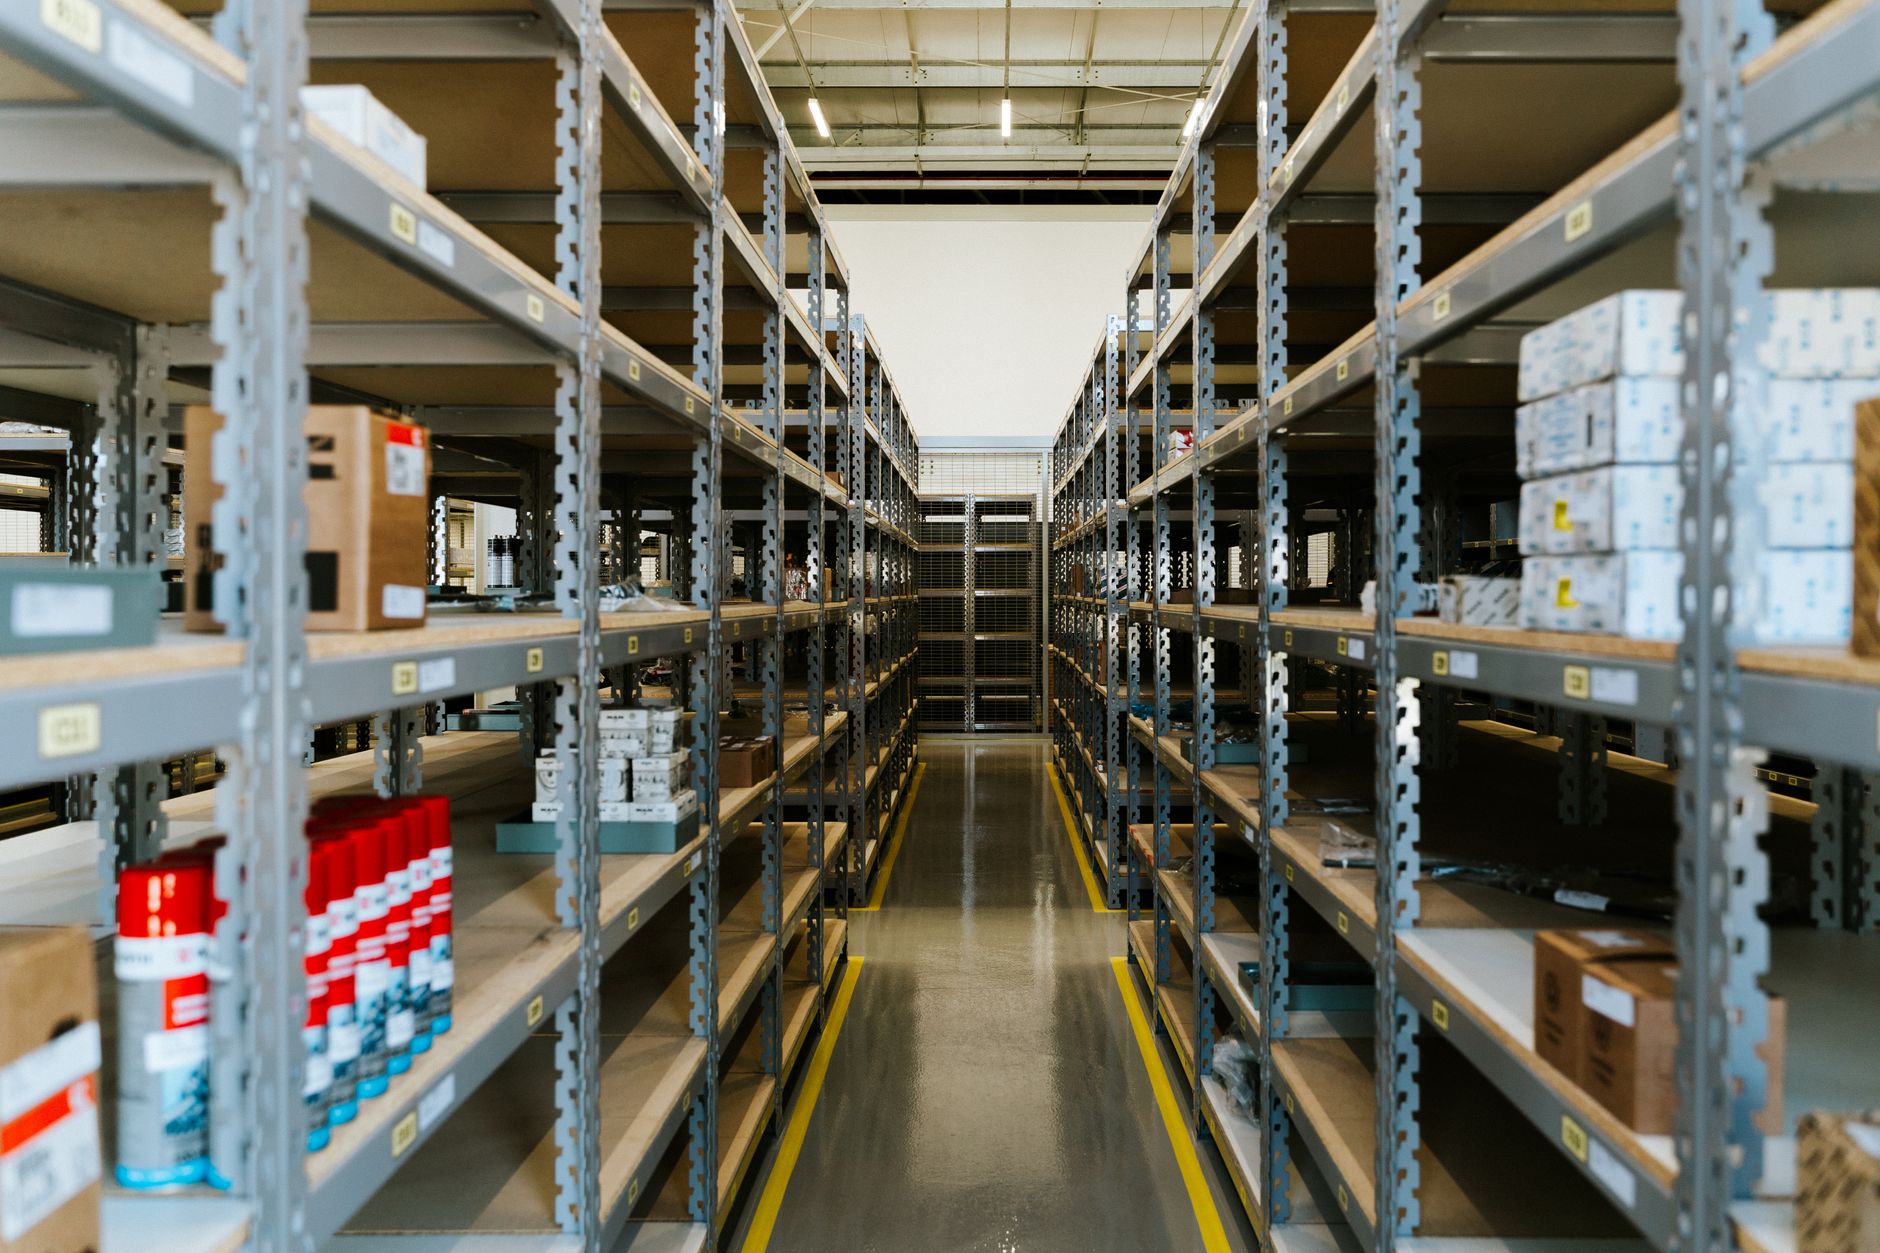
- Transport and logistics was the largest professional service robot category in 2025, at 117,500 units and about 47% of sales.
- Professional service robot shipments rose 24% to almost 250,000 units, so transport sits inside a fast-growing total.
- The figures come from a supplier sample of 238 producers and should not be projected onto the whole market.
- Choose a first project from the repeated tasks and idle hours at your own site, not from the category headline.
- One leased unit, measured against your shift data, will teach you more than any sector share.
Which category led 2025 professional service robot sales?
Transport and logistics was the largest professional service robot category in 2025. Data from the International Federation of Robotics (IFR), as relayed by SupplyChain247, puts the category at 117,500 units, up 21%, or about 47% of the professional service robot total.
The coverage describes that 47% as a share of sales, so this article uses the word sales. The share shows where most of the 2025 volume went. It says nothing yet about what your building needs first.
How large is the total market, and where do the rest sit?
Global professional service robot shipments rose 24% to almost 250,000 units in 2025, according to IFR as reported by Supply Chain Digital and Kyodo. Transport's 117,500 units fit inside that total, which is why its share lands near half.
Hospitality ranked second at 14%, and professional cleaning ranked third at 12%, per the SupplyChain247 report. Those are the closest comparison points for a floor care buyer, and both trail transport by a wide margin.
One caution on the headline figure. A Kyodo release headline says 117,000, but its body text gives 117,500. This article uses the body figure.
What does the 238-producer sample leave out?
The figures rest on a supplier sample of 238 producers, drawn from a pool of 1,001 manufacturers. IFR's coverage says the totals are not projected onto the whole market.
IFR also cautions against comparing figures across reports, because the sample's composition can change from one year to the next. Read the 47% as a description of the suppliers surveyed, not as a forecast for every warehouse, hotel or hospital.
Which signs favor transport, and which favor floor care?
Category size answers a market question. Your first project needs a site answer, and that depends on where repeated tasks and idle hours actually sit in your building. Start by checking which problem recurs most often and which one costs the most when it slips.
Transport tends to lead when the signs below show up on your floor. Floor care leads when floors go uncleaned during hours your staff cannot cover, or when debris and wet spots build up between shifts. A building with a strong night crew and heavy material moves may have a clearer case for transport first, while one with unfilled night hours may find floor care more urgent.
- Material moves repeat on the same routes many times per shift, between the same stations.
- Staff carry heavy loads through zones that pull them away from picking, receiving or bedside work.
- Aisles, doors and elevator lobbies are clear enough to map, with few standing obstacles.
What does the 12% cleaning share mean for floor care?

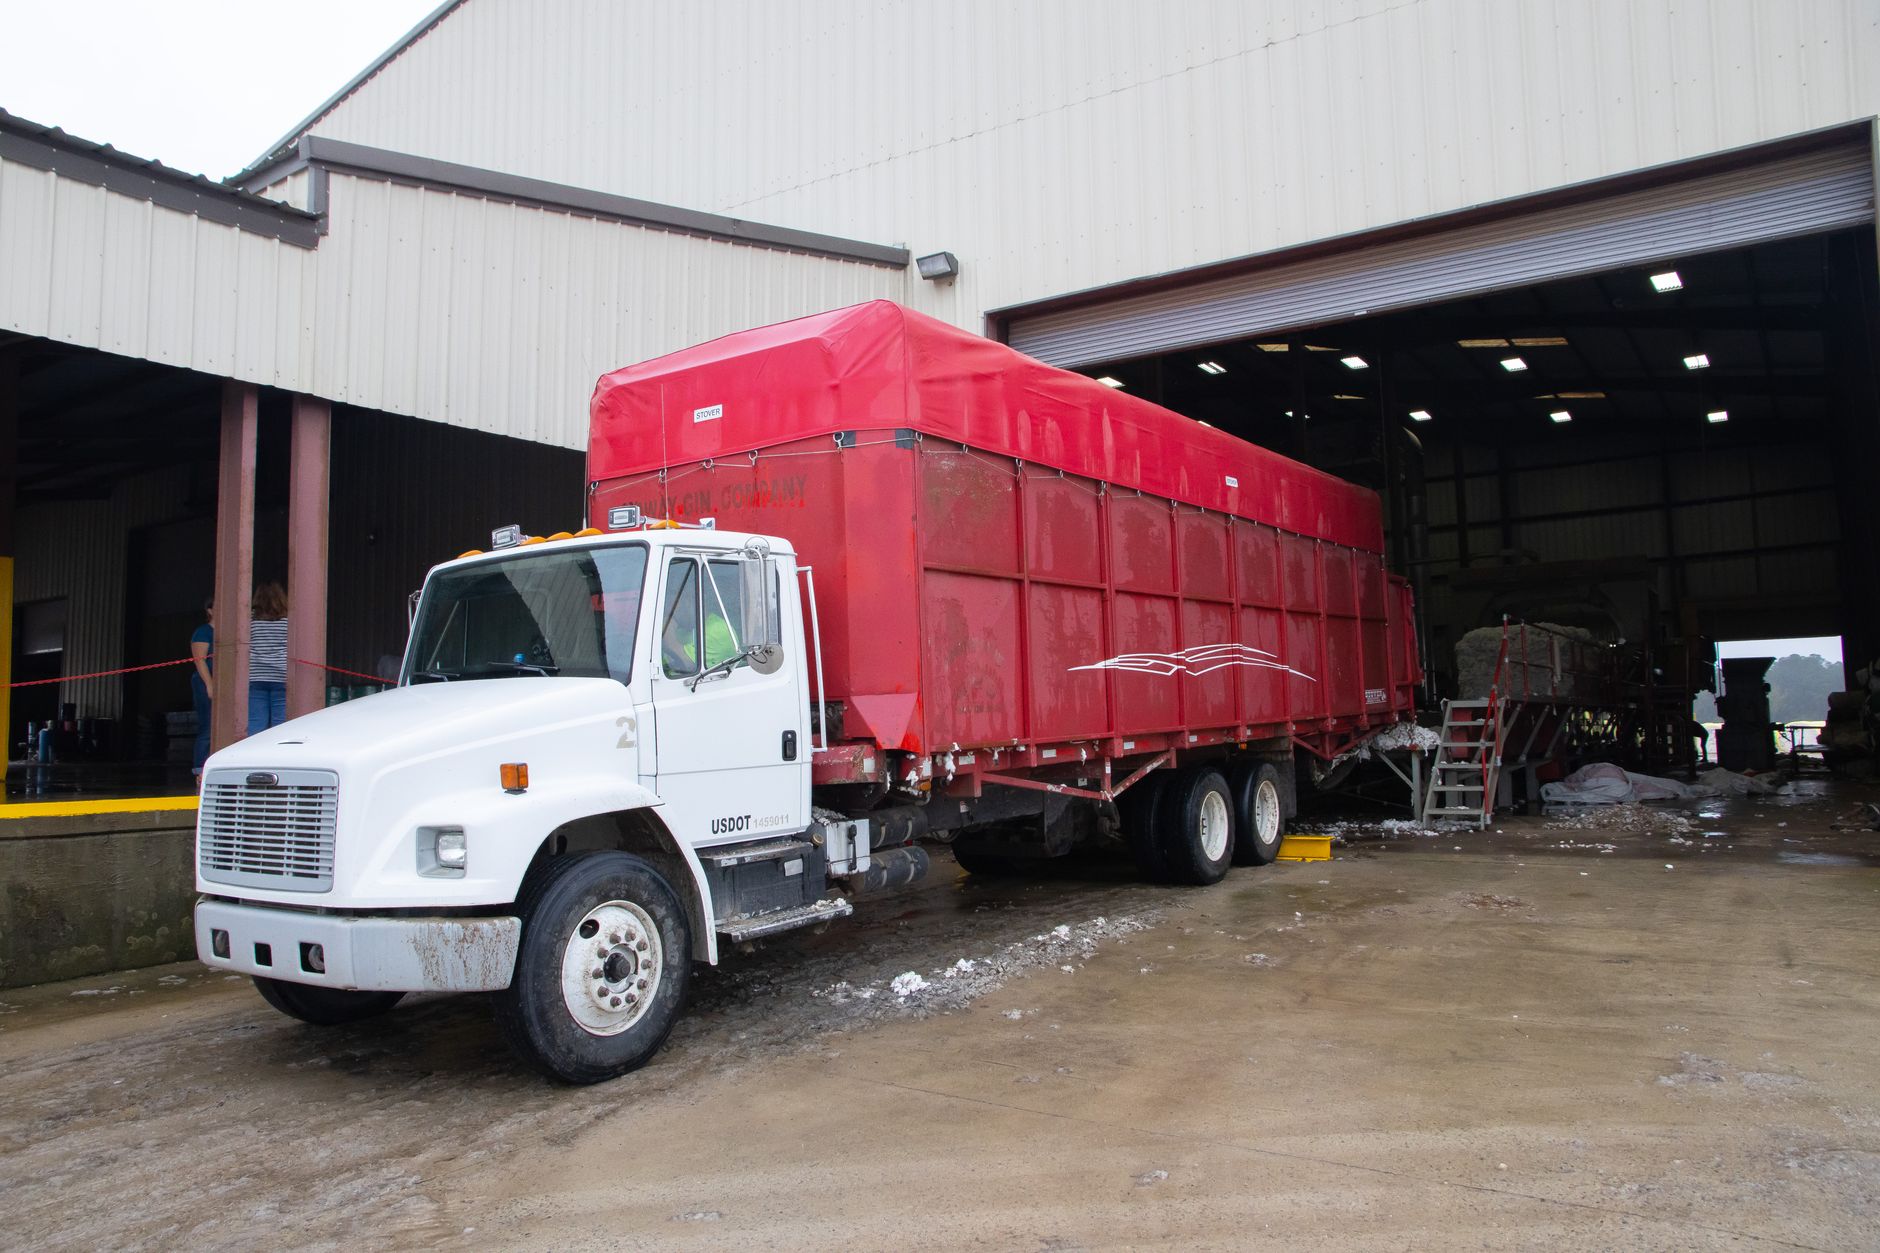
Professional cleaning placed third at 12% of the total. That is a real share of a large market, but the coverage did not break out floor scrubbing, sweeping or vacuuming, so any floor care case should rest on your own zones and hours.
Overnight hours deserve the first look. A floor robot's value often lies in the hours nobody else covers, and those hours differ from one building to the next. Count them before you compare categories.
How does the business model shape the first lease?
Traditional equipment sales remain the largest model overall in the IFR data as relayed. The same coverage reports that the service-contract model is already dominant among the US suppliers in the survey. For a facility team, the model decides who answers when a unit stops, which matters as much as the robot's category.
Service Robot Co. is an OEM-neutral integrator. We select robots across manufacturers, then lease them through financing on a 3-year lease, with one fixed lease quote issued after a site assessment. Every unit is serviced under RoboCare, our service plan, by regional service engineers in each state we serve, so a transport robot and a floor unit can sit under one team.
How should a first project be scoped?
Start with one zone and one robot type. Measure what it covers on your floors, and expand only when the log shows the work repeats cleanly. A site assessment maps the route, checks doorways and elevators, and sets the zone limits before any quote is written.
Keep the measures plain: hours covered, stops, and exceptions that needed a person. Those three figures will tell you more about your building than any sector share.
What should a facility team not conclude from the headline?
The 47% figure does not show that transport pays back faster than floor care. The coverage reports sales share and unit growth, and it includes no payback, lease cost or return data to support such a claim.
It also does not show that your site will grow at the sector pace. Use the headline to decide where to look first, then test that choice against your own shift data before you commit.
Frequently asked questions
Want a robot working for you?
Tell us the job and the site. We will recommend the robot, quote the lease, and keep it serviced.