
an airport chocolate retailer comparing a humanoid greeter with a tablet kiosk
Retail Case Study: 26x More Interactions Than a Tablet Kiosk
A documented airport retail test found a humanoid greeter drove 26x more interactions than a tablet kiosk, with longer engagement and stronger sales.
- 26x
- more interactions
- 46%
- longer average interaction
- 6.5%
- store entry rate
- EUR 643.64
- sales per 1,000 passersby
Based on a documented real-world deployment. Figures are from public reporting; the organization is not named.
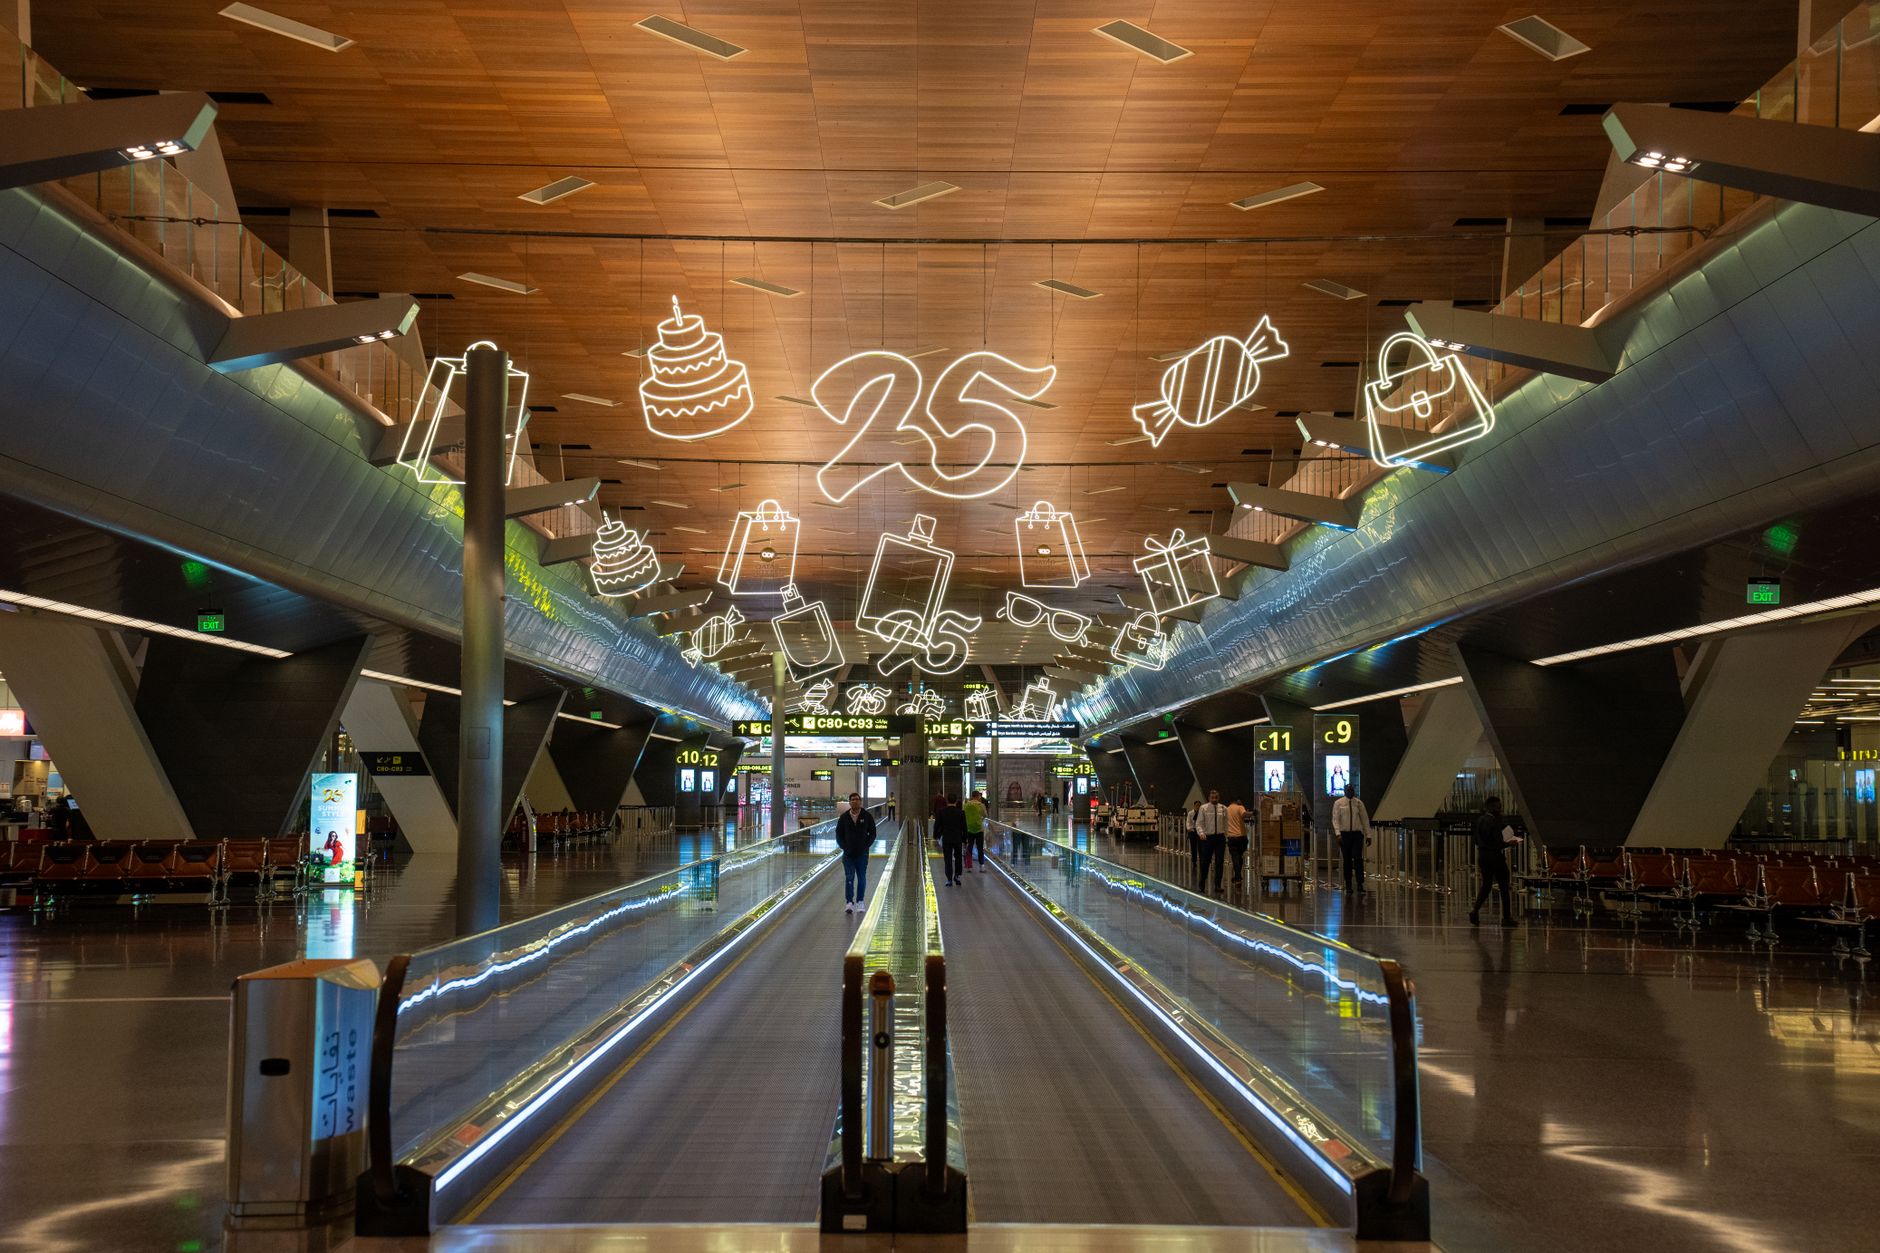
A noisy concourse and a narrow purchase window
The retailer was selling in one of the hardest front-of-store environments in retail. Airport foot traffic is hurried, distracted, and flooded with competing stimuli, so earning even a moment of attention is difficult.
A standard touchscreen can present an offer, but it may not stop people cold. The operating question was whether a humanoid customer-service robot could pull more travelers from passing glance to store entry and purchase than a tablet kiosk running the same basic invitation.
- Win attention in fast passenger flow
- Turn a brief encounter into store entry
- Measure real behavior and sales, not stated intent
A live storefront test with real sales data
The study observed an airport chocolate retailer over four days in October 2017. Across 72,457 passersby and 28 hours of video, the storefront alternated between two conditions: a tablet kiosk and a humanoid greeter placed in front of the store.
Both setups invited travelers to take a short quiz about chocolate and the store. Participants could win a discount voucher and receive a free taster collected inside, while researchers tracked screen touches, interaction time, store looks, store entries, purchases, and spending without intervening in the interaction.
- Place one front-of-store device at a time
- Keep the shopper prompt consistent across both conditions
- Track behavior at each funnel stage and match it to actual transactions
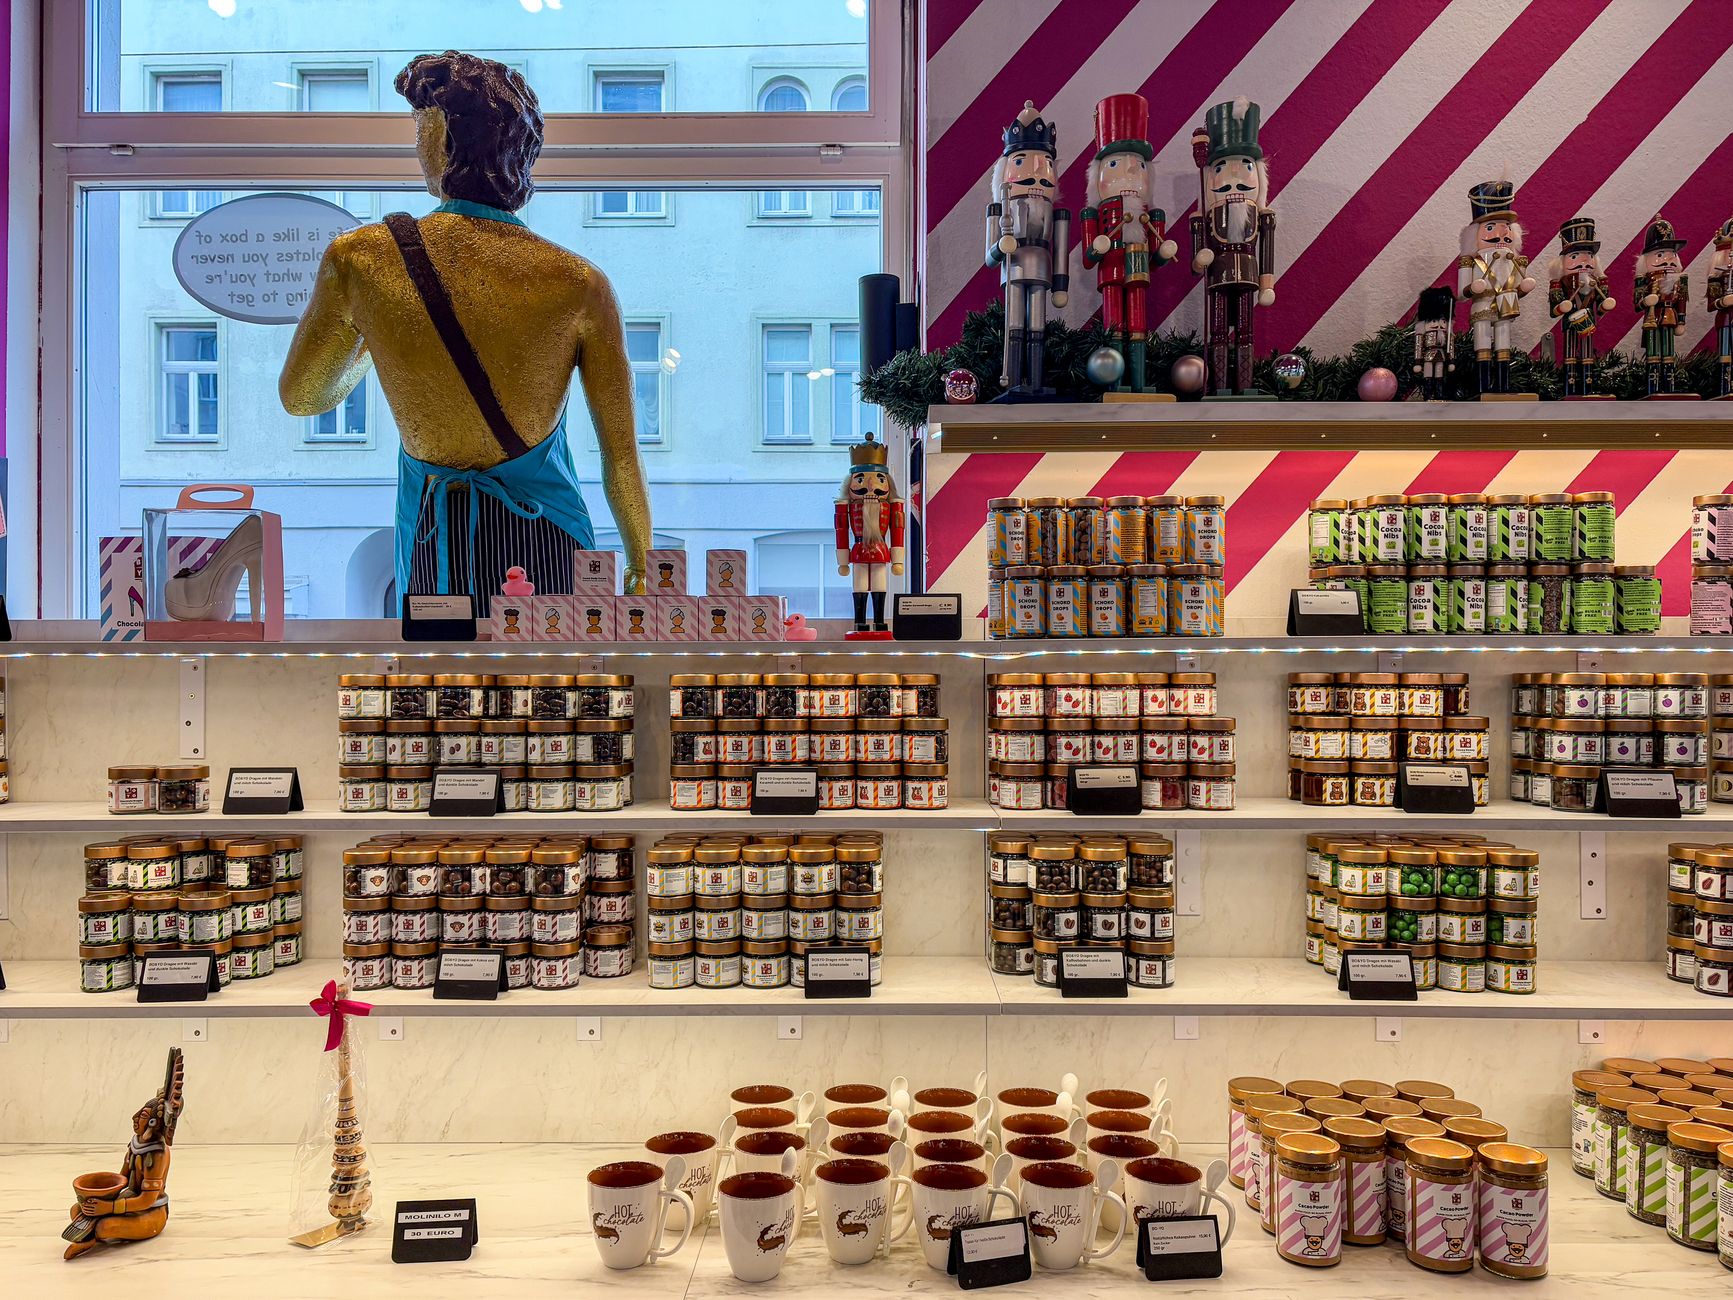
The humanoid pulled more people deeper into the funnel
The headline result is exact, not inflated. The humanoid drew 929 interactions from 36,066 passersby, or 2.6 percent, while the tablet drew 34 interactions from 36,393 passersby, or 0.1 percent. Average interaction time rose from 53.56 seconds to 78.25 seconds, which the paper summarizes as a 46 percent lift and nearly 50 percent longer engagement.
The lift carried into store traffic. With the humanoid in place, 29.8 percent of passersby looked at the store versus 25.5 percent with the tablet. Store entry rose to 6.5 percent from 5.1 percent, and the share of store visitors who bought something rose to 33.40 percent from 25.40 percent.
Commercial outcomes improved as well. Unique registered purchases rose from 470 to 786. Purchases per 1,000 passersby increased from 12.91 to 21.79, average spend per transaction increased from EUR 26.86 to EUR 29.53, and spending per 1,000 passersby rose from EUR 346.17 to EUR 643.64.
What this means for retail operators evaluating Service Robot Co.

This documented example is not a Service Robot Co. deployment, but it is a useful retail benchmark. In a high-traffic store, a humanoid customer-service robot did more than entertain. It created materially more storefront interactions, held attention longer, and improved downstream conversion into entry, transactions, and spend.
Service Robot Co. is the full-service, OEM-neutral commercial robot integrator for U.S. businesses. We help retailers compare purchase or lease, commercial robot leasing, service robot leasing, and robot leasing for business, then finance, deploy, integrate, train, and service every unit through a nationwide U.S. engineer network. One partner and one number for the whole lifecycle.