
a private outpatient pharmacy in the Middle East
Outpatient Pharmacy Case Study: Wait Time Cut 53% in 10 Months
A private outpatient pharmacy in the Middle East cut average patient wait time 53% in 10 months after robotic dispensing, while pharmacist productivity rose 33%.
- 53%
- lower average wait time
- 20%
- higher wait-time satisfaction
- 33%
- higher pharmacist productivity
- 22%
- higher overall satisfaction
Based on a documented real-world deployment. Figures are from public reporting; the organization is not named.

Growth Pressed Against A Manual Workflow
The pharmacy was planning for outpatient demand to grow 25% per year across both 5-year and 10-year horizons. At the same time, average wait times were rising, satisfaction with wait time was slipping, pharmacist productivity was flat, and reported dispensing errors were moving the wrong way.
The preautomation process carried too many manual touches. Stock-up was manual, picking was manual, delivery to the dispensing point relied on manual carry, and inventory was reconciled manually twice a year. The site needed more throughput and better control without relying on a larger staffing base, since preimplementation and postimplementation FTE levels were roughly equivalent.
- Projected outpatient growth of 25% per year
- Declining satisfaction around pharmacy wait time
- Flat pharmacist productivity before go-live
- Manual stock, picking, carry, and inventory steps created choke points
How The Dispensing System Was Introduced
The team treated the project as a redesign of the dispensing flow, not a hardware purchase. It reviewed baseline data, mapped choke points in the preimplementation process, and recruited personnel working at those trouble spots into the project team so the new workflow reflected the realities of the live pharmacy.
System sizing was tied to actual demand. The study says selection criteria were built around about 2,000 packs per day, 1,300 patients and 1,300 prescriptions a day, about 10 packs and 10 lines per prescription, and roughly 2,000 lines held. Interoperability was also a hard requirement, with HL7 capability needed to connect the robotic dispensing system to appointments, medication records, and prescription flow.
Physically, the pharmacy installed two robotic units, each with capacity for 12,500 medications, feeding 10 dispensing desks through belts and spiral chutes. The before-and-after design was measured over 21 months, with 11 months of baseline data collected before the August 2019 go-live and results tracked monthly after launch.
- Review baseline data and pinpoint choke points
- Size storage and picking capacity to real script volume
- Require HL7 and health-system integration before go-live
- Replace manual stock handling and carry steps with automated storage and conveyance
What Changed After Go-Live
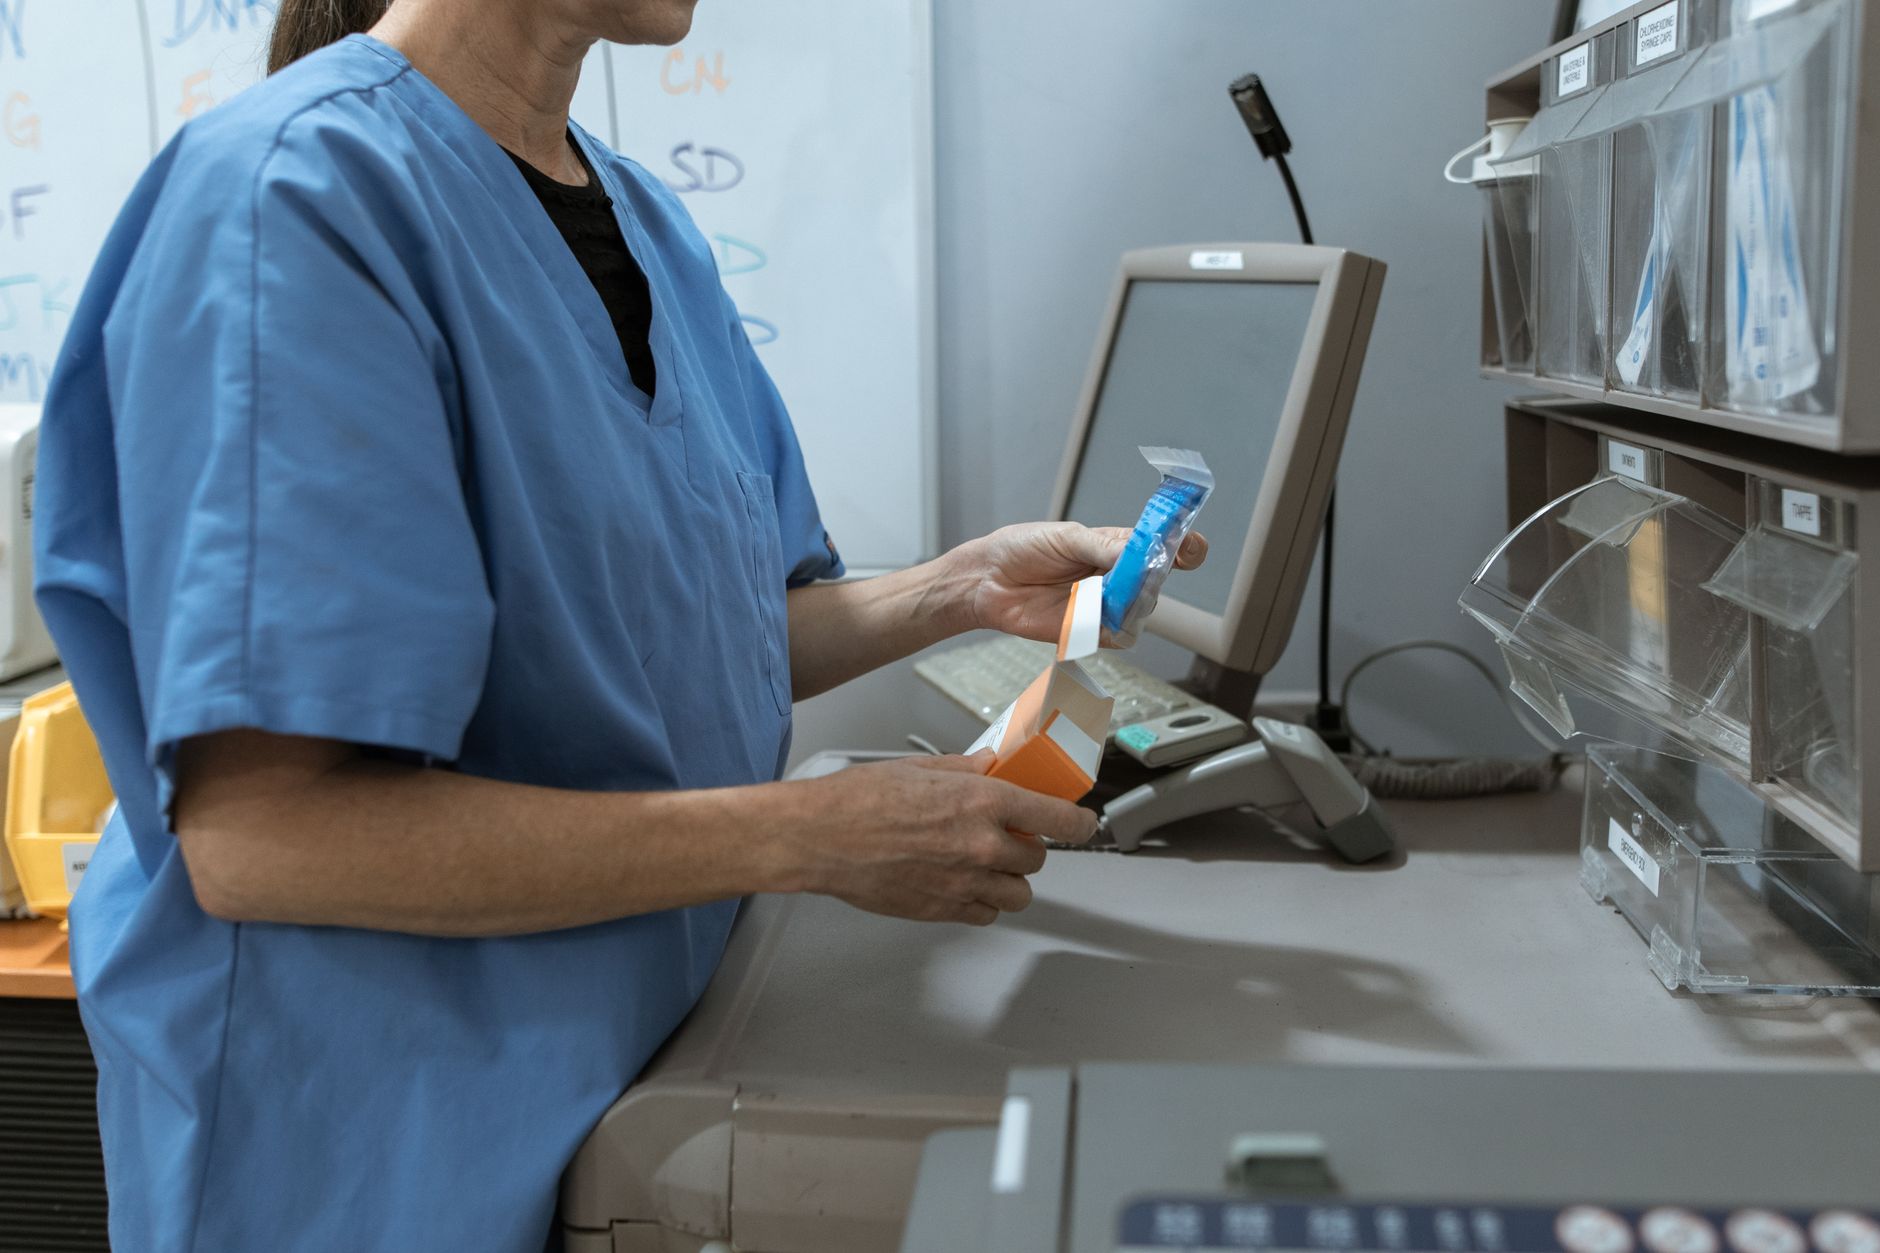
Ten months after go-live, average patient wait time was down 53%. The mean dropped from 15 minutes before automation to 7.90 minutes after, which is the kind of visible shift patients feel immediately at the pickup counter.
Patient sentiment moved with the wait-time data. Satisfaction specific to wait time rose 20%, with postimplementation scores averaging 89% versus 58.67% before automation. Overall patient satisfaction regarding pharmacy services also increased 22%, from 62% to 88%.
The operational lift extended behind the counter. Daily prescriptions per pharmacist increased 33%, from 43.5 to 60, while prescriptions filled per month rose from a mean of 8,728.45 to 13,587.60 with no change in FTE. The dispensing error rate fell from 1.50 errors per 1,000 items to 0.01 per 1,000 items, and the study reports a zero dispensing error rate at the 10-month point.
Why This Matters Beyond One Pharmacy

This case is valuable because it shows where the gain actually came from. The wait-time improvement was tied to capacity planning, data integration, stock control, and cleaner handoffs inside the pharmacy. The robot mattered, but the operating model around it mattered just as much.
For U.S. operators, Service Robot Co. is a full-service, OEM-neutral commercial robot integrator. In practice that means a vendor neutral robot integrator that can assess the workflow, choose the right system across manufacturers, and carry robot deployment and integration, financing, training, and service through one partner and one number. Buyers debating buy or lease monthly still need the same discipline after signature: phased deployment no shutdown where practical, a monthly model with no capital outlay when it fits, and RoboCare™ service through remote triage, on-site dispatch, and a nationwide engineer network.