
The short answer
Autonomous forklift ROI in Las Vegas comes from the hours of laborers and freight, stock, and material movers, hand type of work that a robot takes over, minus the fixed lease payment and the service cost. Savings are a range that moves with how many repeatable forklift hours your site runs each week and how much of that work a robot realistically handles. The calculator on this page gives a Las Vegas range, and a free site assessment turns that range into a quoted figure.
Key takeaways
- The return comes from repeatable labor hours a robot takes over, net of the lease and the work it cannot do.
- Las Vegas has a large logistics base, so the hours to offset are real, not theoretical.
- High turnover in warehouse work adds hiring and training time on top of the hours themselves.
- The share of work a robot can take on its route sets most of the range, more than headline speed does.
- A free site assessment replaces our planning assumptions with hours counted on your floor.
Run the numbers for your site
Auto-detected from your location - we use the real BLS wage here. Not right? Pick your city or state above.
What do you want to automate?
The robot takes the repetitive cart and pallet moves off the heaviest motion.
What is autonomous forklift ROI in Las Vegas?
Autonomous forklift ROI in Las Vegas is the return a business gets from moving pallets and freight with a robot instead of, or alongside, people on a fixed schedule. For most sites the return has three sources: labor hours that no longer need a person, shifts that are hard to fill, and steadier throughput on night and repeat runs. A robot does not remove the need for planning, supervision or exception handling, so the return should count only the hours it truly takes over.
The math is simpler than vendor decks often suggest. You measure the hours of material movement per week, estimate the share a robot can do on its route, and compare the value of those hours with the fixed lease payment and service cost. A site that moves freight in long, repeatable runs gets a far better return than one that moves it in short, changing batches.
This page works through the Las Vegas case so you can check each step against your own floor. The figures come from government, trade and industry sources, and where a number is our planning assumption, we say so. Where a source is secondhand or covers a different scope, we say that too.
How many people do this kind of work in Las Vegas?
The work an autonomous forklift takes over falls under the laborers and freight, stock, and material movers, hand type of work. According to the BLS Occupational Outlook Handbook, hand laborers and material movers had 2,940,300 jobs nationally. A salary aggregator citing May 2025 OEWS data shows a slightly different national count, so treat the national base as an approximate starting point, not a precise one.
Nevada carries a concentrated share of this work. The BLS May 2023 estimate for Nevada lists 46,050 employed in this occupation, 31.08 per thousand jobs, and a location quotient of 1.57. A location quotient above 1 means the job is more concentrated in Nevada than in the country as a whole. The government wage data on this page gives the local wage for this job.
The metro picture is less tidy. According to FRED, the St. Louis Fed's database, transportation and warehousing employment in the Las Vegas metro was 70.2 thousand in 2023, 70.4 thousand in 2024 and 69.1 thousand as the 2025 annual average. A Nevada GOED logistics report, using a commercial labor data provider rather than BLS, lists 79,632 logistics jobs in the metro for 2025, revised from 81,707 in its earlier edition. The two sources cover different scopes, so read them as a range, not a single count.
For a buyer, the local labor base is large enough to make repeat material movement a real line item. It also means no single site should be assumed to match the metro average. Use the regional figures to confirm the pool is deep, then use your own counted hours to size the return.
Median hourly wage, Laborers and Freight, Stock, and Material Movers, Hand
$4,322
Monthly cost of one full-time worker in Las Vegas, NV, at the median wage plus payroll costs (an estimate, not a quote).
How many labor hours can an autonomous forklift take over?
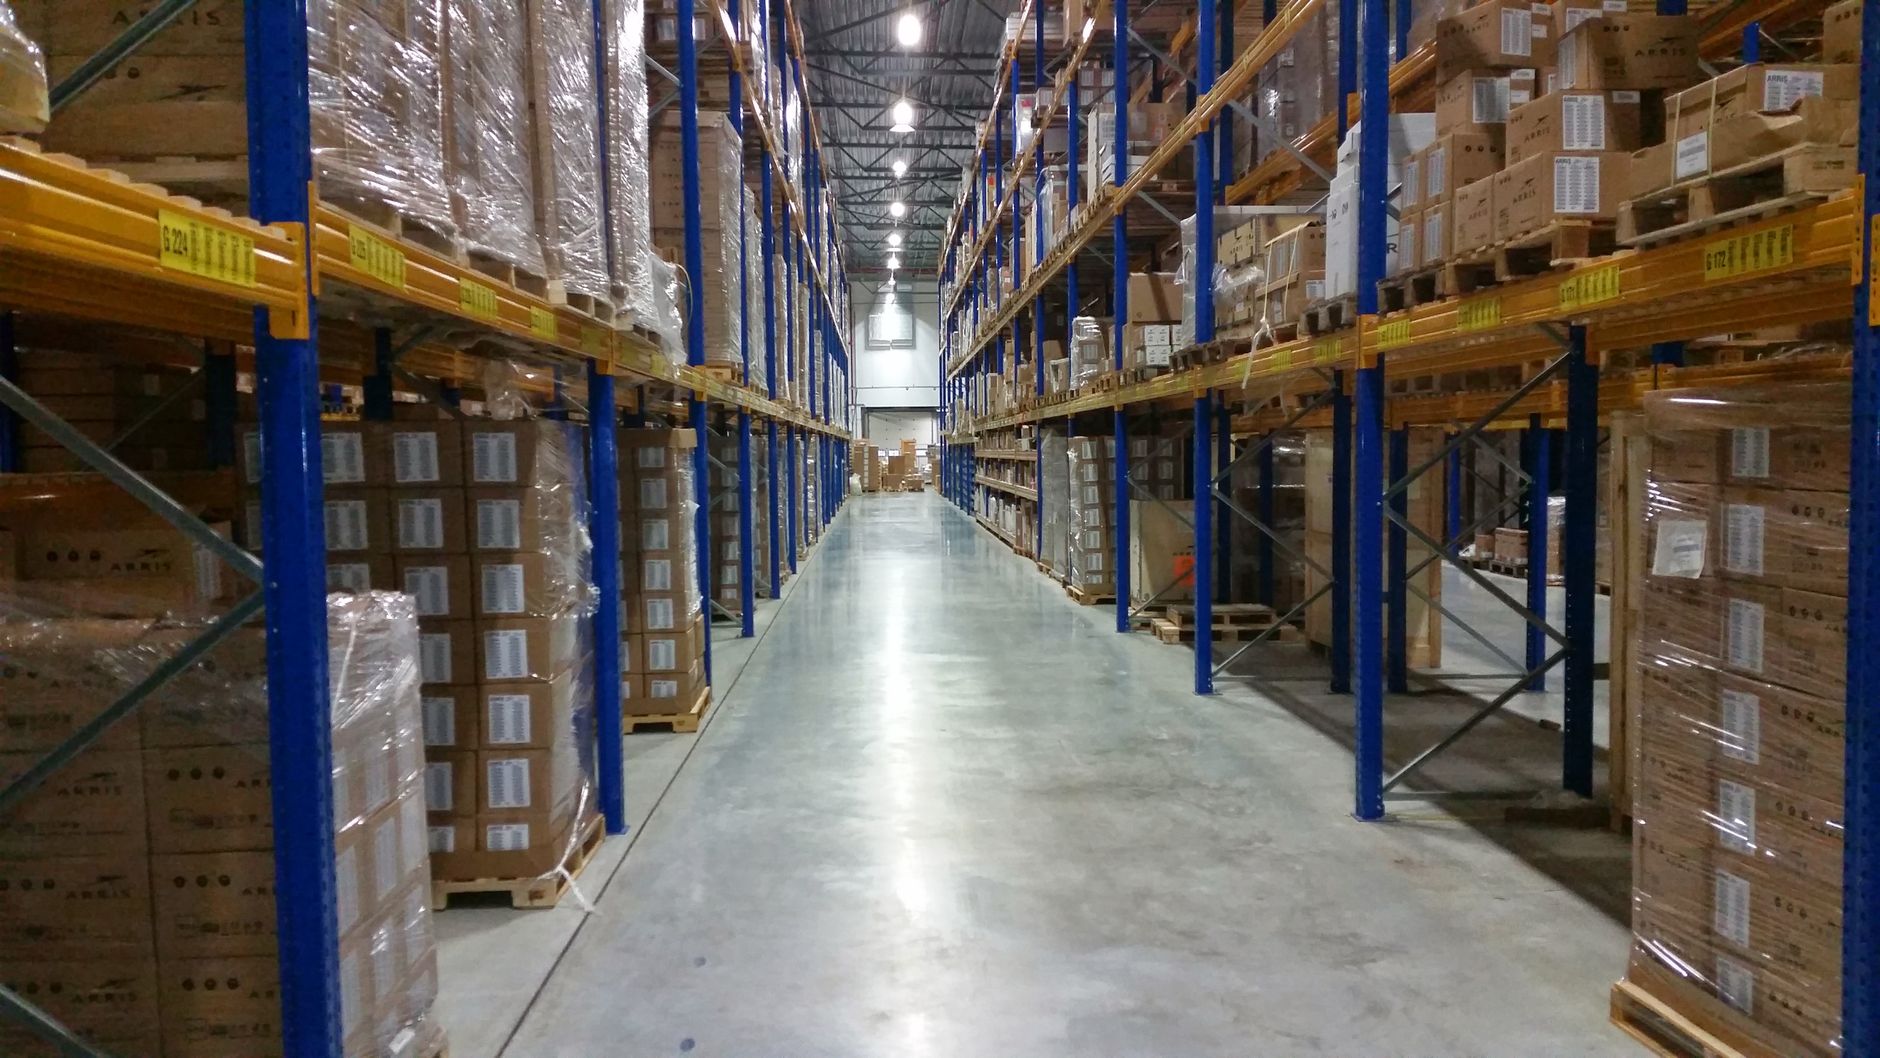
Hours are where the return starts. Count the moves that follow a fixed route: receiving to staging, staging to racks, racks to dock, and overnight replenishment. These are the runs a robot handles well. Exception work, such as damaged pallets, mixed loads and dock changes, stays with people. The share of repeatable time varies a great deal with layout and product mix, so measure it rather than assume it.
Turnover adds a second layer. A 2026 staffing industry page reports 35% to 49% annual turnover in warehouse and fulfillment work, attributing it to BLS JOLTS data it does not table, so treat that figure as secondhand. A National Employment Law Project brief found about 124% annual turnover at one large employer's New Jersey warehouses in 2020, against about 72% at other New Jersey warehouses. That is one employer in one state, so it shows the scale of churn rather than a typical rate. Each departure carries hiring and training hours that rarely show up as a line on a payroll report.
To count hours, pull a sample of forklift logs or timed observations across at least a full week, including one overnight period if the site runs one. Sort each move into repeatable or exception, then total the repeatable time by route. A sample that spans a full week is a reasonable starting point, and a longer one is safer when volumes swing seasonally.
The table below shows the kind of breakdown to build for your own site. The hour descriptions are illustrative placeholders for the arithmetic, not measurements from any building. Your site assessment replaces them with counts.
How does the savings math work?
The core formula is simple. Take the hours of repeatable material movement per week, multiply by the share a robot realistically handles on its route, and value those hours at the local wage for this job from the government wage data on this page. Then subtract the fixed lease payment, the service cost and any supervision the robot still needs. What remains is the return before any gains from steadier throughput or fewer missed shifts.
In symbols, let H be repeatable hours per week, S the share a robot takes, W the local wage for this job, L the lease and service cost expressed per week, and R the remaining supervision time valued at the same wage. The weekly return is roughly H times S times W, minus L, minus R. Every term is uncertain, and because the terms multiply, a wide uncertainty in the share or the hours widens the whole range. That is why the honest output is a window, not a point.
The calculator on this page computes a Las Vegas range from the wage data and the hour assumptions it carries. Raise the repeatable hours or the share and the range moves up. A lower share, a longer exception list or a larger fixed payment pulls it down. Treat the calculator as a planning tool that brackets the answer, not as a quote.
- Hours of repeatable material movement per week
- Share of those hours a robot realistically takes on its route
- Value of those hours at the local wage for this job
- Minus the fixed lease payment, the service cost and remaining supervision
What changes the number up or down?
Three things move the range more than anything else: how repeatable the routes are, how many forklift hours sit on those routes, and how much exception work remains. Layout matters too. Wide aisles and clear travel paths help. Tight corners, floor loading and frequent changes in pallet size reduce the share a robot can take.
Staffing conditions shift the number as well. High turnover makes each departure costly in hiring and training time, which strengthens the case. Local job numbers also change. According to FRED, Las Vegas metro transportation and warehousing employment fell from 70.4 thousand in 2024 to 69.1 thousand in 2025, so any return built on local hiring pressure needs a sensitivity check. A softer local job market can ease recruiting, which weakens the hiring pressure part of the case, while the repeatable hours stay the same.
Lease terms are the other lever. The length of the lease, the service scope, and whether a backup unit is included all change the fixed side of the calculation. Compare quotes on the same terms before reading them against the range.
Autonomous forklift vs. a person on the shift: where does each win?
The robot is not better at everything. It wins on steady, repeatable runs, on night coverage without staffing a second shift, and on consistency when a route stays the same. A person wins on judgment, on handling damaged or unusual loads, on reading a dock that has changed, and on any task that needs a decision in the middle of a run.
The useful question is which tasks belong to which. In practice, the plan that holds up keeps people on exceptions and planning, and moves the predictable hours to the robot. The comparison below is honest about where each side is stronger.
- Night coverage
Autonomous Forklift
Works through a loaded replenishment queue without a staffed second shift
Staff
Needs a staffed shift, with hiring and turnover to manage
- Repeat routes
Autonomous Forklift
Follows the same path with consistent timing
Staff
Accurate, but output varies with staffing and fatigue
- Damaged or mixed loads
Autonomous Forklift
Stops or hands the load to a person
Staff
Handles the load directly with judgment
- Changed layout or dock
Autonomous Forklift
Needs remapping before the route works again
Staff
Adapts on the spot
- Training time
Autonomous Forklift
Route set up once, with staff trained to supervise
Staff
Trained per person, and retrained as turnover happens
What are the risks to the return, and how do you avoid them?
The main risk is overcounting hours. A robot takes only the work that fits its route, so a return built on total forklift time will overstate the savings. Avoid this by measuring repeatable hours separately from exceptions, and by starting with one route before committing to a fleet.
Safety is the second risk, and it cuts both ways. An OSHA directive estimates that about 1.5 million workers operate more than 855,900 powered industrial trucks, with roughly 85 forklift fatalities and 34,900 serious injuries per year (FY2018 estimate). A secondary summary of OSHA data reports 78 work-related deaths and 7,290 nonfatal injuries with days away from work in 2020. Those figures are why separating people from robot routes matters, and why the site assessment checks traffic paths before go live.
A third risk is a stalled robot. Plan a backup unit or loaner for critical routes, and set a service response expectation in the lease. A robot that sits idle on a dock stops its hours along with it, so the return can erode quickly.
Also ask whether the robot routes cross pedestrian walkways, and whether the traffic plan has been reviewed in writing before go live. Staff who work near robot routes need training on what the robot does, where it stops and how to clear a blocked route.
What is a realistic timeline from assessment to payback?
Expect the timeline to run in stages. A site assessment and mapping come first, then a route trial on one area, then a phased rollout. Each stage produces measured hours, which is what makes the payback estimate solid. Skipping the trial to save time usually costs more than it saves, because the route is where most surprises show up.
Stage lengths depend on site size, the number of routes and how quickly the layout can be mapped and cleared for trial. A small single-route site moves through these steps faster than a multi-building operation. Plan the calendar around the trial results, not around a fixed date.
Payback is the point where the cumulative return on the robot's routes passes the cumulative cost of the lease and service. Because the range is wide before a trial, the honest answer is a window, and that window narrows as counted hours come in. We handle the sequence on our side. We pick the robot for the site, lease it through financing, deploy and integrate it, train your staff and service it nationwide, so one team runs the timeline.
How do I get a precise figure from a free site assessment?
A free site assessment replaces the planning numbers on this page with your measured figures. We map the building, time the repeatable runs, count exceptions, check traffic paths and talk through the staffing picture. You leave with a clear view of which routes suit a robot and what share of the work that looks like on your floor.
Once the routes are clear, we quote a fixed lease payment and the service terms. The quote follows the assessment, so you see the real number before you decide. Savings stay a range until a trial is done, and we will name the inputs that still need counting.
Bring the figures you already have: forklift hours by task, shift schedules, staff turnover and any incident log. The more of these you bring, the narrower the range will be. Ask us to walk through the lease scope, including service response and backup coverage, so the fixed side of the math is as clear as the hours side.
Frequently asked questions
Put a robot to work in Las Vegas.
We walk your site, learn the job, and recommend the unit that fits. Then we quote the lease, deploy it, and keep it serviced.
Sources
- US Bureau of Labor Statistics, Occupational Employment and Wage Statistics (OEWS May 2024)
- BLS Occupational Outlook Handbook, Hand Laborers and Material Movers
- BLS OEWS May 2023, SOC 53-7062, Nevada
- FRED, Las Vegas-Henderson-Paradise transportation and warehousing employment
- Nevada GOED, Logistics and Operations
- OSHA directive on powered industrial trucks (FY2018)
- SafetyNow summary of OSHA powered industrial truck data
- StealthAgents, Warehouse and Fulfillment Staffing Costs 2026
- National Employment Law Project, Amazon NJ Turnover Data Brief