
The short answer
Delivery robot ROI for airport terminals comes from staff time spent on supply runs between storerooms and gates, priced on the government wage data for waiters and waitresses. The savings range depends on the share of those trips a robot can take on mapped corridors, set against a fixed lease payment and service cost. A free site assessment replaces the typical inputs with measured routes and hours, so the range becomes a figure you can check.
Key takeaways
- Savings come from staff hours spent on supply runs, not from cutting the team.
- The range depends on the share of trips a robot takes on mapped routes.
- Route length and hours are measured on site, so the assessment comes first.
- Federal labor data shows a shrinking national pool and heavy churn in airport jobs.
- Fixed lease and service costs set a floor, so light use leaves little to save.
Run the numbers for your site
Pick your city or state for a real regional number - we use the real BLS wage there. (On the live site this auto-detects from your location.)
What do you want to automate?
The robot walks the repetitive trays; staff stay with guests and tables.
What is delivery robot ROI for airport terminals?
Delivery robot ROI for airport terminals is the value of staff hours that stop going to supply runs, measured against the lease payment and service cost of the robot that takes those runs over. The setting is large. The FAA's National Plan of Integrated Airport Systems counted 3,321 airports as of April 2018, and 506 of them had scheduled commercial service, according to a summary of FAA data at infrastructureusa.org. That count is dated, so treat it as a baseline and check the FAA's latest figures before planning.
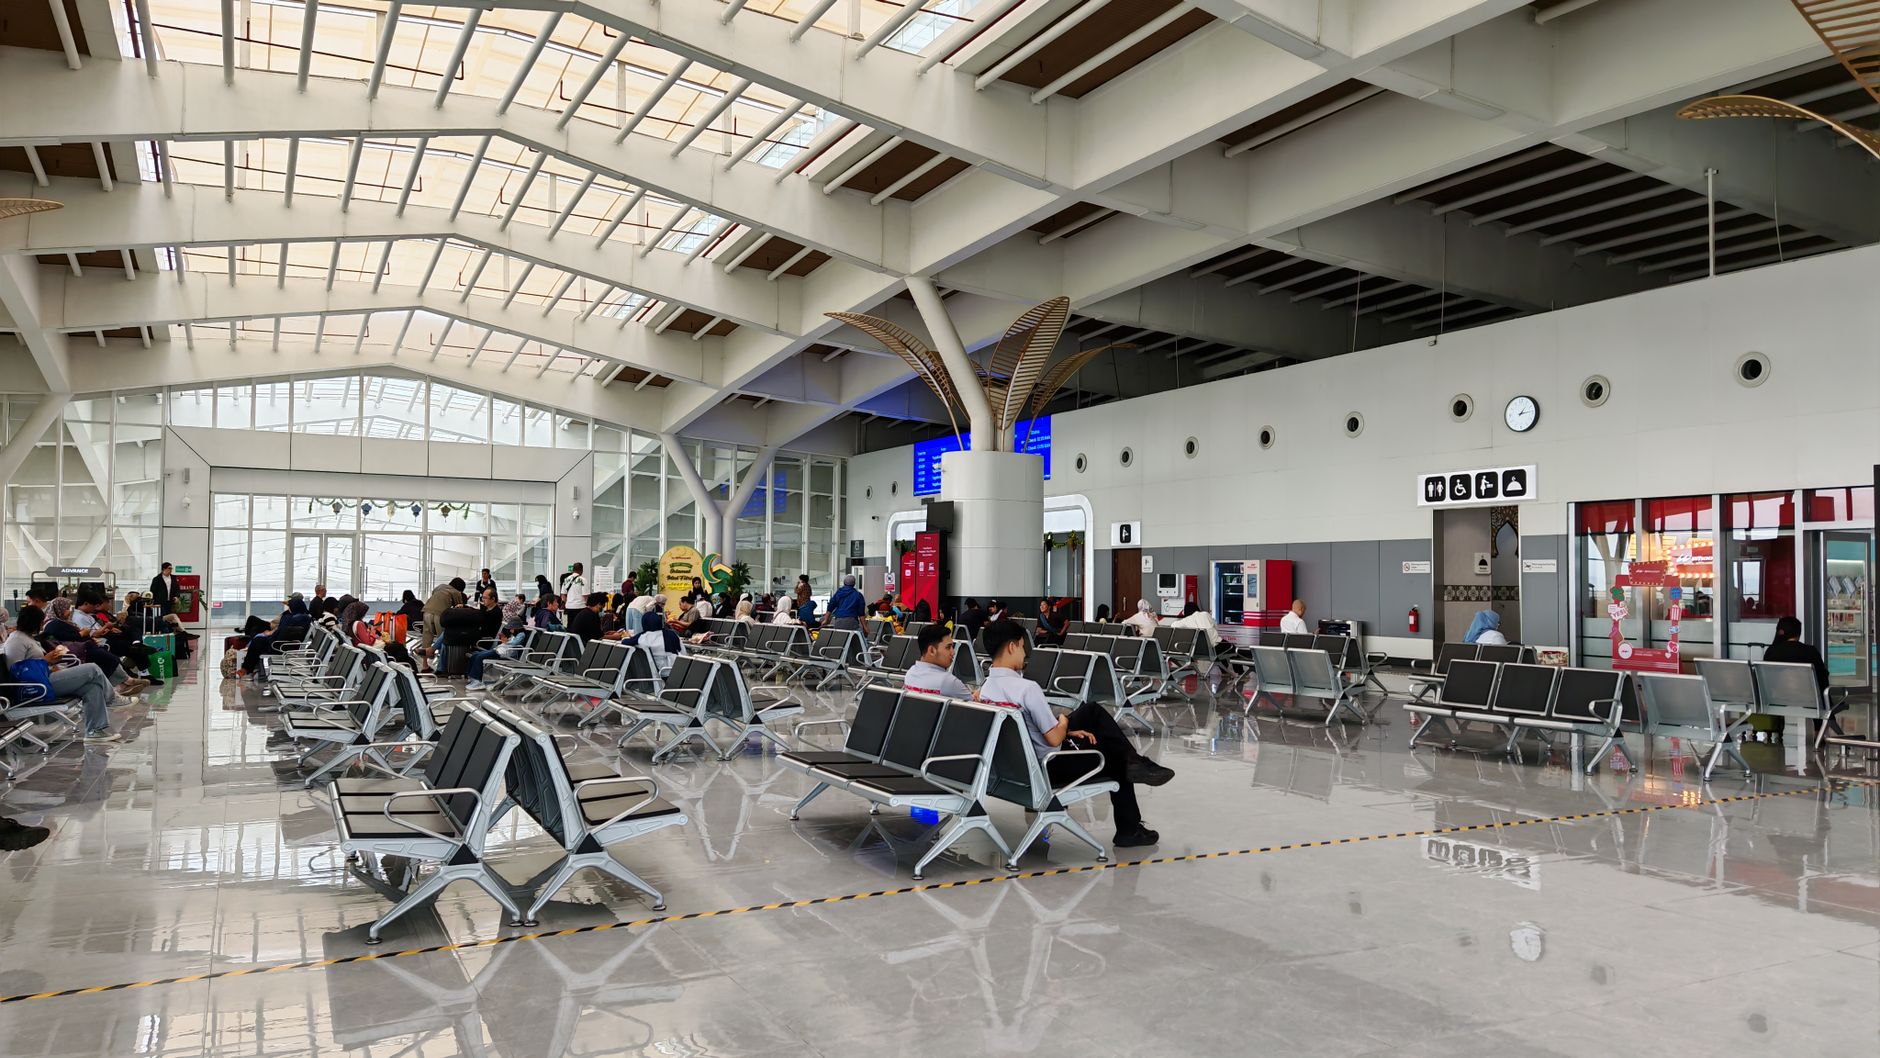
The FAA defines a commercial service airport as a public airport with more than 2,500 enplanements a year and scheduled service. Terminals at that scale have long corridors, several gate clusters and storerooms that sit a long walk from the gates. A robot is useful in that layout because the trip repeats, the route is known and the load is light. The return sits in those trips, not in the building itself.
Where does the return come from in a terminal?
The return comes from staff time that the robot takes over. A typical supply run means someone leaves a post, collects cups, linens or printed materials from a storeroom, walks to a gate or concession area, and walks back. Most of that time is walking and waiting, not handling. A robot carrying the same load on a mapped corridor removes the walk without removing the person who decides what is needed.
Printed materials and linens are good loads for this work because they are light, predictable and easy to count. Cups and other concession supplies are also light, but they need the same care about timing as any food service item. The return is largest where many short trips repeat each shift and the storeroom sits far from the gates. Expect the smallest value where a single run happens once an hour near the gate.
Median hourly wage, Waiters and Waitresses
$3,798
Monthly cost of one full-time worker, at the median wage plus payroll costs (an estimate, not a quote).
How does the ROI math work?

The calculation has four inputs. The first is the hours of supply runs staff make per shift, counted and timed at the site. The second is the share of those trips a robot can realistically take on its mapped route. The third is the hourly value of that work, priced on the government wage data on this page for waiters and waitresses, the job closest to carrying cups, linens and printed materials to gates and counters. The fourth is the fixed lease payment and service cost for the robot.
The savings range is the hours offset, multiplied by the share a robot takes and valued at that wage, minus the lease and service cost. It is shown as a range because each input can move. A robot that takes half the trips returns less than one that takes most of them, and the lease cost does not fall when the robot sits idle. No published headcount for this work at one terminal was found in this review, so the typical headcount on this page is a planning placeholder to replace with the site count.
How does a robot compare with staff on supply runs?
The comparison below is about the supply run, not about the people doing it. Staff win on judgment, flexibility and lifting. The robot wins on repeatability and on staying on a route through a shift that is short staffed.
Read the table as a way to decide which steps to hand over. The robot's advantage is largest where the route never changes. Staff keep the parts of the run that depend on what a passenger or gate agent says next.
- Repeat trips on a known route
Delivery Robot
Runs the same mapped route each time, with the same stop order
Staff
Runs the route well but drifts when a shift is busy or short staffed
- Judgment on a changed request
Delivery Robot
Follows a set task and needs staff to change it
Staff
Decides on the spot and can ask a question at the gate
- Heavy or fragile loads
Delivery Robot
Suited to light, closed loads only
Staff
Lifts, balances and handles breakable items
- Coverage across the day
Delivery Robot
Runs on a set schedule while staff are on other tasks
Staff
Covers only the hours staffed, and each new hire adds training time
- Cost behavior
Delivery Robot
Fixed lease payment and service cost, quoted after assessment
Staff
Wages and benefits that move with hours worked and turnover
- Passenger contact
Delivery Robot
Limited to a stop and a handoff point
Staff
Answers questions, directs passengers and reads the room
What do the labor figures say about staffing?
The Bureau of Labor Statistics reports that waiters and waitresses held about 2.3 million jobs in 2024, and projects employment to fall 1 percent from 2024 to 2034, according to its Occupational Outlook Handbook. A shrinking national count does not change one terminal's supply runs. It does mean the pool of experienced runners is not growing, so filling those shifts stays hard.
Airport labor turns over faster than that. The union SEIU told a Senate subcommittee in November 2025 that annual turnover was above 30 percent for privately employed airport workers, citing a 2018 Port Authority of New York and New Jersey memo. KUT reported in July 2021 that concession operators at Austin airport reported vacancy rates of 31 percent and 45 percent, with more than 14 percent of stores closed. Those are vacancy rates, not turnover.
GAO's August 2025 report on airport workers found that about 7 percent of the private-sector airport service workers it studied, across 36 selected air transportation occupations, were at or below the poverty line in American Community Survey responses from 2018 through 2022. Turnover for concession food service in 2025 was not found in this review, so the site's own records should set the turnover figure.
What changes the number up or down?
Six things move the range most, and most of them are measured in the site assessment. Each can be checked before anyone signs a lease, which is why the assessment comes first.
Route length and run frequency push the number up. Heavy loads, approval delays and frequent route changes push it down. Staff acceptance and a service plan decide whether the hours freed stay freed. The checklist below lists what to confirm before the range is treated as final.
What are the risks to the return and how do you avoid them?
The biggest risk is an overstated share. A plan that assumes the robot takes every run will miss, and the range will look better on paper than in the terminal. Build the share from the measured runs, then test it on one route before scaling. A second risk is route change. Gate reassignments and construction closures can cut a mapped route, so the plan needs a way to re-map or pause.
Market estimates can mislead too. A commercial market research summary puts the terminal category at 68.35 percent of 2025 airport robot market share. That describes where the market is spending, not what a single terminal saves. Use the site's own hours and route data to set the range, and treat market figures as context only.
What is a realistic timeline from assessment to payback?
The sequence runs from site assessment to route mapping, a measured pilot on one route, go live with the staff who work alongside the robot, and a review of the hours freed before the range is confirmed. Each step depends on the one before it. Airport authority approvals for secured areas can add time at the front, so start those early.
Payback comes after the pilot shows the hours freed on real routes, not after the first demonstration. Plan for the first stretch of operation to confirm the measured range, and expand only if the pilot holds. We deploy and integrate the robot, train the staff and service it nationwide, so the timeline covers those steps as well as the lease start.
How do I get a precise figure from a free site assessment?
Ask for a free site assessment. The team walks the storeroom to gate routes, counts supply runs per shift by type, measures distances and marks the corridors and approvals that apply. Those measurements replace the typical values in the calculator, so the savings range narrows to a figure built on your terminal.
We pick the robot that fits the floor and the loads, lease it through financing, deploy and integrate it, train the staff and service it nationwide. The lease payment comes in a quote after the site assessment, so the number reflects your route and your service terms. Bring the shift schedule, storeroom locations and a rough count of runs to the first call.
Frequently asked questions
Want a delivery robot at your airport terminal?
Tell us about your site. We will recommend the robot, quote the lease, and keep it serviced.
Sources
- US Bureau of Labor Statistics, Occupational Employment and Wage Statistics (OEWS May 2024)
- BLS Occupational Outlook Handbook, Waiters and Waitresses
- FAA National Plan of Integrated Airport Systems summary
- infrastructureusa.org summary of FAA airport counts
- SEIU written testimony to Senate Commerce subcommittee, November 2025
- KUT, Austin airport concessions staffing, July 2021
- GAO-25-107678, Aviation Workforce: Contributions and Characteristics of Selected Airport Workers
- Airport robots market report
- Airport traveler survey report