

The short answer
Delivery robot ROI in Indianapolis comes from the server hours a robot takes off the floor, weighed against a fixed robot lease payment. The result is a savings range rather than a promise, and it moves with the number of food runs the layout allows, the length of the shift and how often staff are short. A free site assessment turns those inputs into a precise range for your room.
Key takeaways
- The return comes from food running hours a robot takes over, priced on the local wage for server work.
- Savings are a range that depends on the share of runs the floor layout allows.
- Turnover in accommodation and food services keeps staffing under pressure.
- A pilot on one route tests the offset before any wider rollout.
- A free site assessment sets the figure for your room, and the lease is quoted after it.
Run the numbers for your site
Auto-detected from your location - we use the real BLS wage here. Not right? Pick your city or state above.
What do you want to automate?
The robot walks the repetitive trays; staff stay with guests and tables.
What return can a delivery robot bring to an Indianapolis restaurant?
Delivery robot ROI in Indianapolis is a question about hours. A delivery robot does not replace a restaurant team. It takes over the repeat trips a server makes between the kitchen pass and the dining room, and the return is the value of those hours less the cost of the lease.
The metro is large, with 2,174,833 people on July 1, 2024, according to the Census Bureau estimate as reproduced by citypopulation.de, up from 2,089,669 at the 2020 Census. Population growth does not prove a labor shortage on its own, so the site's own shift records matter more than the metro figure.
Service Robot Co. is a US commercial robot integrator. We pick the robot that fits the site, lease it through financing, deploy and integrate it, train the staff and service it nationwide. The return on this page is only as good as the site data behind it, which is why the work starts with an assessment.
How many restaurants could use this?
The National Restaurant Association's 2025 State of the Industry Pocket Guide reports 1M+ locations for the restaurant and foodservice industry, along with 15.9 million employees, which it describes as the nation's second-largest private-sector employer. The cover does not say whether that location count covers restaurants alone, so treat it as the whole foodservice base rather than a restaurant count.
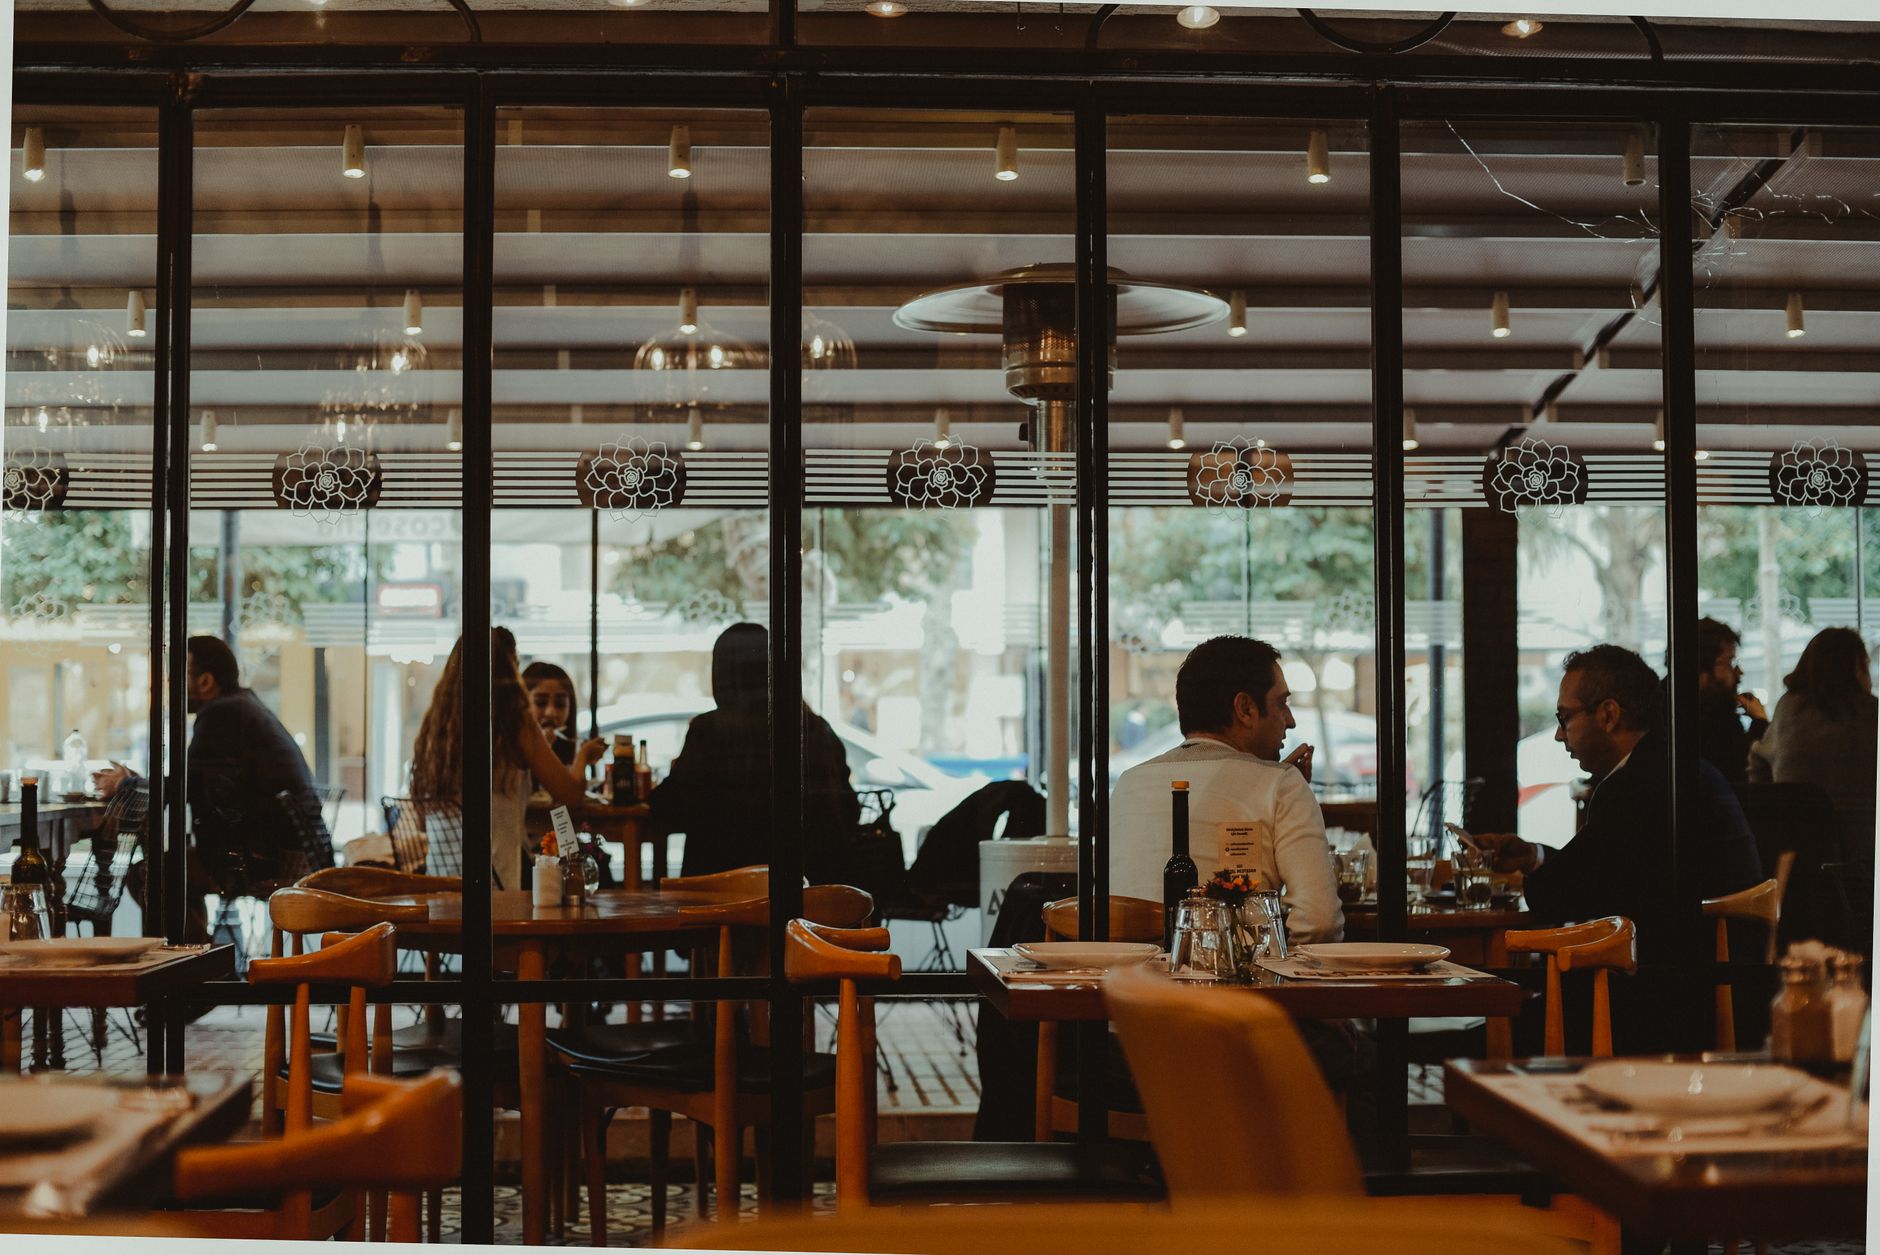
Full-service restaurants are where a food runner helps most, because the server's shift is built around moving between the pass and the tables. IBISWorld puts the average single-location full-service restaurant at about 91.9 workers across all roles, so server hours are one part of a room's payroll. Counter-service and bar-led sites run the floor differently, which is why the floor plan matters more than the national count.
Median hourly wage, Waiters and Waitresses
$3,171
Monthly cost of one full-time worker in Indianapolis, IN, at the median wage plus payroll costs (an estimate, not a quote).
Where does the labor offset come from?
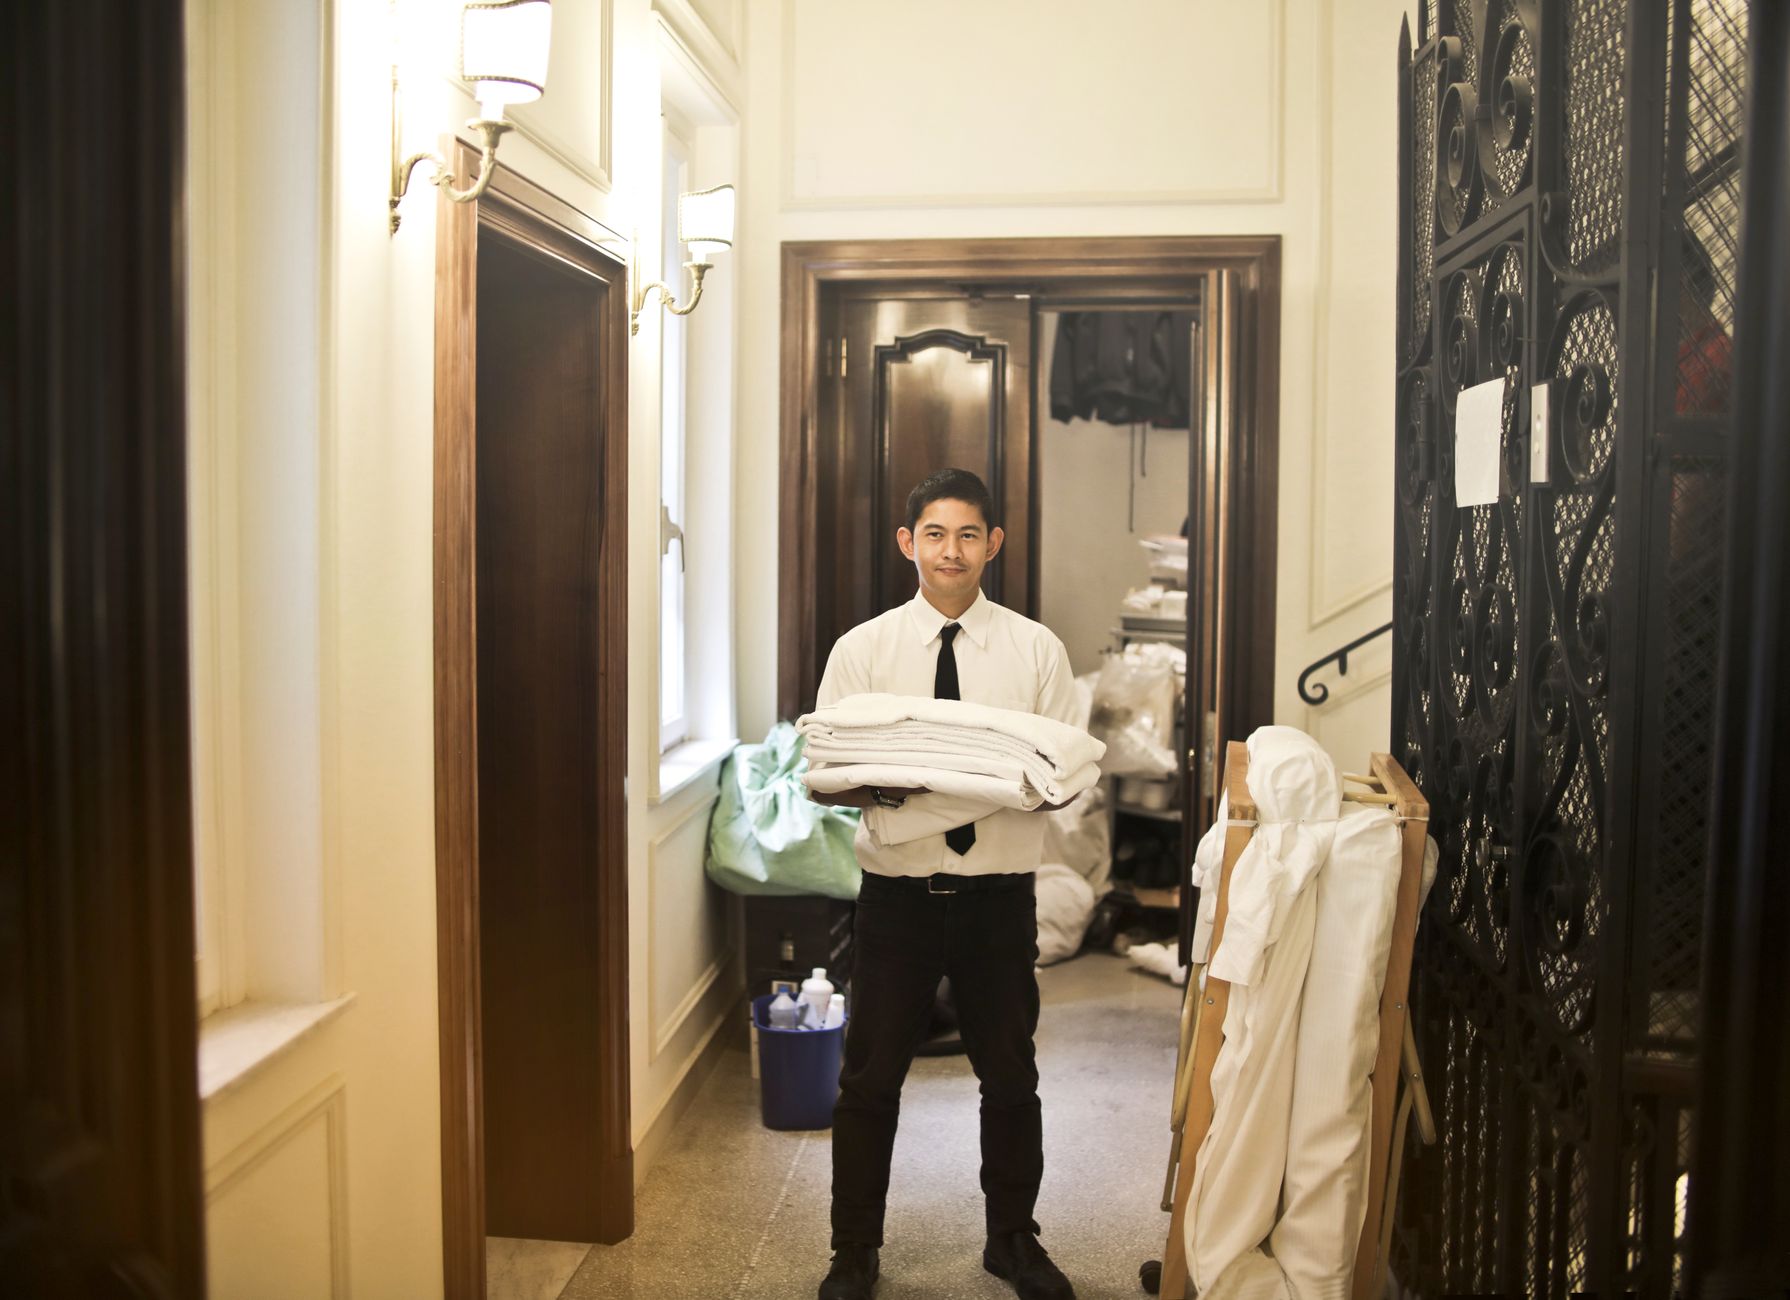
The labor side of the math is the hours of waiter and waitress type work that the robot takes over. The government wage data on this page gives the local wage for this job in Indianapolis, and the savings range is priced on that wage. Nothing here is priced on the time of cooks, hosts or managers.
Staffing guidance for full-service floors is thin, and most of what exists comes from vendors. Eposnow, a POS vendor, gives a planning guideline of one server per four to five tables in full-service restaurants, and one per three tables in fine dining. That is a planning guideline, not a measured average, but it shows how server hours scale with the tables a room covers.
The offset is the share of those hours a robot can realistically take. Food running is a bounded task: pick up at the pass, travel a known route, deliver and return. Table conversation, recommendations, allergy questions, drink service and recovery from errors stay with people.
How does the savings math work?
The calculator on this page takes three inputs: the hours of server work the robot takes over, the local wage for that work, and the lease cost. Hours drive the result most. A robot that takes a real share of runs across a long shift removes more paid time than one that makes a few trips at the slow end of service.
The realistic share matters more than the ceiling. A robot does not run every dish. The share depends on route length, distance from pass to tables, the number of runs in a shift, and how often a person has to step in to fix a delivery. The calculator asks for these and returns a range, not a single figure.
Lease cost is the other side of the ledger. The lease is a fixed robot lease payment through financing, quoted after the site assessment. The savings range is the labor hours offset, less that payment, less the staff time spent on training and exceptions. A range is the right output because the share stays an estimate until the robot has run on your floor.
What changes the number up or down?
Shift length and sales volume set how many runs exist to take over. A busy dinner service has far more repeat trips than a quiet afternoon, and the same robot on the same route produces a larger offset in the busy shift. Sites with uneven demand should model the peak shift and the slow shift separately.
Layout is the next driver. A mapped route with a short distance from pass to tables, clear aisles and a reliable path between floors or rooms gives the robot more runs per hour. Crowded corridors, frequent layout changes and obstructions cut the usable share, and so does a route that needs many manual handoffs.
Turnover changes what the offset is worth. A site that loses servers often pays for recruiting, training and open shifts, and a robot does not remove those costs. It does reduce the number of shifts that depend on one person covering the runs. The number moves most at sites that already run short-staffed.
How much turnover is there in this industry?
Turnover is the pressure that makes the offset worth measuring. According to FRED, the BLS JOLTS-based total separations rate for accommodation and food services was 5.4 in February 2026, down from 6.1 in January 2026. Separations include quits, layoffs and other exits, so the rate describes churn across the sector, not at any single site.
The quits rate is the clearer signal of people leaving by choice. BLS Economics Daily reports a quits rate of 3.5 percent in accommodation and food services for August 2026. The job openings rate was 6.4 in August 2025, according to FRED, a sign that the sector keeps advertising for staff.
The base of the work is large. The BLS Occupational Outlook Handbook reports 2,329,700 US jobs for waiters and waitresses in 2024, a projected 1 percent decline from 2024 to 2034, and about 456,700 openings per year on average over the decade. A slow decline in jobs still leaves a steady flow of openings to fill.
What are the risks to the return?
The first risk is overstating the offset. Assuming a robot takes every food run from the first day produces a number the floor cannot deliver. Start with the share the route allows, measure it in the first weeks, and widen the scope only when the data supports it.
The second risk is a robot that stops. A robot out of service returns its work to staff, and a site that cut server coverage on that assumption feels the gap at peak. Plan for it with a backup unit, remote triage for faults and on-site dispatch when a repair needs hands. Service Robot Co. services units nationwide, and the service terms belong in the quote.
The third risk is guest friction and kitchen workflow. Guests who expect a person at the table, and kitchens without a loading routine, both cut the number of useful runs. Train the staff on the handoff, and set clear rules for who loads and who clears.
The fourth risk is the lease itself. Compare the fixed payment against the savings range only after the assessment gives a realistic share, and read what the lease covers, including service and insurance terms.
- Repeat food runs
Delivery Robot
Follows a mapped route the same way on each trip
Staff
Adjusts to a crowded room and changes the route on the spot
- Table conversation
Delivery Robot
Works from programmed messages, not open conversation
Staff
Reads the guest, answers menu questions and makes recommendations
- Special requests and allergies
Delivery Robot
Carries the tray and nothing more
Staff
Confirms details with the kitchen and the guest
- Peak service surge
Delivery Robot
Capacity is fixed by the number of units on site
Staff
Can pick up extra tables or cover a shift on short notice
- Error recovery
Delivery Robot
A staff member has to fix a wrong or missing delivery
Staff
Fixes the problem at the table during the same visit
What is the timeline from assessment to payback?
The timeline runs in stages: a site assessment, a mapping visit, a quote, a pilot on one route, then a phased rollout. Each stage gives a better read on the hours share. Payback depends on the lease terms, the offset the pilot proves and how quickly staff adopt the handoff routine.
The assessment covers the floor plan, pass to table distances, covers by daypart and current server hours. Mapping shows whether the robot can take the route cleanly. A quote follows, based on the lease terms and the assessment data. This research did not verify a payback duration for this setting, so this page does not publish one.
A pilot is the honest test. Running one route lets the site measure actual runs, exception time and any effect on turnover before committing to more units. Go live support covers the first days of service, and staff training should be complete before the robot takes live orders.
How do I get a precise figure from a free site assessment?
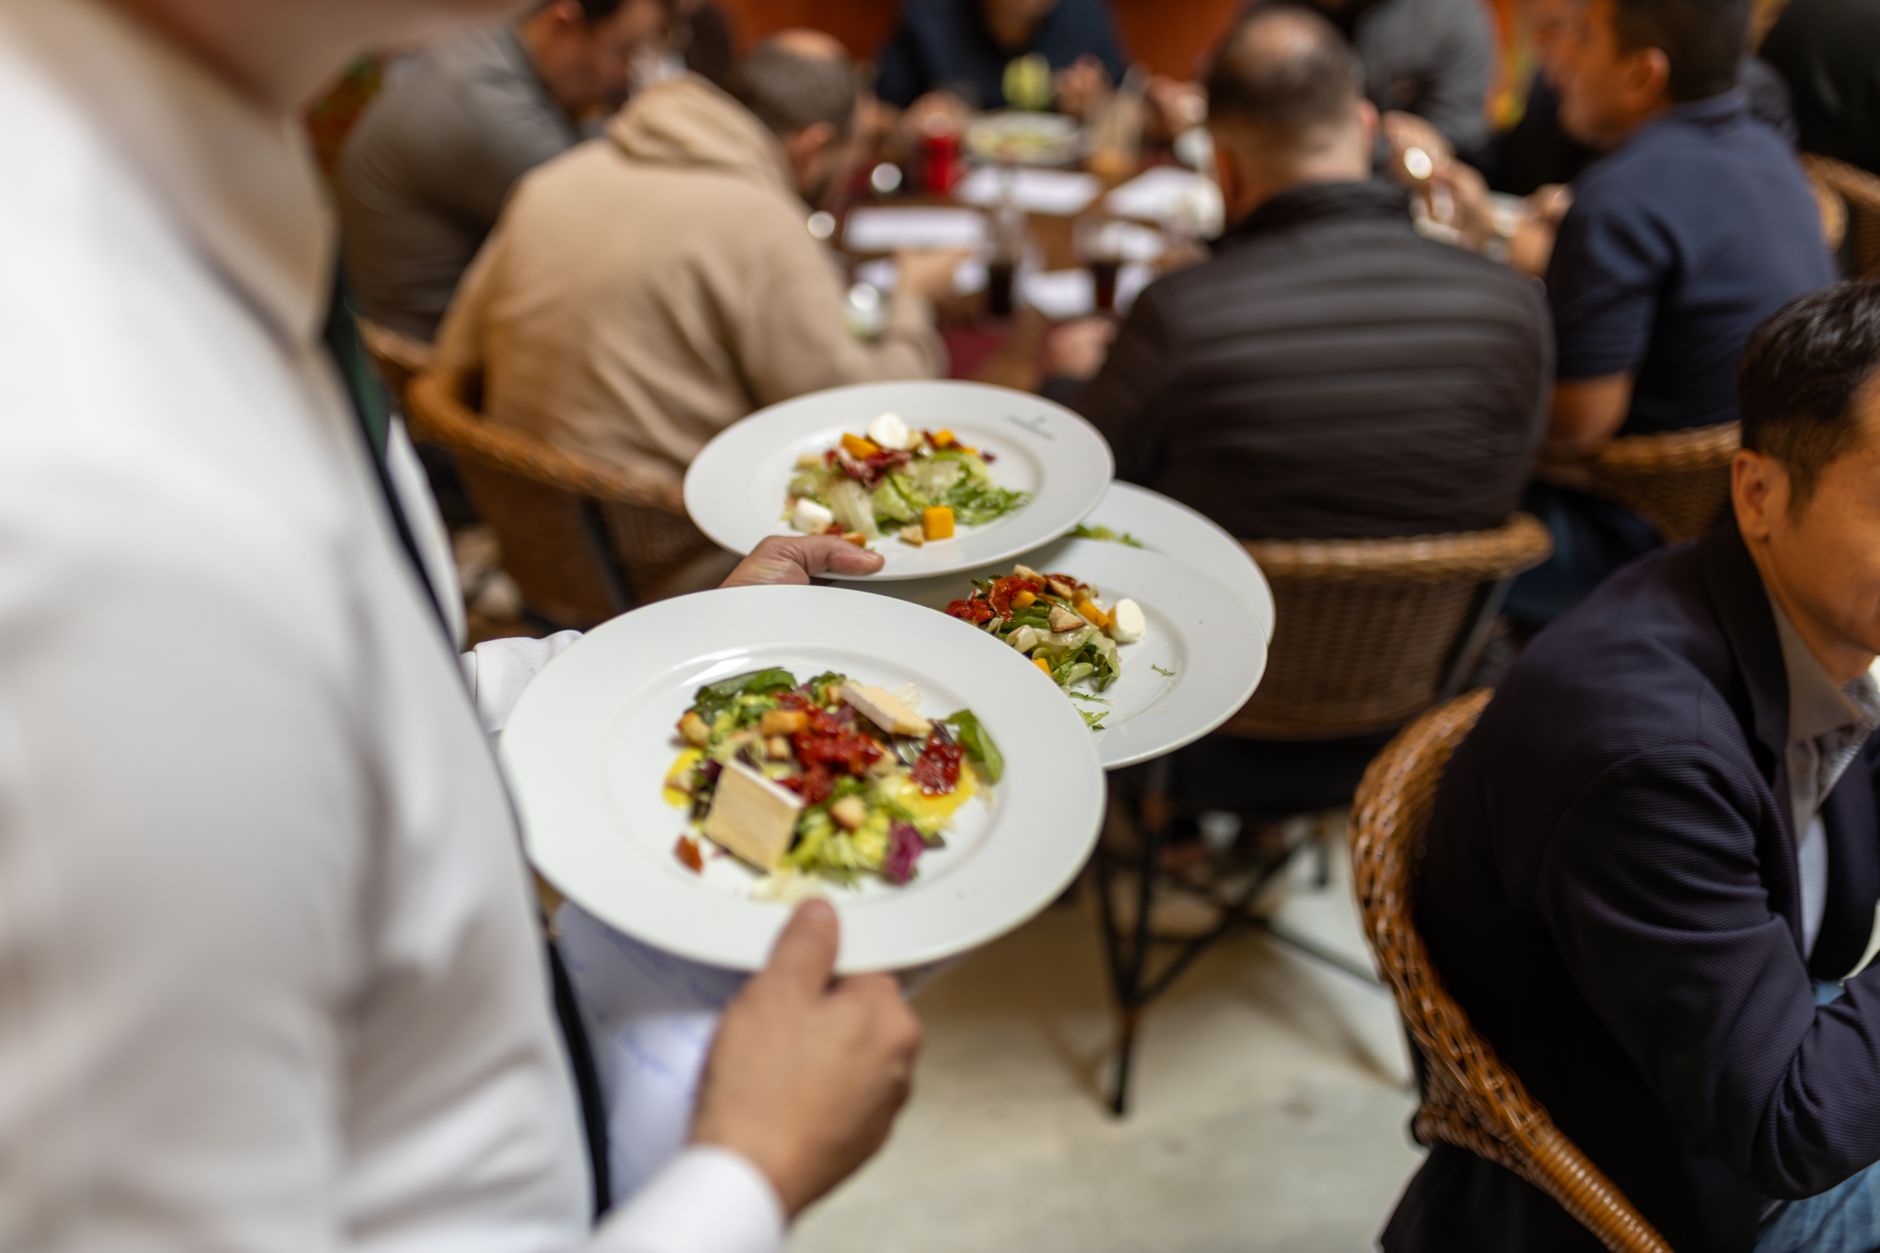
A precise figure comes from a free site assessment, not from a national average. Service Robot Co. measures your floor, your covers and your current server hours, then maps the route the robot would take. The savings range comes from those inputs and the local wage data on this page.
After the assessment, the lease is quoted as a fixed robot lease payment through financing. The quote sets out the lease terms, service coverage and deployment scope, so the range and the payment can be compared on the same basis. Nothing is quoted before the site data is in.
Bring three items to the assessment: your shift schedule, your server count per shift and your table layout. Those answer most of the questions the calculator asks, and they shorten the path to a range you can take into a financing decision.
Frequently asked questions
Put a robot to work in Indianapolis.
We walk your site, learn the job, and recommend the unit that fits. Then we quote the lease, deploy it, and keep it serviced.
Sources
- US Bureau of Labor Statistics, Occupational Employment and Wage Statistics (OEWS May 2024)
- Census Bureau estimate as reproduced by citypopulation.de, Indianapolis-Carmel-Greenwood metro
- U.S. Bureau of Labor Statistics, Occupational Outlook Handbook: Waiters and Waitresses
- FRED, Total Separations Rate, Accommodation and Food Services (BLS JOLTS-based series)
- BLS Economics Daily, Quits Rate in Accommodation and Food Services, August 2026
- FRED, Job Openings Rate, Accommodation and Food Services
- National Restaurant Association, 2025 State of the Industry Pocket Guide
- Eposnow, How Many Members of Staff Do I Need in My Restaurant
- IBISWorld, Single-Location Full-Service Restaurants in the US, Employment