

The short answer
The delivery robot ROI in Knoxville comes mainly from the hours servers spend carrying food and drinks between the kitchen pass and the tables, plus shifts that go unfilled. Your return is a savings range built from the share of that work a robot realistically takes, the government wage data for this job, and a fixed robot lease payment quoted after a free site assessment. Treat the calculator range as an estimate until timed walks on your own floor confirm the hours.
Key takeaways
- Most of the return comes from running food and bussing hours, not from cutting a position.
- The savings figure is a range built from hours measured on your floor and the local wage for this job.
- Turnover and unfilled shifts widen the case more than the wage line does.
- Payback turns on how much running work the robot takes, which only a site walk can confirm.
- The lease payment is quoted after a free site assessment, and the range on this page is not a promise.
Run the numbers for your site
Auto-detected from your location - we use the real BLS wage here. Not right? Pick your city or state above.
What do you want to automate?
The robot walks the repetitive trays; staff stay with guests and tables.
What return can a delivery robot ROI in Knoxville really deliver?
In a Knoxville restaurant, a delivery robot does one job well. It carries plates, drinks and bus tubs between the kitchen and the dining room, so servers spend more of their shift at tables. The return is the value of those carrying hours, set against the lease. It is not a headcount cut, and a sound estimate treats it that way.
Most food service operators are small. According to the National Restaurant Association 2025 State of the Industry pocket guide, the US has more than one million restaurant locations (listed as 1M+), employs 15.9 million people, and more than 7 in 10 restaurants are single-unit operations. A single-unit room has no central team to absorb a labor gap, so the running work lands on the people on the floor. Technomic data cited by 10 Minutes News put chain restaurant locations at about 691,181 in 2024, though that count covers chains only.
The savings range on this page is an estimate, not a promise. It is priced on the hours of waiter and waitress type work the robot takes over, and it moves with how busy the room is, how far the kitchen sits from the tables, and how many floors or patios the robot must cover.
Where does the return come from in a food service room?
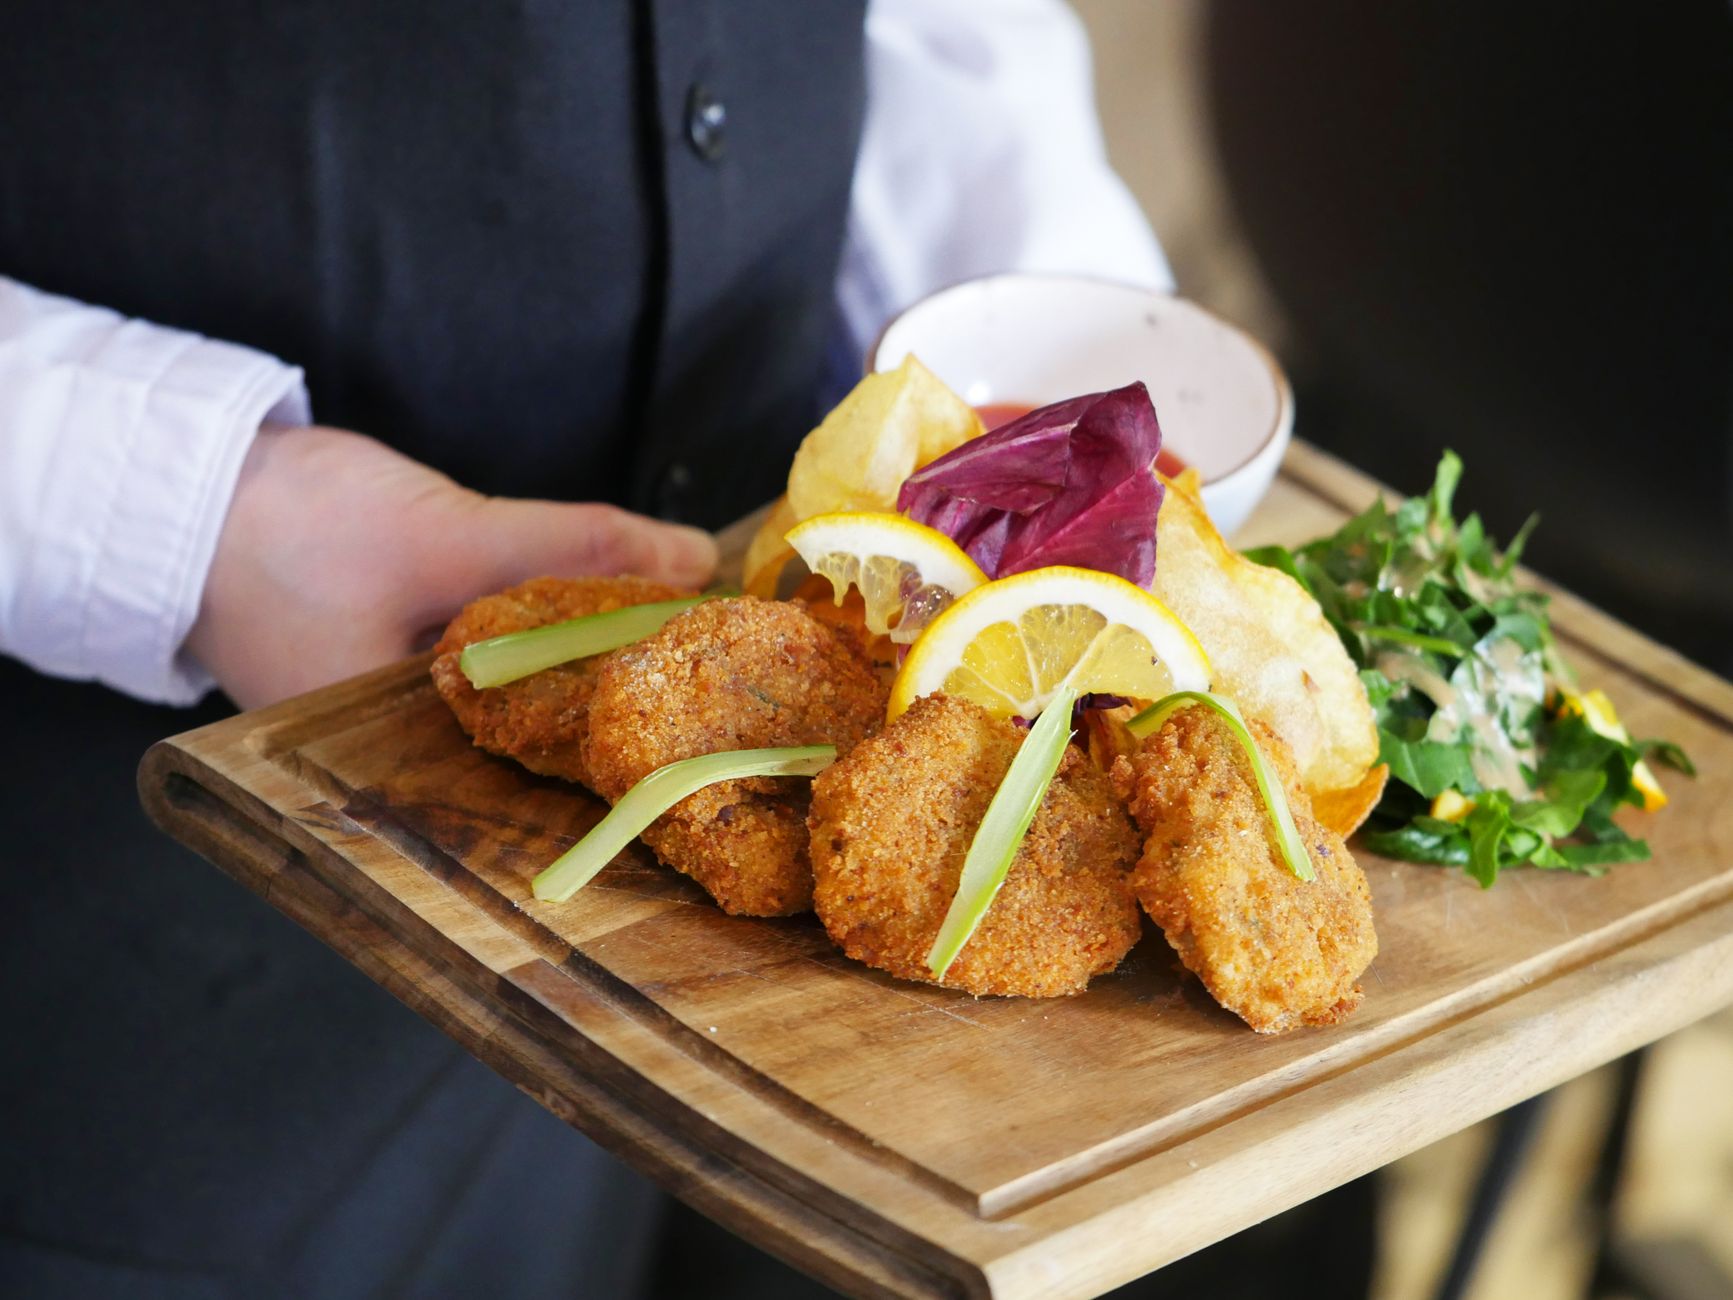
Food running is steady, repetitive work. A server makes many laps between the pass and the tables, and the busiest laps fall in peak hours, when attention to guests matters most. A delivery robot takes the repeat legs: kitchen to table, table to bussing station, and back. The server keeps the order, the conversation and the check.
The second source is staffing. Restaurant labor is hard to hold, and each unfilled shift pushes running work onto whoever is left. The robot does not replace a person in that case. It covers work that would otherwise go undone or slow service for every table in the room.
The third source is training time. Every replacement hire needs time to learn the floor before running food well. Fewer hires means fewer hours spent teaching routes, a cost that rarely appears on the labor line but is real on the schedule.
Median hourly wage, Waiters and Waitresses
$3,161
Monthly cost of one full-time worker in Knoxville, TN, at the median wage plus payroll costs (an estimate, not a quote).
How does the ROI math work for a delivery robot?
Start with three inputs. The first is the hours per week that running food and bussing takes in your room, timed on the floor rather than estimated from memory. The second is the share of those hours a robot can realistically take, which is less than all of them, because fragile orders, special requests and crowded aisles still need a person. The third is the lease cost, a fixed robot lease payment quoted after a site assessment.
The savings range is roughly the hours the robot takes over, valued at the local wage for this job shown in the panel beside this text, less the lease payment and any added time for supervision and restocking the robot. The range widens or narrows with the two uncertain inputs, the robot's share of the work and the measured hours. Ask for the low and high ends, not one number.
Payback follows from the savings range and the lease term. A longer lease term spreads the payment over more months, which changes when the cumulative return passes the cumulative cost. Compare the range against the quote over the same term.
| Task | Today | With a robot |
|---|---|---|
| Carry food from the kitchen pass to dining tables | Several laps per peak hour, timed on your floor | Robot takes the repeat legs; server finishes the drop-off |
| Return bus tubs and used plates to the wash station | Frequent trips during service, often left to whoever is free | Robot runs a scheduled bussing route |
| Bring drinks, condiments and restocks to the floor | Short trips that interrupt table service | Robot delivers stocked items from the service station |
| Take orders, check on guests and close checks | Core server work and the part guests remember | Stays with the server |
| Cover shifts that go unfilled | Running work shifts to remaining staff during gaps | Robot holds the running load while the position stays open |
Hour figures are not published for this setting, so none appear here. The site assessment times each task on your floor and sets the hours the robot takes over.
What do the national figures say about staffing pressure?
According to the BLS Occupational Outlook Handbook, about 2,329,700 people held waiter and waitress jobs in the US in 2024, and employment for the job is projected to decline 1% from 2024 to 2034. These are national figures and do not separate Knoxville. They do show that the labor pool for this work is not expanding.
Turnover adds pressure. According to FRED series JTS7200TSR, seasonally adjusted total separations in accommodation and food services were 6.1% in January 2026 and 5.4% in February 2026. A BLS Economics Daily article reports the industry quits rate at 3.5% in August 2026, down from 3.9% in August 2025. Lower quits can ease hiring, but high separations still mean new people learning the floor.
For a local decision, these national numbers are a context check, not the input. Your own schedule, your own vacancies and your own turnover belong in the assessment.
What changes the return up or down?
The biggest swing factor is the room itself. A compact dining room with a short kitchen-to-table path gives the robot short, frequent routes and high use. A large room, a split level or a patio that sits far from the pass adds distance and idle time. Peak hours matter too, because the robot's value concentrates when the room is full. A restaurant that is quiet at lunch and slammed at dinner earns its return in a narrower window.
Safety belongs in the case, measured carefully. According to the BLS chart for nonfatal injuries and illnesses, accommodation and food services had about 234,800 cases in 2024, with a rate of 2.6. The rate's basis is stated on that BLS page, so confirm it before you quote it. Hand-carried trays are one exposure among several, and your own incident log is the right place to measure how much of it applies to your room.
Staffing gaps push the number up. A room that runs fully staffed sees a smaller gain than one that regularly loses shifts. A complex menu pushes it down, since many custom plates and hot items stay with people.
Which work can a robot take, and which stays with people?
A delivery robot takes movement: repeat runs between fixed points on a mapped route. It does not take judgment. It cannot read a table's mood, recommend a dish, handle a spilled drink, or split a check. It also cannot tell that a guest needs an extra napkin or that a party needs a different server.
The practical plan is to hand the robot the legs and keep the human parts with staff. Servers become faster at the table, not fewer at the table. That is the honest return: more time for service where guests notice it, and less time walking the same route.
Expect staff habits to change. Servers learn to load the robot, clear its path and call for help when it stops, and that routine is part of the deployment. A deployment that skips this step tends to see the robot sit idle while servers run food by hand.
- Repeat runs between kitchen and tables
Delivery Robot
Follows a mapped route the same way all shift and does not tire
Staff
Can carry several dishes at once and adjust to a crowded floor
- Special or fragile orders
Delivery Robot
Limited to the loads and trays it is set up to carry
Staff
Handles custom plates, hot items and spills
- Hours covered
Delivery Robot
Runs the route during set service hours
Staff
Covers breaks, shift changes and unexpected needs
- Guest interaction
Delivery Robot
Minimal; signals arrival at the table
Staff
Greets, recommends, answers questions and resolves problems
- Blocked path or fault
Delivery Robot
Pauses and alerts staff; service team dispatches for repair
Staff
Solves the problem on the spot anywhere in the room
- Layout changes
Delivery Robot
Needs re-mapping during deployment
Staff
Adapts as soon as the room changes
What are the risks to the return, and how do you avoid them?

The main risk is over-counting. If the estimate assumes the robot takes all running work, the savings range will look better than the room can deliver. Avoid it by timing the hours on your floor and using the lower end as the planning case. The second risk is a layout that changes after launch, such as a new bar or moved tables, which can break a route. Plan for re-mapping as part of the deployment.
Downtime is the third risk. A robot out of service during peak hours erases the return for that shift. Lease terms should cover maintenance and on-site repair, and the deployment plan should say how service continues when a unit is down, such as a spare unit or a manual fallback.
Our lease options include maintenance and on-site dispatch, and a pilot with one leased unit tests the assumptions before any wider rollout. The pilot produces measured hours for your room, which is better evidence than any national average.
How long does it take from assessment to payback?
The path runs in stages. The site assessment comes first, with timed walks, route mapping and a review of your staffing and peak hours. A lease quote follows, based on the scope of the deployment and the lease terms. Then comes deployment and integration, staff training and go live support.
Ramp-up is where early months return less than the steady state. The first weeks include route tuning, staff adjustment and checks on how the robot handles your busiest windows. Expect the early savings range to sit below the midpoint until routines settle.
The payback date depends on the savings range and the lease length. Ask for a month-by-month view that starts at go live, not one that starts on the day the lease is signed. A view that starts at signing hides the ramp and overstates the early return.
How do I get a precise figure from a free site assessment?
Ask for a free site assessment. We walk the room with you, time the running work during a real service, map the kitchen-to-table routes, and note peak hours and any unfilled shifts. Those measurements replace the planning assumptions on this page with numbers from your floor.
The lease payment is quoted after that assessment, so the figure reflects the actual route, the deployment scope and the lease terms. Bring your staffing schedule, your sales by hour if you track them, and any incident log. A precise figure needs those inputs. Without them, the range on this page stays a range.
Once you have the quote, compare it with the savings range over the same lease term, starting with the low end. If the low end still pays back within the term you want, the case is sound. If it does not, the room needs a different route, a smaller scope or a later start.
Frequently asked questions
Put a robot to work in Knoxville.
We walk your site, learn the job, and recommend the unit that fits. Then we quote the lease, deploy it, and keep it serviced.
Sources
- US Bureau of Labor Statistics, Occupational Employment and Wage Statistics (OEWS May 2024)
- BLS Occupational Outlook Handbook, Waiters and Waitresses
- FRED series JTS7200TSR, accommodation and food services total separations
- BLS Economics Daily, quits rate in accommodation and food services, August 2026
- BLS charts, nonfatal injuries and illnesses by industry
- National Restaurant Association 2025 State of the Industry pocket guide
- 10 Minutes News, Technomic restaurant data