
The question, in the buyer's words
I manage a 400-acre walnut orchard near Chico, California and we only find dead or declining trees after harvest; could drones fly the rows in spring and flag trees losing canopy to root rot or wind damage before the season is lost?
Key takeaways
- A spring drone pass can flag canopy decline early, but it cannot name root rot from the air.
- Phytophthora, overwatering, and wind damage can look alike from above, so plan ground checks on every cluster.
- Flagged trees clustered along a low row point toward drainage, while scattered trees point elsewhere.
- Spraying from a drone needs separate authority beyond a standard imaging flight, so confirm the rules first.
- Test the idea on your own rows through a free site assessment before committing to a lease.
Can a spring drone flight over a Chico walnut orchard flag tree decline?
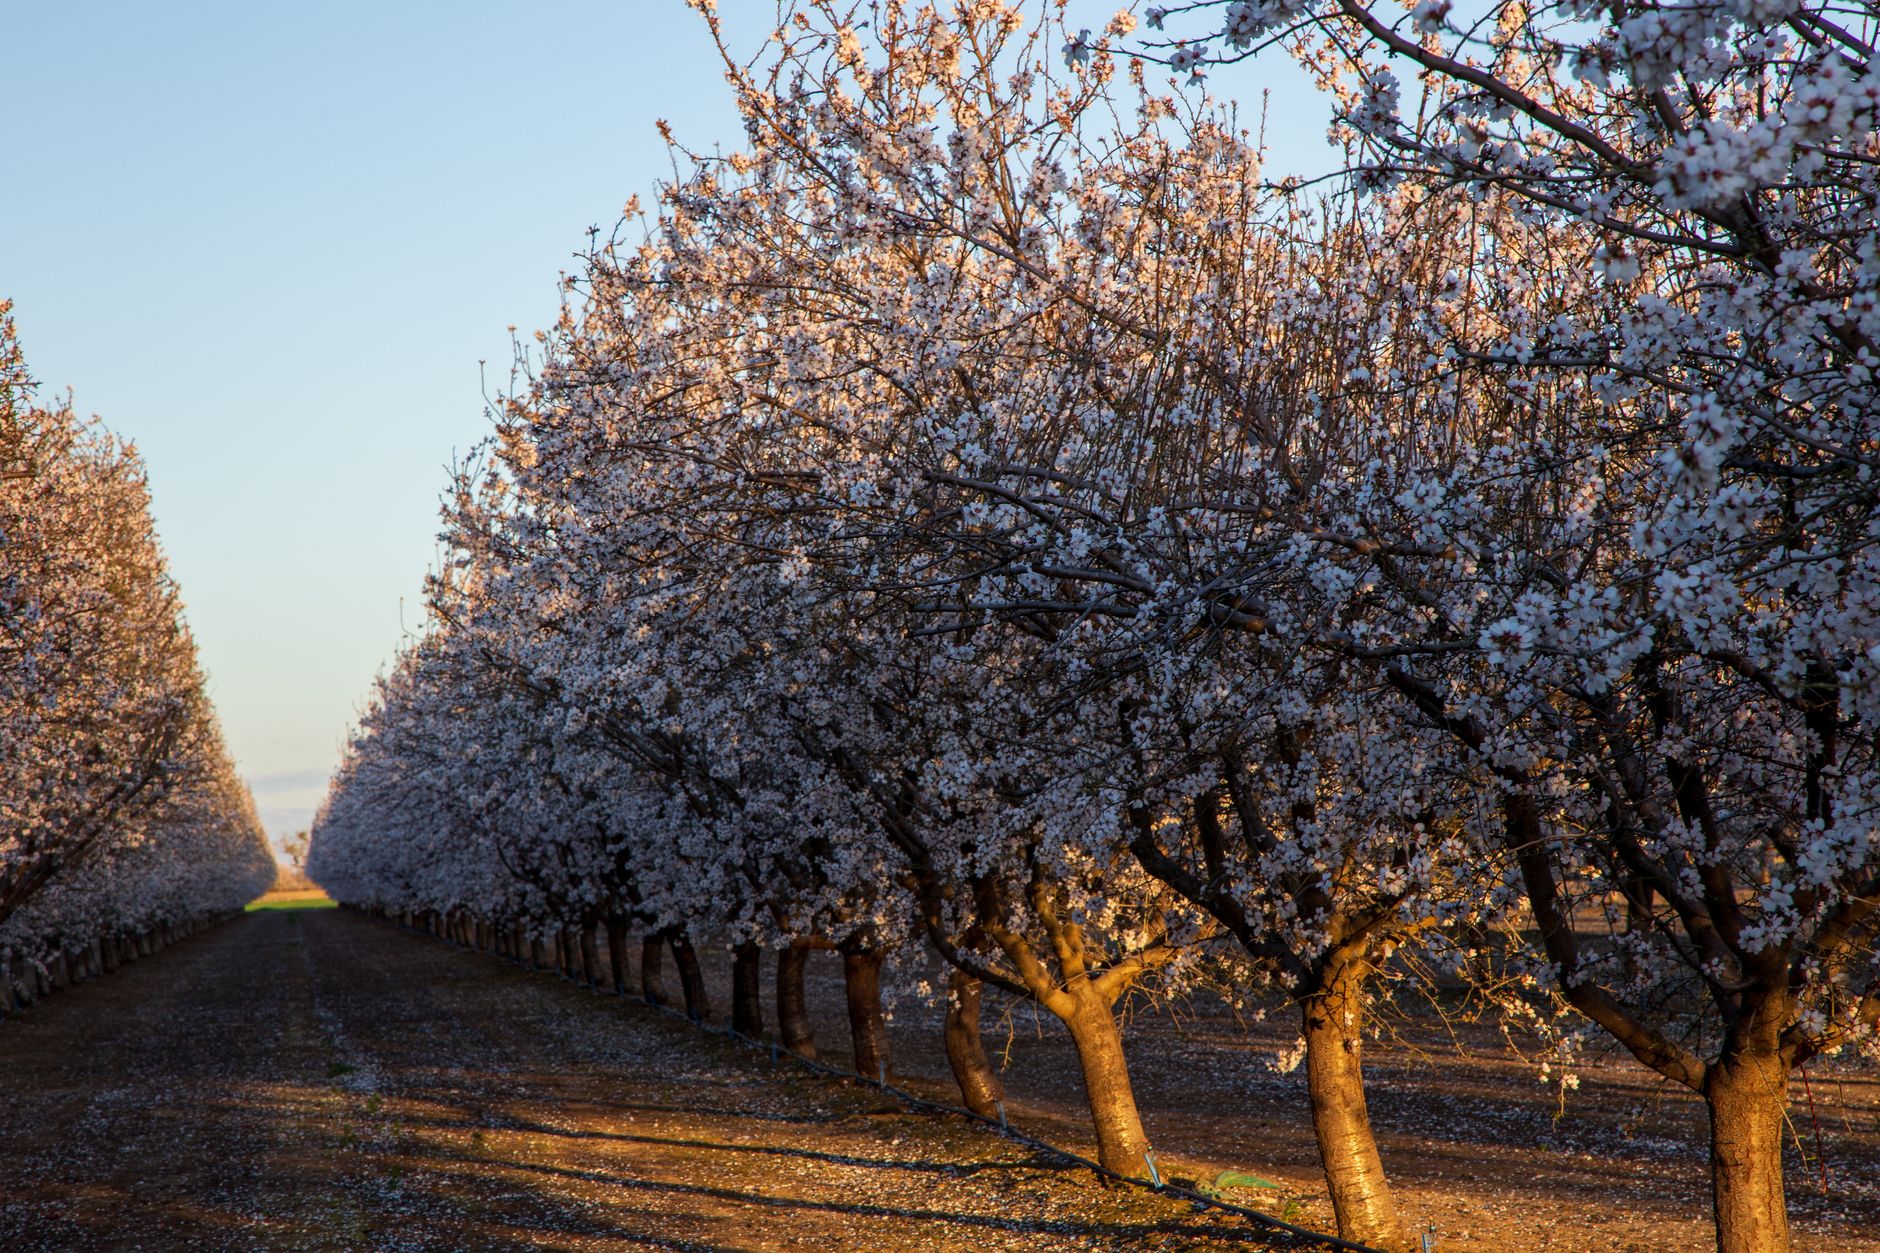
Yes, within limits. A drone flying the rows of a Chico walnut orchard in spring can show where the canopy is thinning, yellowing, or going bare, and that is the earliest visible sign of decline most growers get. The value is timing. A map of suspect trees in April or May gives you a chance to walk them, check irrigation, and sample roots while the season is still open, instead of sorting dead trees after harvest.
The limit is what the camera sees. A drone reads the canopy, not the roots. A tree that looks sparse from above may have Phytophthora crown rot, a waterlogged root zone, a girdled trunk, or roots loosened by wind, and the picture alone rarely says which. Treat the flights as a screen that tells you where to walk, not as a diagnosis.
For a 400-acre block, the screen is the part worth paying attention to. Walking every row each week is rarely realistic for a crew that is also pruning, irrigating, and managing pests, while a few flights can cover the whole block. The rest of this page covers what the research supports, what it leaves open, and what has to be in place on the ground.
Why does walnut decline in Butte County get missed until after harvest?
Walnuts are a large stake in Butte County. According to the Gridley Herald's report of county crop rankings, walnuts were the top crop by value in 2024, ahead of almonds and rice. Volume also moves a lot from year to year. The California Walnut Board's December 2025 inventory report lists Butte County production at 119,401 tons in 2023, 95,603 tons in 2024, and 122,489 tons in 2025, all types. A weak year can look like weather, so a patch of decline is easy to misread until the count comes in.
The 2026 outlook is tighter. The USDA forecast, reported by FreshPlaza, puts California's 2026 walnut harvest at 680,000 short tons, down 16% from 809,000 short tons in 2025. When the crop shrinks, each dead tree and each patch of thin canopy costs more, and catching it in spring becomes worth more.
Local weather explains why decline hides. A Chico climate page on doc.surf describes a Mediterranean pattern of hot, dry summers and cool, wet winters, with a typical July high of 94°F, a January low of 35°F, and about 27 inches of annual rain. Weatherspark's Chico Municipal Airport averages show February as the wettest month, at about 6.2 inches, and July as the driest, at about 0.1 inches. Most of the water arrives in winter, so a soggy winter on heavy soil can damage roots that only show up as thin canopy later in the season.
Drainage is the usual suspect. UC Tehama County material ties Phytophthora problems to heavy soils, poor drainage, low spots, standing water, and irrigation that wets the trunk or crown. It suggests avoiding saturation longer than about 24 hours. A drone can show whether decline sits in a low spot, which is a useful pattern, but only if you have a drainage map to compare it against.
What can spring drone imaging actually detect in walnut canopies?
Research on drones and tree health is real, but the walnut-specific evidence is thin. A 2024 study on avocado used drone and satellite data to assess root rot severity from canopy condition, based on how the canopy deteriorated as trees succumbed. A conference paper on oak reported that drone multispectral and thermal imagery detected Phytophthora-linked decline with up to 83% overall classification accuracy, a kappa of 0.46. Those are other crops and settings, so they show the method is worth testing on your trees, not that it will work on yours.
A 2026 conference abstract on walnut orchards describes a multi-sensor drone framework for individual tree health and compares multispectral survey altitudes and their effect on disease identification accuracy. The abstract does not confirm that it targets Phytophthora. I did not find a published walnut study showing that drone imagery alone identifies Phytophthora in a California orchard, so the honest reading is that canopy flags are a useful screen with accuracy still to be checked on your block.
What the drone captures well is change over time. Comparing this spring's canopy map with last spring's can show a tree or row that thinned, browned, or lost leaf area. Repeat flights after a storm or a wet spell can reveal new loss. What it captures poorly is cause. It cannot see the crown base, the trunk, or the roots under the canopy, and a tree can look acceptable from above for a while after its roots begin to fail.
Timing still matters. Canopy-only flags catch decline after the tree already shows damage, but that is still earlier than harvest. The gain only pays off if someone acts on the flags within the same season.
How do you tell root rot from overwatering or wind damage?
The symptoms overlap, so a flag should start a question, not end one. A UC farm advisor and specialist in Tulare County attributed some decline to overwatering, found pathogens rarely in the roots of those trees, and noted that the symptoms can resemble Phytophthora root rot. A flagged tree can therefore be a drainage problem, an irrigation problem, or a disease problem, and the drone cannot separate those three by itself.
Wind is a separate pattern. A UC ANR-linked report describes Ganoderma adspersum white rot of roots and butts, which causes trees to blow over, especially after windy and rainy storms. A drone can help by showing a lean, a gap, or a fallen row after a storm, and by dating the damage when you fly before and after the weather.
Spatial pattern is the cheapest clue you have. Flagged trees clustered in a low row, near a standing water line, or along one irrigation run point toward drainage or water delivery. Scattered trees with no shared low ground point toward slower disease or individual injuries. Wind losses should line up with storm dates and with the exposed edges of the block, and your own records can confirm that.
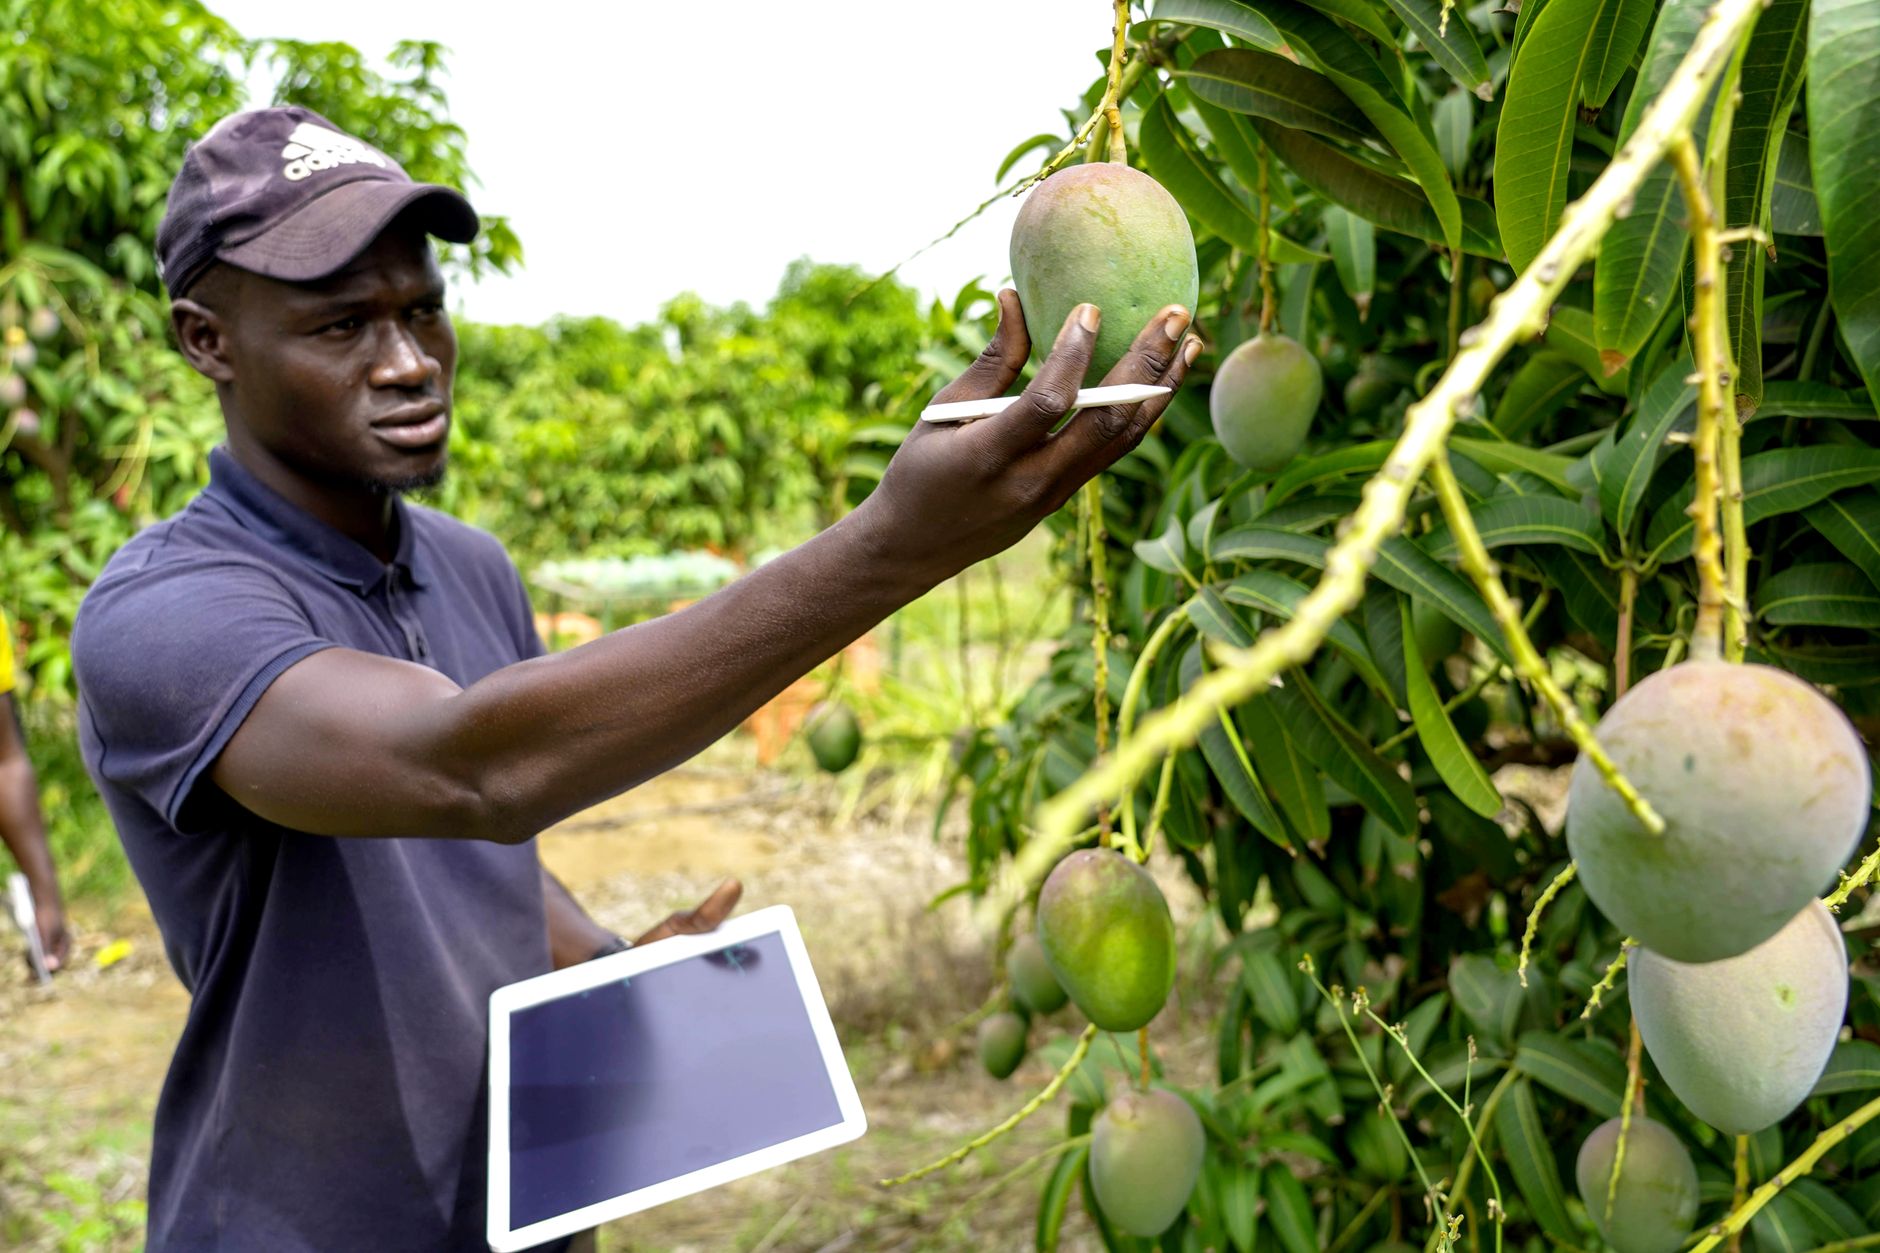
Your next step is a ground check on a sample of flagged trees. Expose a few roots, look at the crown base and trunk for cankers or wetness, check the emitters that feed each tree, and compare the flagged zones with your drainage notes. Keep the results with the flight map so next spring's flights have something to compare against.
What does a spring drone survey of a 400-acre block involve?
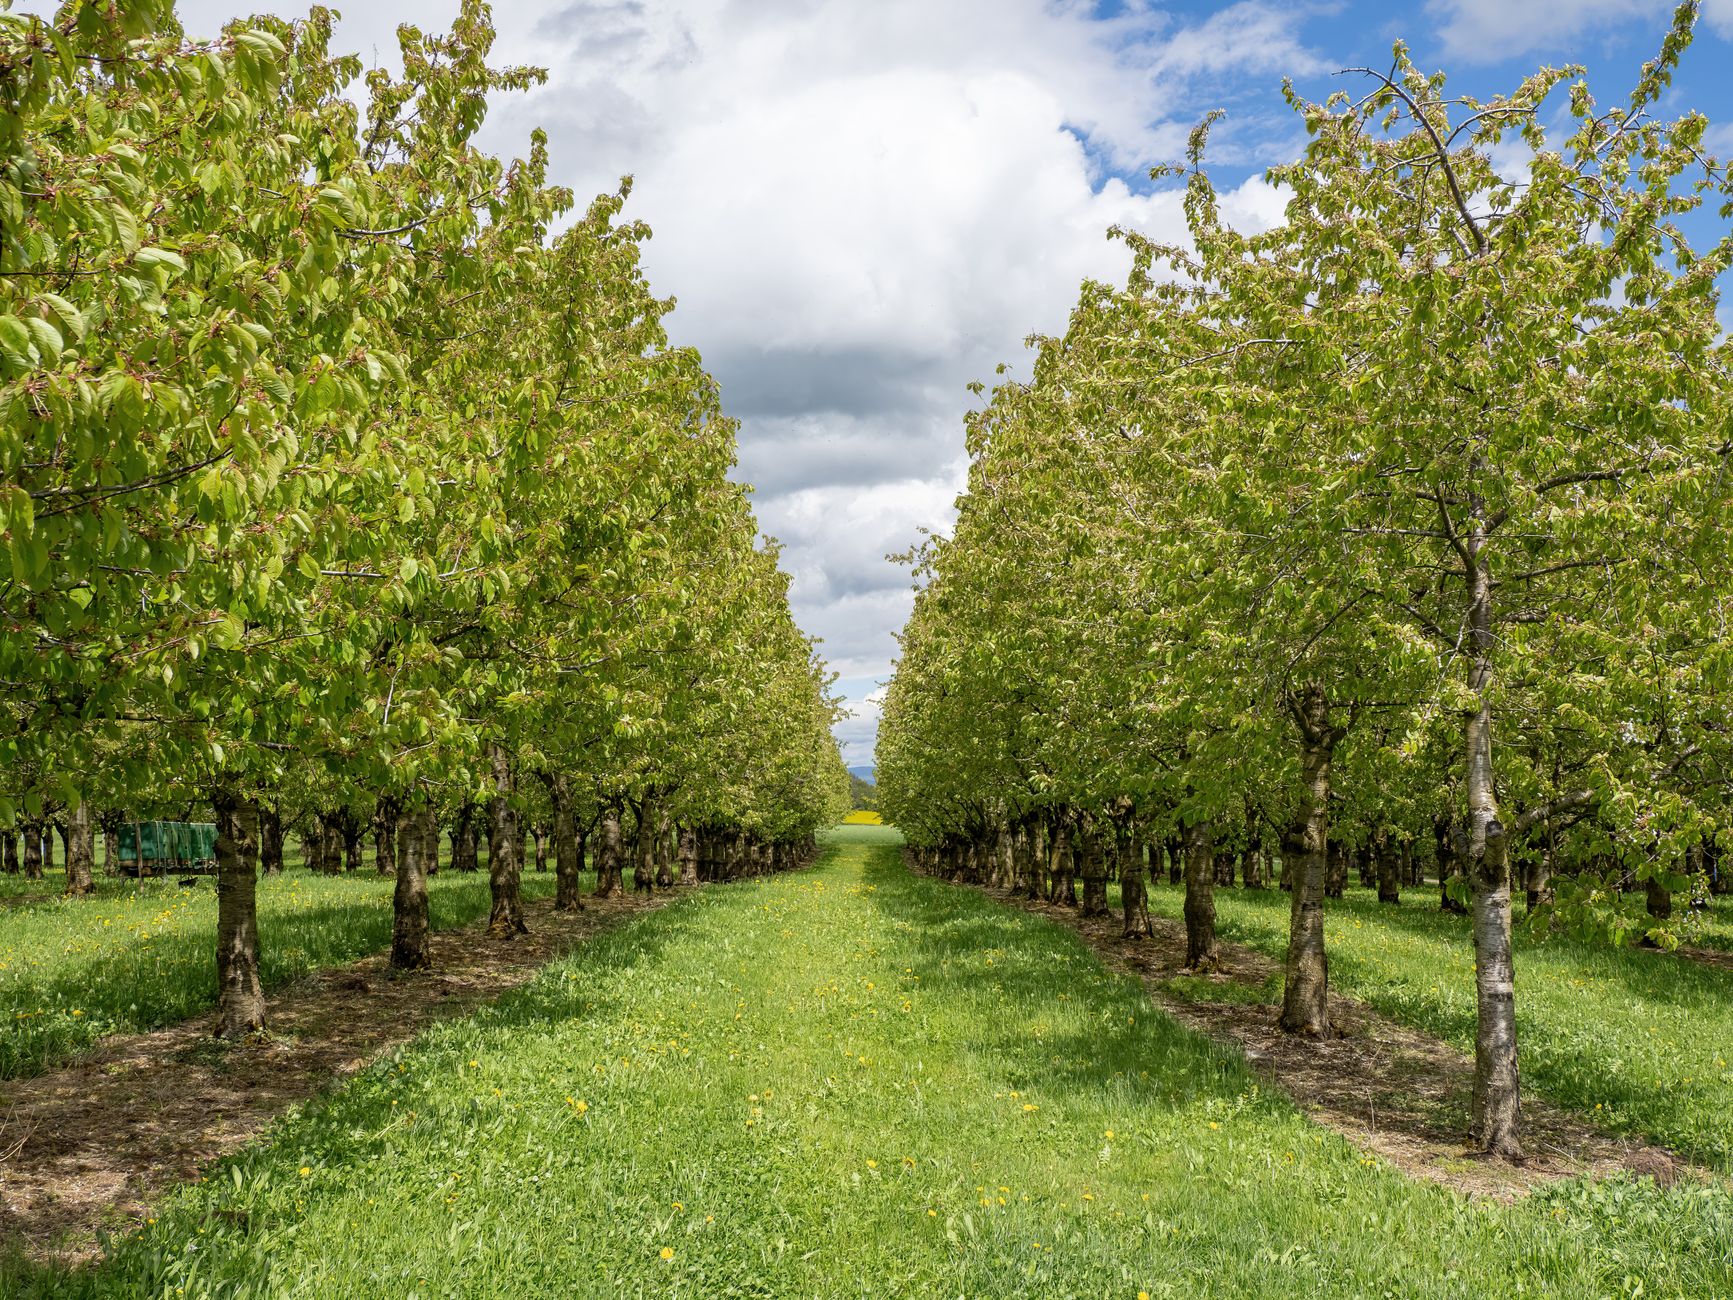
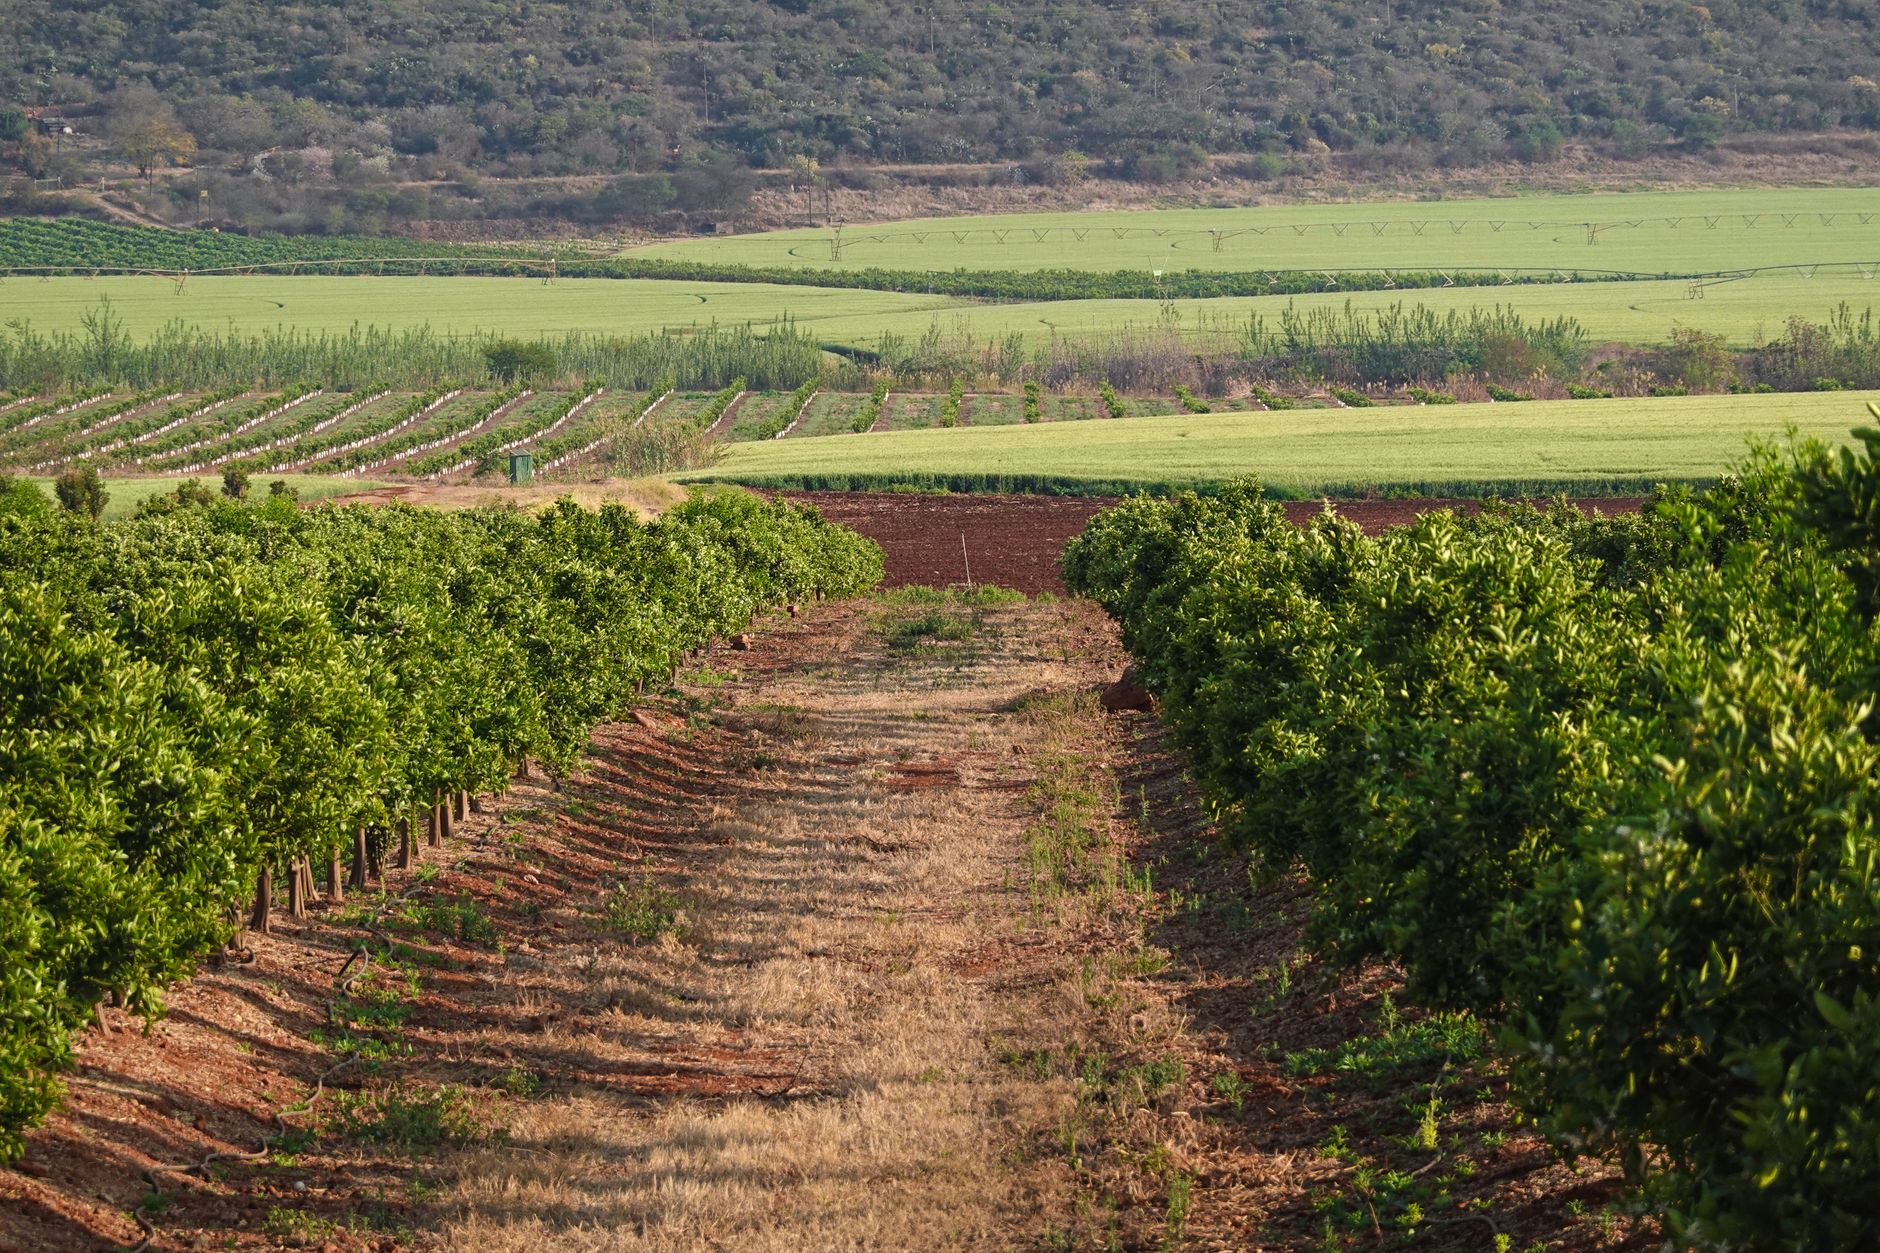
A workable spring program starts before the first flight. Map the block, mark low spots and the irrigation layout, and agree on what a flag means for your crew. Choose a window when the canopy is developed enough to show color differences, then fly the same route at the same altitude each time so the comparisons mean something.
The EGU walnut abstract compared multispectral survey altitudes and their effect on disease identification accuracy, which is the right question to ask any provider. Ask what altitude, what sensor, and what accuracy was checked on orchard trees, not on a generic canopy. Request the flight plan and the output format before you agree to any survey.
Useful output is practical. A good result is a map with each flagged tree located, a comparison with last season, and a short list of which flags need a ground check first. Trees near low spots or with recent storm damage usually belong at the top of that list. A flight log with dates, weather, and altitude makes the data usable across seasons.
Plan on repeat flights. One spring flight is a snapshot. Two or three passes, timed around wet spells and storms, show the direction of change, which is what separates a stable tree from one that is failing. Pair each pass with ground checks so the map and the roots tell the same story.
What rules apply to flying a drone over a commercial orchard?
Flying for imaging is a regulatory matter separate from flying for treatment. According to a trade summary of the FAA rules, a standard Part 107 remote pilot certificate does not by itself authorize aerial application of agricultural products. Spraying, seeding, or any dispensing falls under Part 137 on top of Part 107. Heavier aircraft typically need a 44807 exemption.
Enforcement is real. The FAA has proposed a civil penalty against a company for spray flights made without an agricultural aircraft operator certificate. Those cases concern spraying, so do not read them as a rule for imaging-only work, but they show why any flight plan that adds dispensing must be checked against Part 137 before it leaves the ground.
State pesticide applicator licensing may also apply if any product goes on the orchard from the air. The research notes for this page address spraying, not survey flights, so confirm imaging-only requirements yourself. Check the FAA eCFR entries for 14 CFR 107.36, Part 137, and the 44807 exemption, and ask your county agricultural office about state requirements. Do not assume a flight that only photographs is exempt from every rule.
Ask any provider to walk you through its operating procedures before the first flight. Cover takeoff and landing sites, overflight of people and equipment, and how batteries are handled on a block this size.
How does a leased drone program fit with your crew and harvest?
Harvest is where the labor math lives, so tie the spring work to it. A UC cost study from the Sacramento Valley put raking at about 1.5 labor hours per acre, with shaking, picking, and hulling contracted out. The study's date is uncertain, so ask the UC Cooperative Extension farm advisor for Butte County for up-to-date labor-hour figures before you build a plan on them.
The practical split on a 400-acre block is simple. The drone flies and flags. Your crew or a contracted pilot walks the flags. Your irrigation and drainage records explain the pattern. A service plan keeps the aircraft flying through the season. If a flight finds a cluster of stressed trees on a low row, the fix is usually drainage or water delivery, not a second flight.
We are a commercial robot integrator, not a single-manufacturer shop. We are OEM-neutral, so we choose the aircraft for the job rather than the line one maker sells. We lease equipment through financing, deploy and integrate it, train your staff or pilot, and service it under our service plan with regional service engineers. A free site assessment tests the idea on your own rows, and the lease payment comes in a quote after that assessment.
When is a drone the wrong call for a walnut orchard?
A drone is the wrong call if you need a diagnosis from the air alone. If the cause is already known, such as a broken irrigation main you can see from the road, a flight adds little. It is also the wrong call if your crew cannot respond to flags within a week. The value is early warning, and a flag that sits until harvest is no better than a count.
It is also the wrong call if your irrigation and drainage records are missing or unreliable. Without them, a flag has no comparison point, and the season turns into guessing. Start by mapping low spots, emitter layouts, and the wet winters you remember, then decide whether to fly.
Finally, do not add spraying to the same plan without a separate review. Spraying brings Part 137, possible state licensing, and its own operating rules. An imaging program stays simpler to run, and it answers your spring question most directly.
Frequently asked questions
Want a drone at your walnut orchards?
Tell us about your site. We will recommend the robot, quote the lease, and keep it serviced.
Sources
- Gridley Herald, Butte County crop rankings
- California Walnut Board, December 2025 inventory report
- FreshPlaza, USDA forecast for California walnut harvest
- doc.surf, Chico California climate
- Weatherspark, Chico Municipal Airport averages
- UC Tehama County, Phytophthora and drainage material
- UC ANR farm advisor blog, Tulare County decline
- Agricultural drone rules summary (Part 107 and Part 137)