Key takeaways
- Measure complete cart cycles, including empty returns and waiting, before estimating labor savings.
- Value production starvation with contribution margin on lost good output, not revenue or machine hourly cost alone.
- Treat carrier modifications as a fleet cost because casters, hitches, restraints, and cart geometry can decide feasibility.
- Model peak, normal, and trough months separately so seasonal utilization does not produce a misleading payback.
What determines payback?
An autonomous mobile robot pays back when the verified value of labor redeployment, lower material damage, and avoided production starvation exceeds the full deployed cost. In textile mills, route density and delivery timing usually matter more than headline travel speed. A busy spinning-to-weaving loop can be attractive, while a long but infrequent move may remain cheaper by cart crew.
For a purchase, calculate payback months as total initial cash cost divided by average monthly net benefit. For an AMR lease program, the test is different: monthly verified benefit must exceed the recurring charge, service costs, and an internal monthly allocation for carrier modifications.
Do not build the case from an annual average alone. Calculate peak, normal, and trough production periods, then weight their benefits by the months each condition actually occurs. This exposes routes that look excellent during order surges but leave an asset underused during softer runs.
- Annual labor capacity that can be reassigned or removed from schedules
- Avoided yarn, fabric, packaging, and rework losses attributable to transport
- Contribution margin preserved by reducing material-related machine starvation
- Robot deployment, integration, charging, network, training, and service costs
- Cart, rack, hitch, caster, restraint, and docking modifications
- Seasonal utilization, downtime, exceptions, and empty travel
Start with trips, not headcount
A credible model begins with a route ledger. Record every request from sliver, roving, spinning, winding, warping, weaving, inspection, finishing, and staging. Capture the request time, pickup time, delivery time, origin, destination, carrier type, load condition, and reason for the move.
Observe complete cycles. A tow operator may walk to a cart, search for the correct lot, wait for clearance, couple carriers, travel loaded, uncouple, scan paperwork, and return empty. Counting only loaded travel misses much of the reclaimable time. It also hides congestion and dispatch problems that repetitive transport automation may correct.
Separate scheduled milk runs from urgent calls. Scheduled demand is easier to batch. Urgent calls may carry greater production value, but they also require dependable dispatch logic and clear escalation when a cart, aisle, or destination is unavailable.
- Handler minutes per complete cycle
- Loaded and empty distance
- Trips by route, shift, product family, and carrier
- Queue time before pickup and at destination
- Late deliveries and the process they affected
- Manual interventions, blocked routes, and failed couplings
How should walking and tow labor be valued?
Multiply reclaimable hours by the plant's loaded labor rate, including payroll taxes, benefits, shift premiums, overtime, and supervision. Do not multiply every observed minute by wage and call it savings. Time has financial value only when schedules change, overtime falls, outside labor is avoided, or employees move to work that constrains output.
The Bureau of Labor Statistics reported preliminary average textile mill earnings of $28.27 per hour and 42.1 weekly hours in June 2026. In Greensboro-High Point, a major textile region, BLS reported a May 2025 mean wage of $18.80 per hour for hand freight, stock, and material movers. These are useful checks, but the mill's own loaded rate should drive the model.
Keep walking and towing distinct. Walking to find, call, or stage a carrier may remain after a cart pulling robot arrives unless dispatch, identification, and pickup rules also change. Count only the minutes the designed future process genuinely removes.
How do damage and production starvation enter the model?
Transport damage is rarely labeled AMR opportunity in the quality system. Search existing cause codes and incident notes for roll edge crush, yarn abrasion, snagging, telescoping, contamination, moisture exposure, dropped bundles, mixed lots, and identification errors. Reconcile those events to routes and carrier types before assigning any benefit.
Annual damage benefit equals baseline move-related incidents multiplied by expected reduction and the verified cost per incident. Use material cost, disposal, rework labor, inspection, handling, and lost conversion already incurred. Exclude revenue that appears again in the starvation calculation.
For production starvation, log each instance in which a machine waited for yarn, warp beams, fabric rolls, chemicals, packaging, or an empty carrier. Value the lost good output at contribution margin per unit. If output can be recovered later without overtime, missed shipments, or displaced production, the financial loss may be small even when the stoppage looks dramatic.
This distinction prevents a classic double count. Do not add idle operator wages, nominal machine cost, lost revenue, and lost margin for the same interruption. Finance should approve one economic treatment for each event category before the pilot begins.
Carrier modifications can make or break the case
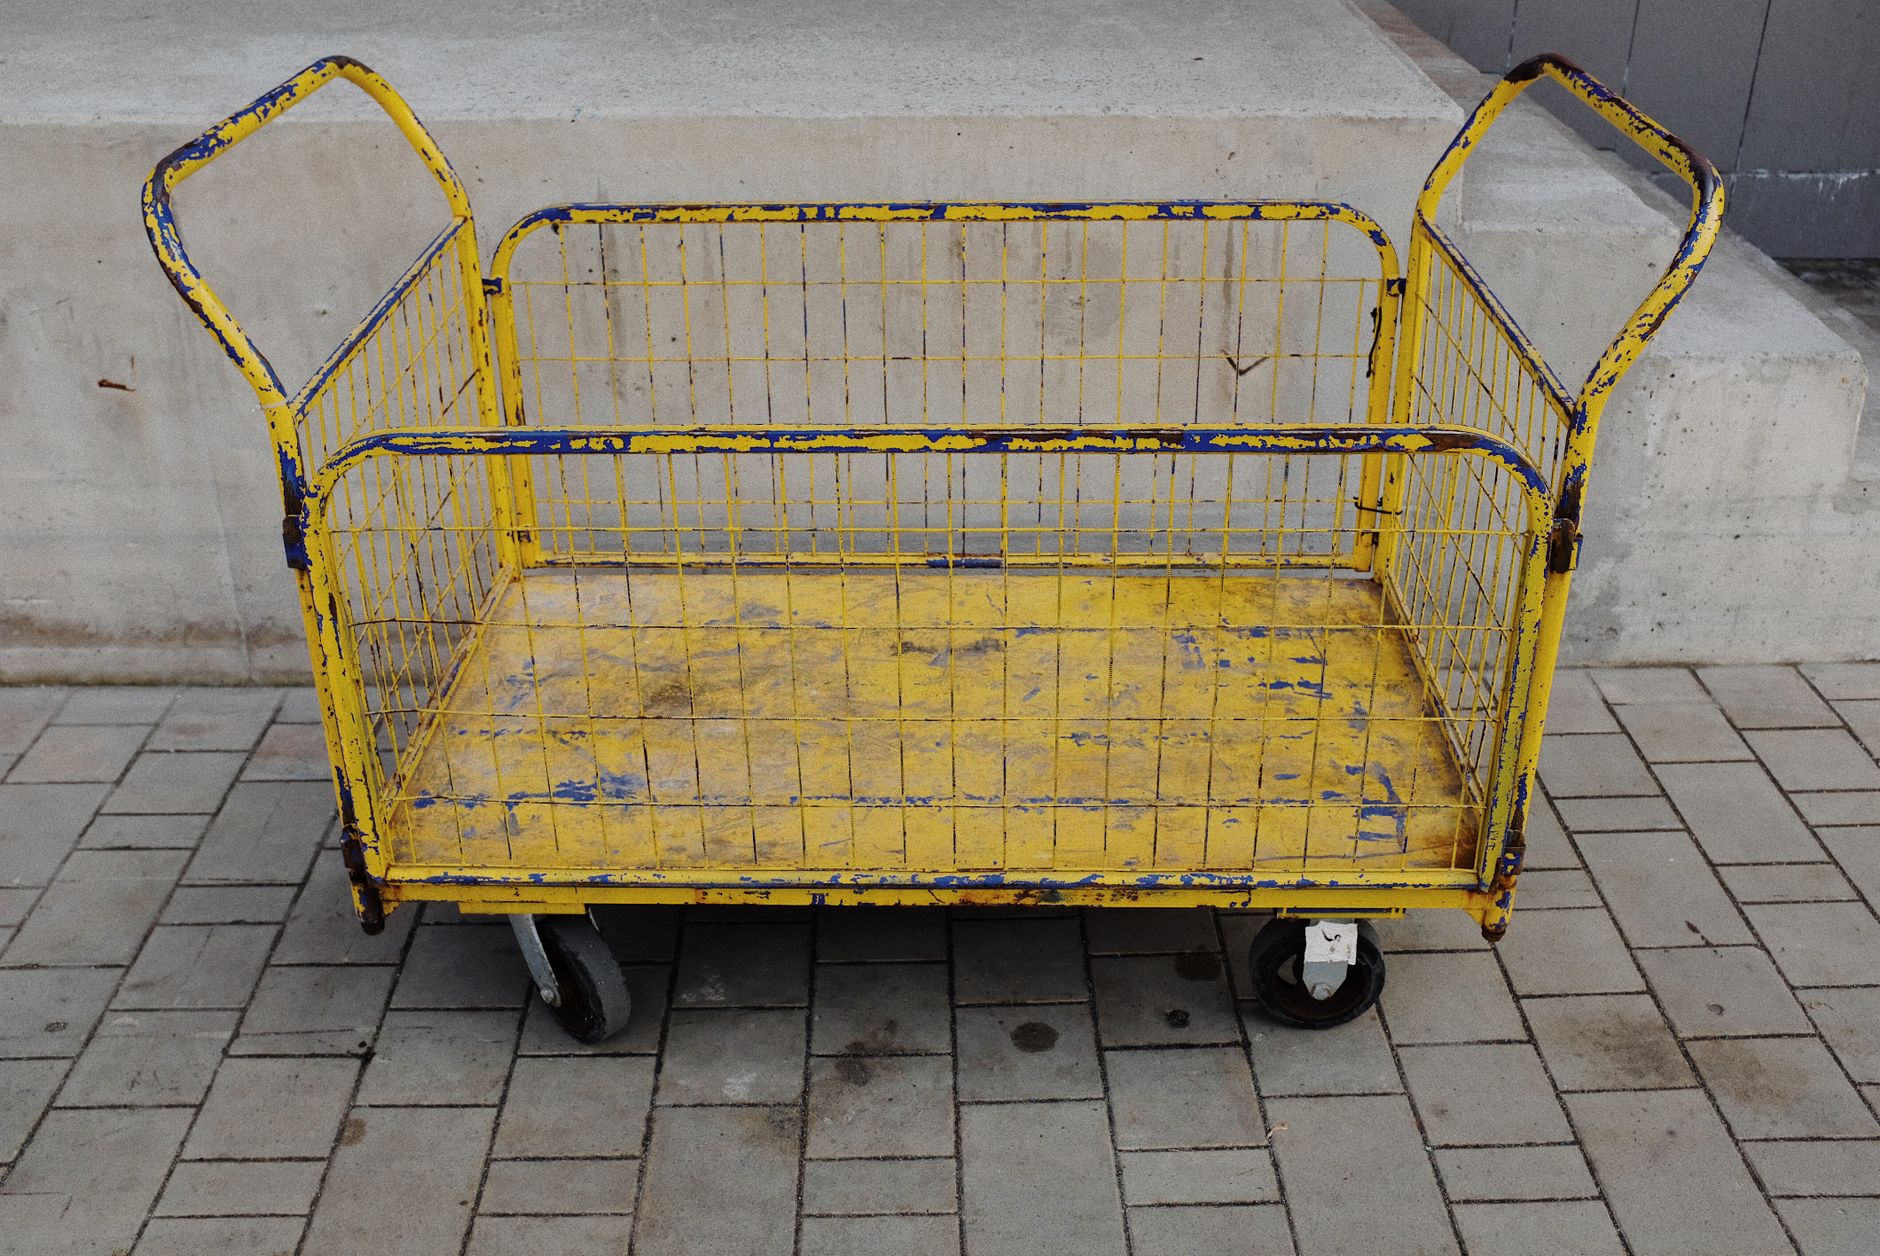
Textile carriers are often the hidden engineering project. Legacy carts may have inconsistent hitch heights, worn casters, flexible frames, protruding yarn, poor load restraint, or geometry that changes after loading. A tug robot lease cannot compensate for a cart fleet that couples unpredictably or tracks badly through turns.
Price modifications across the entire carrier population needed for the route, not just the carts used in a demonstration. Include standardized hitches, captive pins, guides, bumpers, restraints, identification tags, docking stops, and caster replacement. Add inspection and preventive maintenance because degraded wheels raise rolling resistance and can defeat an otherwise sound tow design.
OSHA specifically notes that thread and scraps can clog fabric-cart wheels, increasing push or pull force. It recommends force-reducing casters, wheel maintenance, and housekeeping. Those practices improve manual safety today and give an AMR more consistent towing conditions tomorrow.
Test the heaviest real load on the least favorable approved floor, turn, threshold, and grade. Rated towing capacity alone does not prove safe stopping, stable tracking, or repeatable docking with the mill's actual carriers.
How should seasonal utilization be modeled?
Build a month-by-month demand table using production schedules, shipment history, style changes, planned shutdowns, and peak staffing. Calculate trips, active robot hours, labor benefit, starvation benefit, and expected availability for each month. Then sum the monthly net benefits rather than multiplying a strong week across the year.
The Federal Reserve series for textile mill capacity utilization registered 65.1590 percent in May 2026, 65.3647 percent in June, and 64.8673 percent in July. Those are seasonally adjusted national readings, not a forecast for any plant, but they reinforce the need to test utilization assumptions rather than treating installed capacity as constant demand.
Short peaks can change the financing choice. Compare purchase, robot leasing for business, monthly payment programs, an AMR lease, and a lease purchase program using the same demand table. Include minimum terms, remobilization, repeat mapping, training, service, and carrier work. A no upfront capital structure improves cash timing, but it does not rescue an underused route.
Build a finance-ready payback worksheet
Use a base case supported by observed operations, then create conservative and peak cases. The conservative case should reduce trip capture, damage prevention, and starvation recovery while increasing exception labor and downtime. Decision makers can then see which assumptions control the result.
Keep labor capacity, damage, and starvation in separate rows with named data owners. Operations validates trips and cycle time. Quality validates move-related losses. Production and finance approve the value of prevented starvation. Engineering owns carrier and facility modifications. This structure makes optimistic inputs easy to find and correct.
The 2024 BLS rate for recordable injury and illness cases in textile mills was 2.5 per 100 full-time workers, with 1.6 cases involving days away, restriction, or transfer. OSHA and NIOSH identify lifting, pushing, pulling, repetition, and awkward posture as ergonomic risk factors. Treat reduced manual exertion as an important operational benefit, but include injury savings in payback only when the mill has defensible claims or incident data.
- Initial cost equals equipment, integration, facility work, carrier changes, training, and launch support.
- Annual verified benefit equals labor capacity plus avoided damage plus avoided starvation plus other approved savings.
- Annual net benefit equals verified benefit minus recurring software, service, energy, support, and exception labor.
- Purchase payback months equals initial cost divided by annual net benefit, multiplied by 12.
- Subscription contribution equals monthly verified benefit minus the total monthly program cost.
Prove the assumptions with a production pilot
A commercial robot demo should test the economic hypothesis, not merely show that a machine can drive. Run representative carriers, loads, shifts, intersections, doors, dust conditions, and production peaks. Measure completed missions, human interventions, queue time, coupling reliability, delivery lateness, damage, and machine waits against the established baseline.
Service Robot Co. provides the site assessment mapping, robot pilot program, financing, robot deployment and integration, training, go live support, and ongoing service through a nationwide US engineer network. As an OEM-neutral, vendor neutral robot integrator, it can select the right material handling platform across manufacturers instead of forcing every textile route onto one product family.
That one partner, one number model also keeps lifecycle responsibility clear. Carrier engineering, fleet behavior, maintenance, remote triage, and on-site dispatch affect the same payback equation. A pilot should end with an approved future-state process, validated costs, measured benefits, and deployment gates for each additional route.