Key takeaways
- IFR reports almost 250,000 professional service robots shipped in 2025, up 24%.
- The 238 supplier sample shows direction, not how many floors already run robots.
- Cleaning sales rose 40% in 2025, per trade press coverage of IFR's presentation.
- Benchmark with square footage, cycles and gap hours, grouped by floor type and traffic.
- Pilot one zone before you expand, and compare lease quotes in writing.
Are competitors really automating their floors?
Some are, and the broad numbers point the same way. According to the International Federation of Robotics, global professional service robot shipments rose 24% to almost 250,000 units in 2025. That is a striking jump for a single year.
A market total is still not a verdict on the floor across the street. Shipments measure what a sample of suppliers sent out the door, not how many floors now run a machine. That difference decides whether the headline should alarm you or simply inform you.
The useful answer for an operator is this: the headline shows the direction, and only your own zone counts can show whether you are behind. The rest of this piece explains how to build that count and where IFR's figures stop being useful.
What IFR's 2025 count is built on
IFR's professional service robot figures come from a sample of 238 suppliers. The organization is explicit that, unlike its industrial robot statistics, the service robot data comes from a supplier survey and is not projected to represent the entire industry.
IFR also warns against comparing figures across its reports, because the sample composition can change from one edition to the next. The earlier World Robotics report, which covered 2024 data, is a distinct dataset from the 2026 release, not an earlier chapter of the same story.
Where cleaning sits in the 2025 breakdown
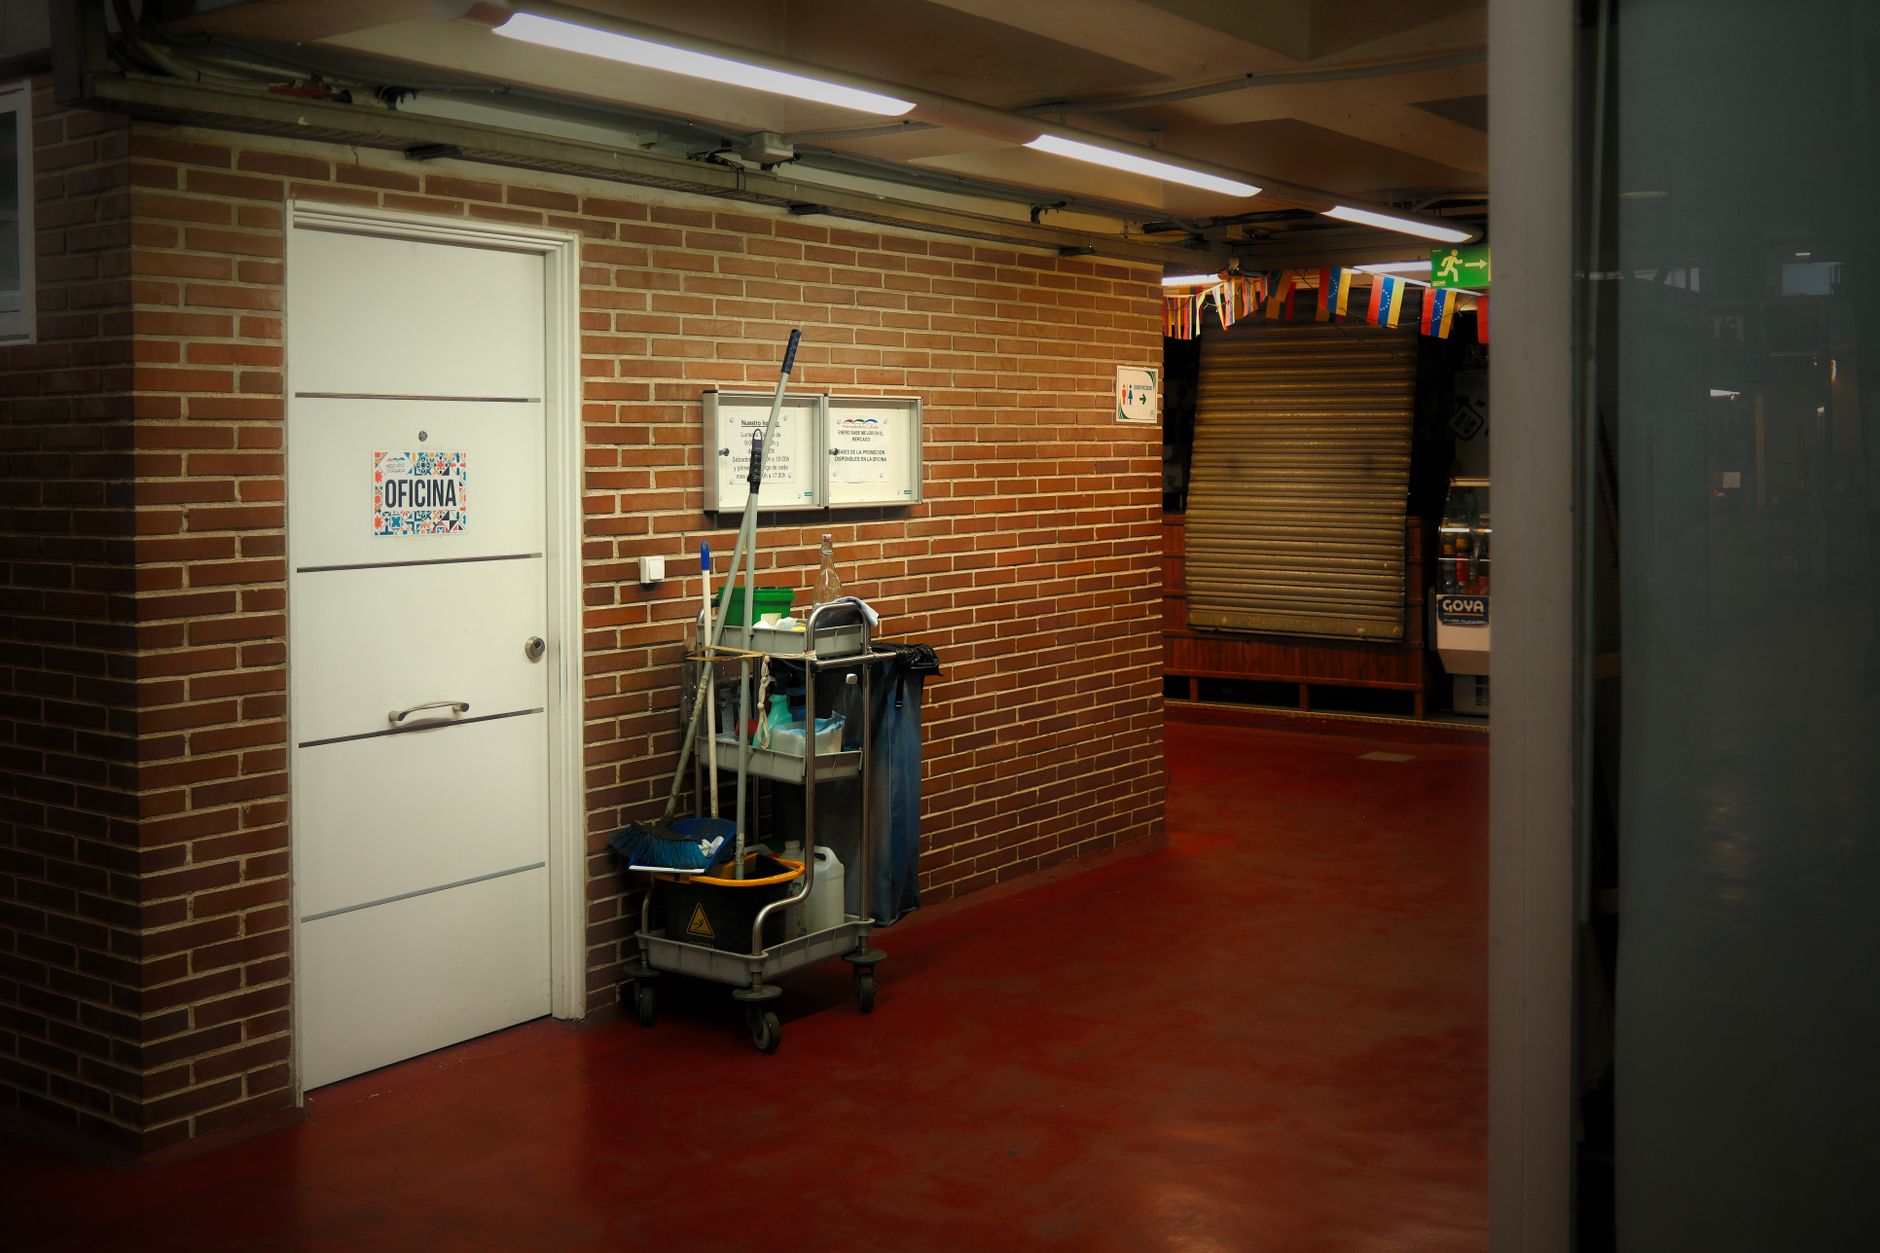
Transportation and logistics led the category, and hospitality ranked second. Professional cleaning ranked third, with floor cleaning as its main application. Cleaning is a real and growing slice of the total, though it is not the largest one.
For context, IFR's earlier report put professional cleaning sales up 34% to more than 25,000 units in 2024, mainly floor cleaning. Set those figures beside the 2025 numbers only with the caution above, and never as a single trend line.
- Transportation and logistics: 117,500 units in 2025, up 21%, a 47% share of the professional service robot market.
- Cleaning robot sales: up 40% in 2025, as reported by trade press covering IFR's presentation.
- Inspection and maintenance robots: up 83% in 2025, per the same trade press coverage.
- Professional cleaning unit count for 2025: not available in the material reviewed for this article.
What the numbers cannot support
Three limits matter most. A sample of 238 suppliers is not the whole industry. A comparison across reports can mislead because the sample shifts. And a growth percentage says nothing about penetration, so a 40% jump can still leave most floors untouched by a machine.
Trade coverage of the 2026 report also says service contract and leasing arrangements are growing, and that IFR described one such model as already dominant in the United States. Read that as IFR's characterization as relayed by the press, not as a measured market share.
How to benchmark your floors without guessing
Start with facts you hold, not rumors about a competitor. For each floor zone, record its square footage, its surface type, how often it is cleaned, who cleans it, and how many hours a week that work takes. Then add the gap hours: the stretches when the site runs with no cleaning crew on shift.
Next, gather peer data you can verify. A site visit where it is allowed, a public listing, or a direct conversation with a manager can all sharpen the picture. Mark every estimate as an estimate, and group peers by floor type, traffic and operating hours before comparing. A 20,000 square foot showroom and a 200,000 square foot warehouse do not share a benchmark.
- Square feet per zone, with hard surface, carpet or mixed noted
- Cleaning cycles per week and the labor hours each cycle takes
- Overnight or weekend hours with no cleaning staff on shift
- Days per year a zone stays visibly soiled or closed for cleaning
Where a lease fits once the gap is measured
Once the gap is measured, the question becomes how to close it and how to finance that work. Service Robot Co. is a full service commercial robot integrator for US businesses. We pick the right robots across manufacturers, then lease them on a three year lease with one fixed lease payment quoted after a site assessment.
We also deploy, integrate, train and service every unit through a nationwide US engineer network, so one partner covers the whole lifecycle. The site assessment is where a benchmark becomes a deployment outline: which zones a robot can cover, where it charges, and what the fixed lease payment includes. Quotes depend on the site, so compare them in writing.
What a benchmark should change on your floor
Pilot one zone first. Run a robot on a single overnight route for a set window, record the same metrics you gathered for the benchmark, and decide on expansion from those numbers. A single zone tests whether the machine fits your aisles, your surfaces and your hours.
If the benchmark shows gaps that one machine cannot close, add robots by zone and by shift rather than by headline. IFR's figures describe where the market is moving. Your cycle counts and gap hours decide what happens on your floors next.

Frequently asked questions
Want a robot working for you?
Tell us the job and the site. We will recommend the robot, quote the lease, and keep it serviced.
Sources
- IFR, World Robotics 2026 Service Robots press release
- Australian Manufacturing, global professional service robot sales rise 24% in 2025
- Supply Chain 247, transportation and logistics professional robot sales
- Supply Chain 247, transportation and logistics professional robot sales (sample caveat)
- IFR, service robots see global growth boom
- Business Wire, IFR World Robotics 2025 service robot release