Key takeaways
- IFR's 2026 release ranks professional cleaning third among the five largest professional service robot application groups in 2025.
- Global professional service robot sales rose 24% to nearly 250,000 units in 2025, according to IFR.
- The figures come from a sample of 238 suppliers, and IFR says they are not projected to the whole industry.
- Peer activity is a prompt to measure your own floor coverage, not a verdict on your site.
- Map zones, shifts and unfilled hours first, then ask for a fixed lease payment quoted after a site assessment.
Are peers really moving on floor care?
Yes, and the sector's own count says so. IFR's World Robotics 2026 service robot release, dated 30 September 2026, reports that global sales of professional service robots rose 24% to nearly 250,000 units in 2025. Within that total, professional cleaning ranked third among the application groups.
That ranking is a reason to look, not a reason to panic. It shows that floor care has become an established category for commercial operators. It does not show that your floors are behind, and the sections below explain why.
Which application groups did IFR rank?
According to IFR, the five largest professional service robot application groups in 2025 were the following. Floor cleaning is the main application within the professional cleaning segment. Transport and logistics leads the list, so floor care competes for attention with several other categories.
- Transportation and logistics
- Hospitality
- Professional cleaning
- Agriculture
- Inspection and maintenance
What does the ranking actually measure?
The ranking counts units sold, grouped by application, across IFR's survey sample. It is a map of where vendors placed robots, not a census of which facilities run them.
Read it as a sales picture. It tells you where demand has gathered, and it says nothing about how clean any particular floor is.
How should you read a 24% sales rise?
IFR reports the 24% rise for global professional service robot sales in 2025, based on a survey sample of 238 suppliers. IFR states that the data is not projected to the whole industry, so a headline percentage cannot be pinned to your city, your segment or your square footage.
The prior year gives a useful trend check. In the 2025 report, professional cleaning robots grew 34% to more than 25,000 units in 2024. We could not confirm a 2025 growth rate for cleaning robots from the release text we reviewed, so we do not quote one here.
What should your floor care numbers look like?
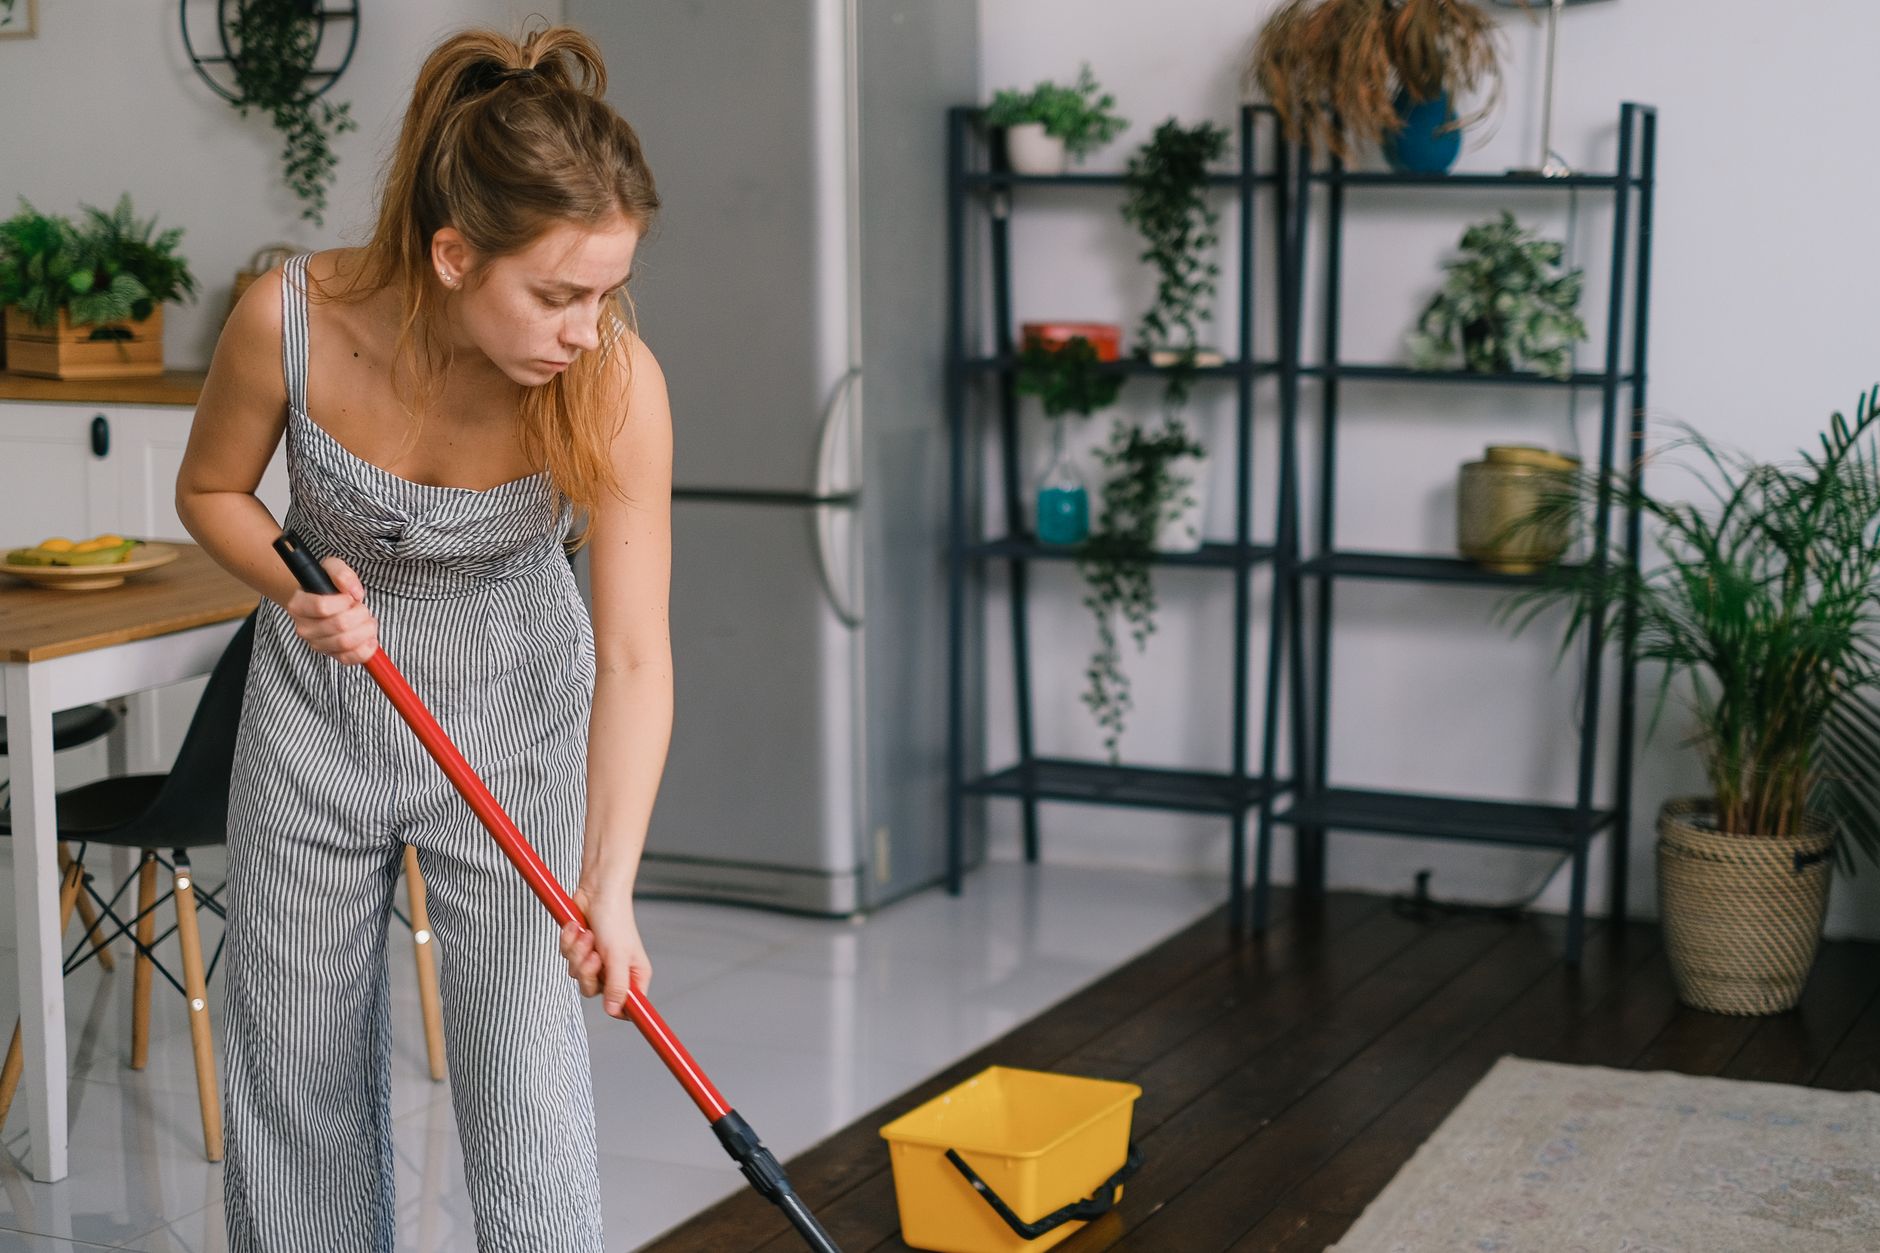
A benchmark only helps when it sits beside your facts. Start with a plain map of every floor zone, the hours each zone gets cleaned, who cleans it, and when. Mark any zone that depends on a single overnight worker or an unfilled shift.
Then put those figures next to the sector ranking and ask a narrower question: which zones lose coverage when a shift goes empty? That question has an answer on your site. The sector ranking does not.
- Floor area by zone, with high traffic zones marked
- Cleaning hours per zone, by shift, for a typical week
- Overnight and weekend zones with no assigned cleaner
- Spill response times and any slip incidents logged in each zone
- Hand cleaning hours that a scrubber or vacuum could take over
How do you compare with peers without guessing?
A fair comparison uses the same unit. Cleaning hours per zone per week tell you more than a robot count, because a peer with one scrubber on a single aisle is not running the same operation as a site with a dozen separate zones and a night shift.
Choose two or three comparable sites, such as stores of similar floor area or clinics with similar hours, and compare coverage gaps rather than headline volumes. If a peer shares its zone schedule, you can test your own schedule against it. If it does not, you have no basis for a verdict.
Where do floor gaps usually hide?
Gaps tend to hide in hours nobody scheduled. A warehouse that sweeps only at shift change, a hospital corridor cleaned during a daytime rush, or a restaurant floor mopped only after close can all look covered on a weekly chart. The gap shows up when a night crew calls in or traffic surges.
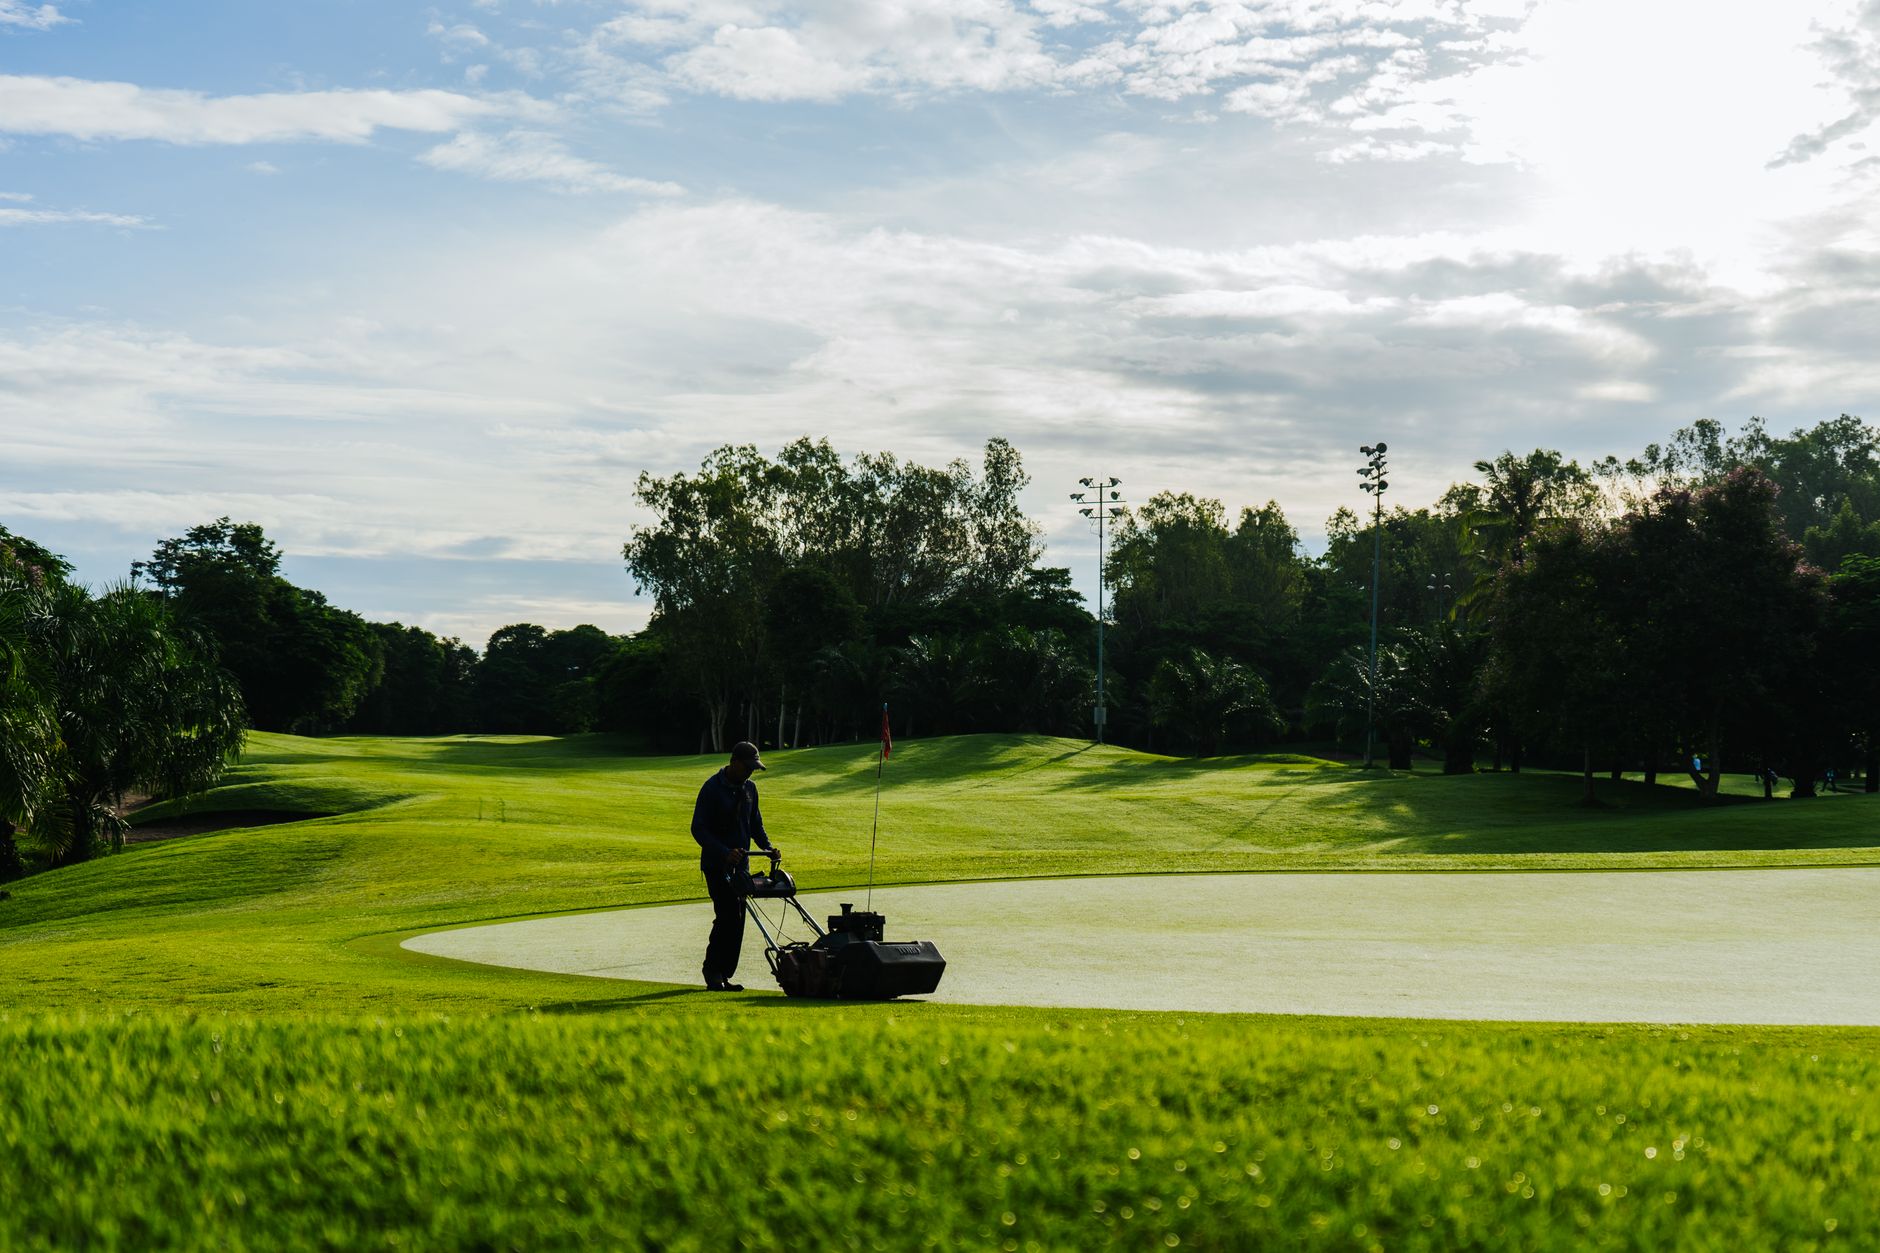
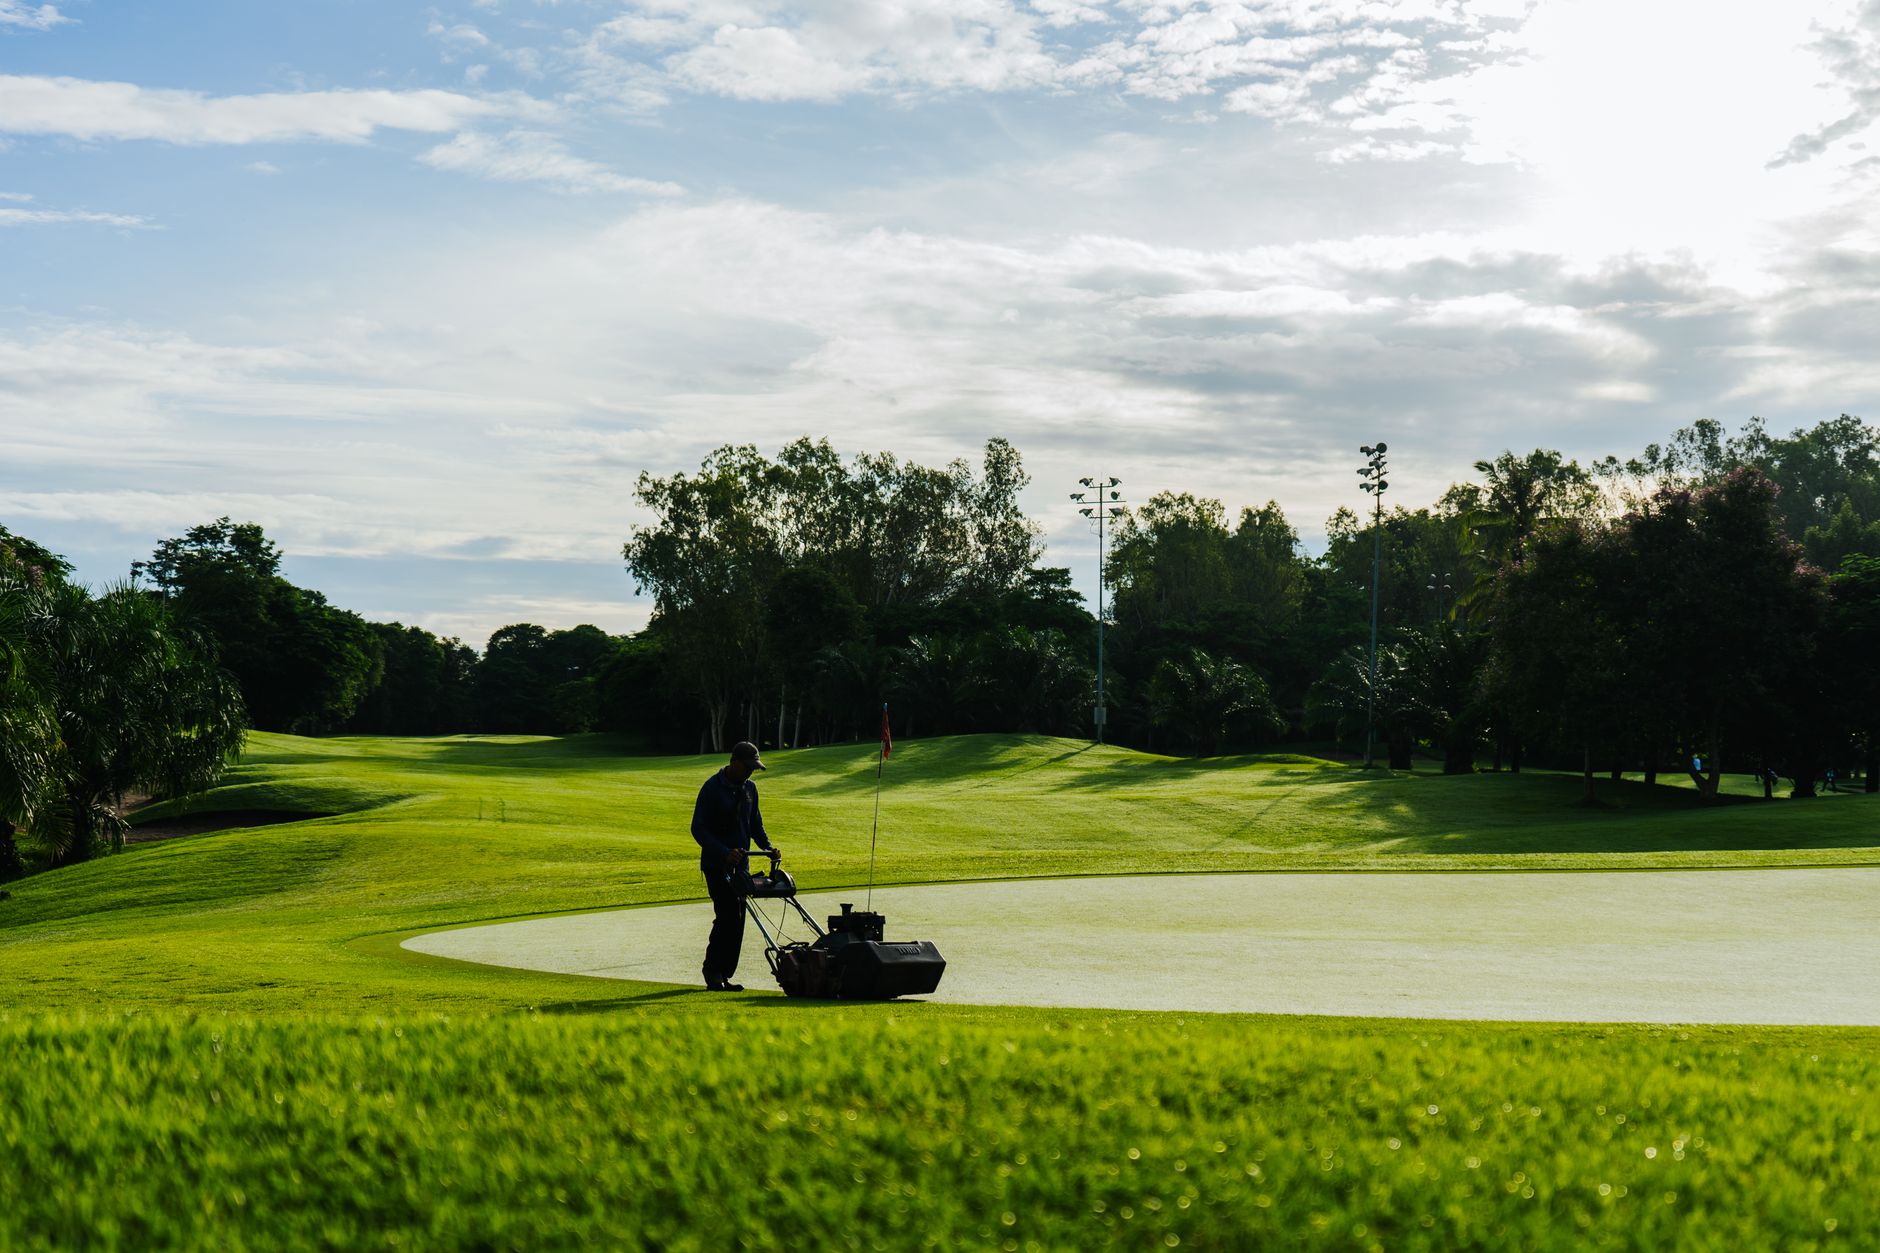
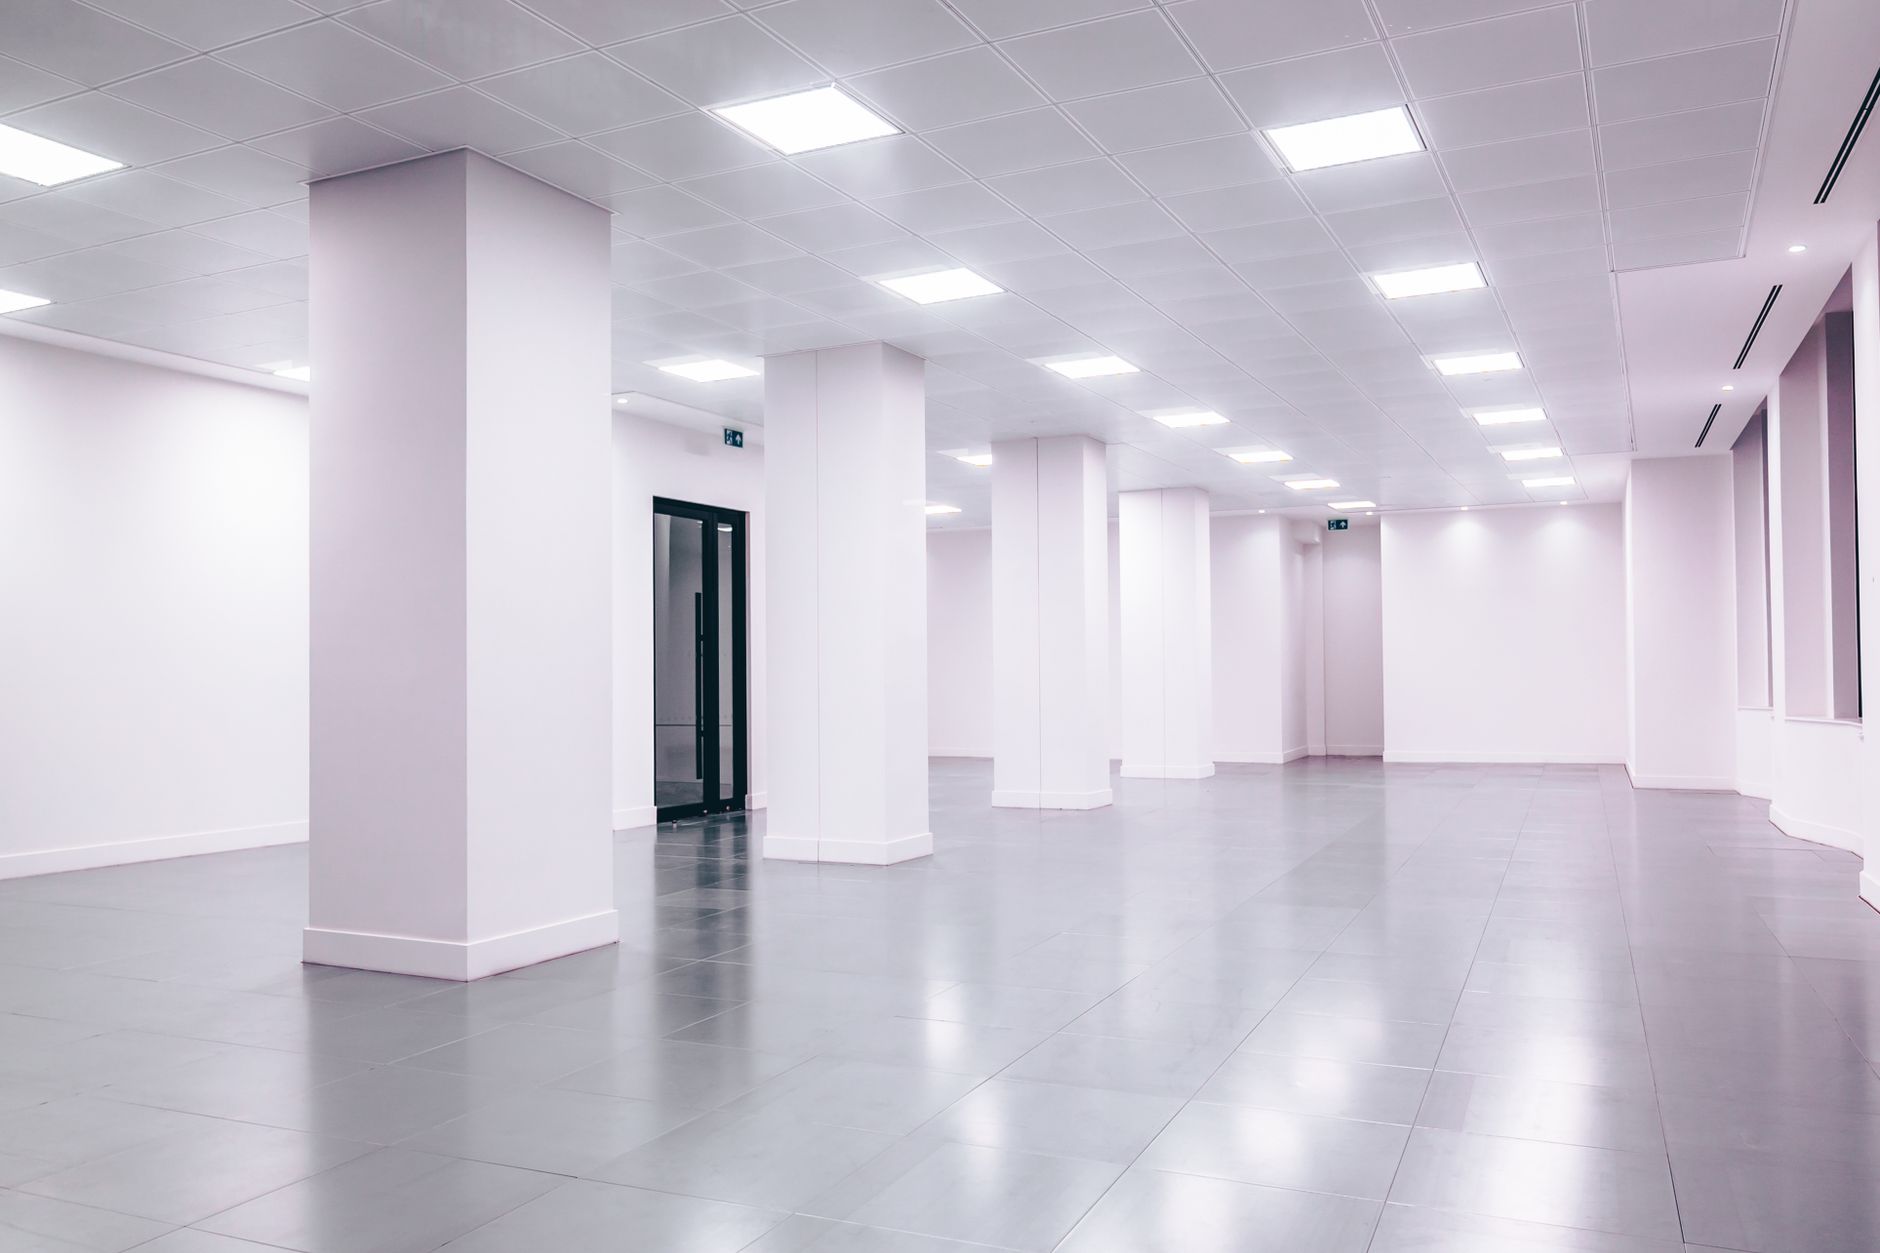
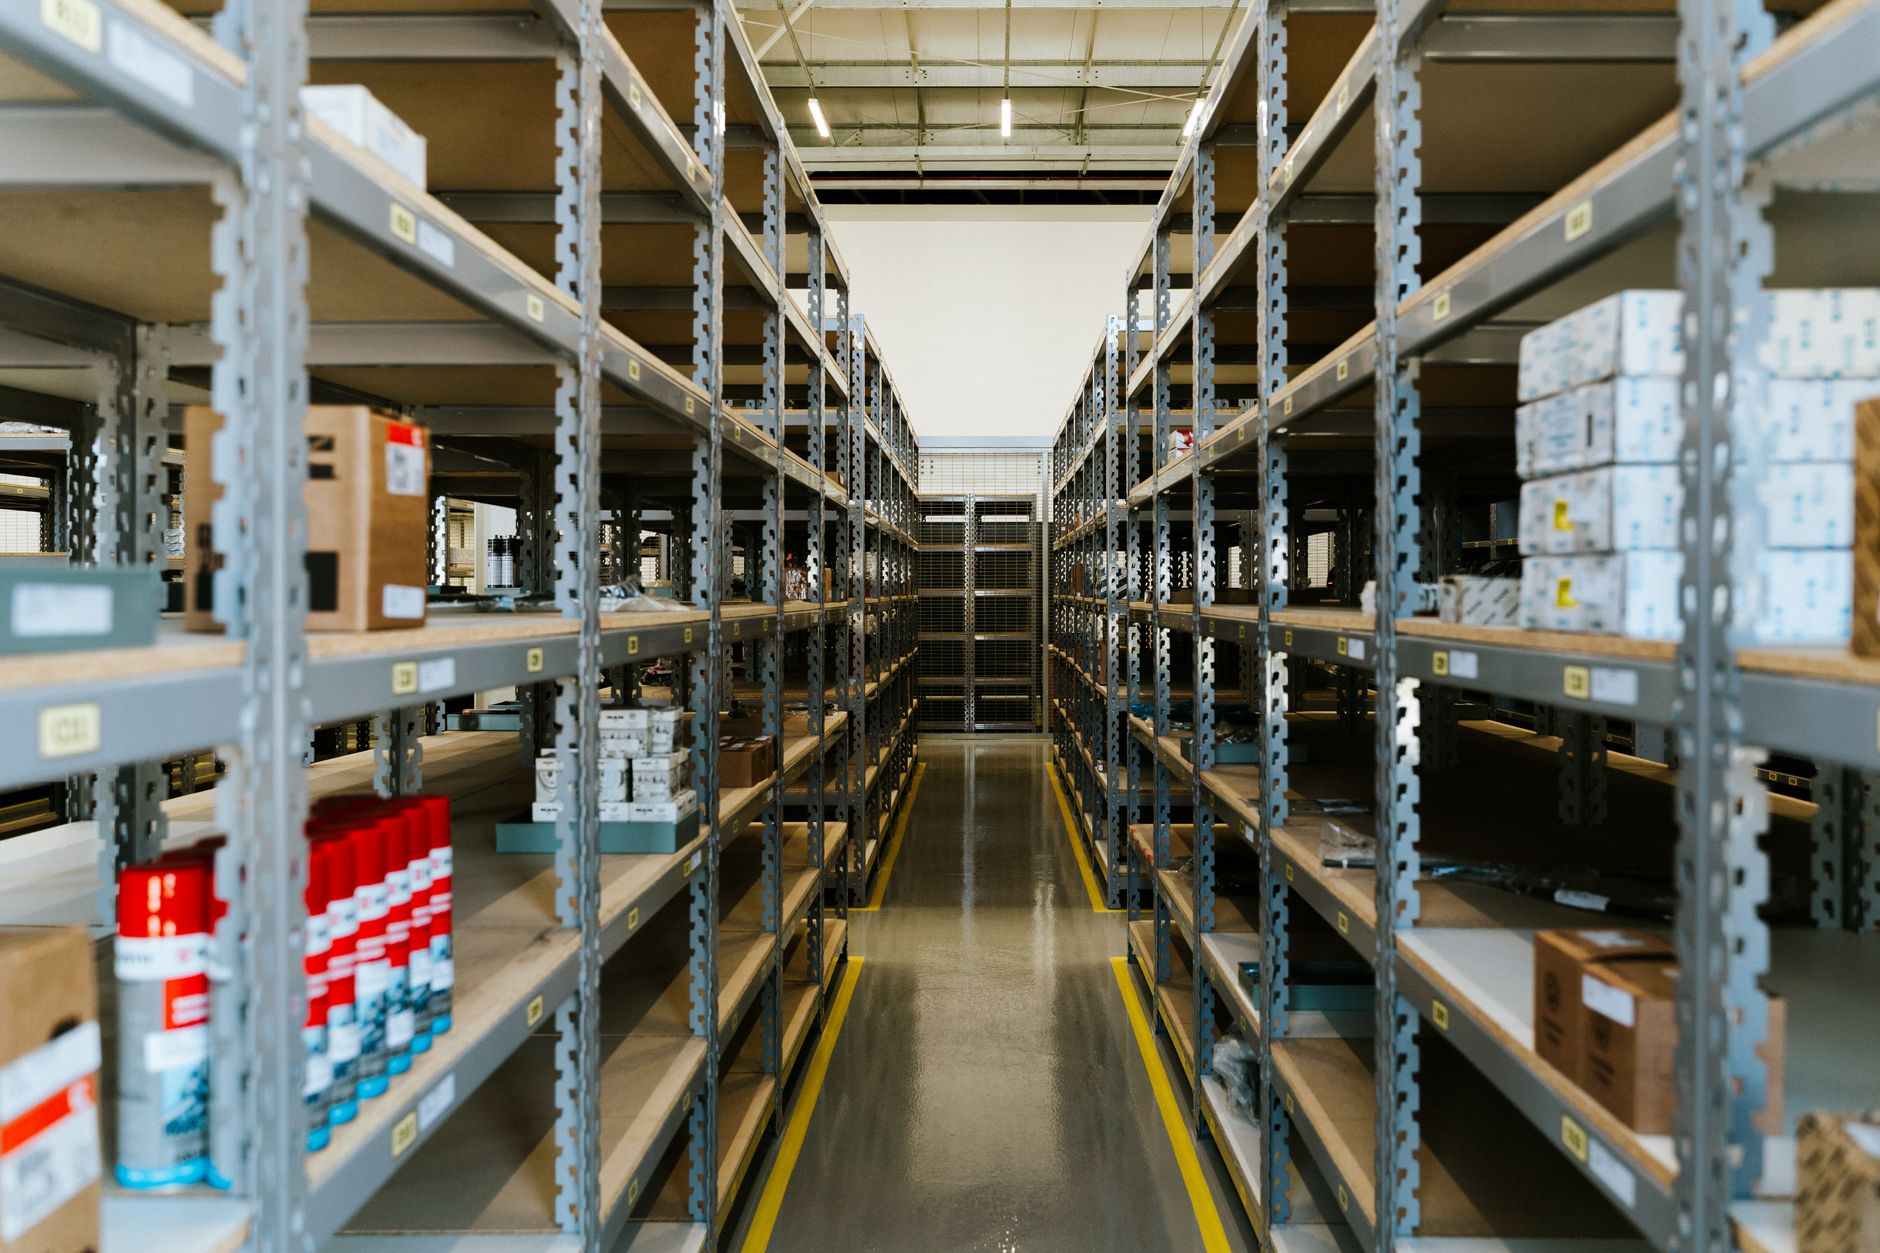
Large facility coverage is where a single autonomous floor scrubber running overnight can cover ground that a crew would split across several hours. Whether that holds for your building is a measurement question for your floors, and the sector data cannot answer it for you.
What does a benchmark leave out?
A sample of 238 suppliers cannot account for your building, your traffic, your local labor market or your cleaning standards. A grocery aisle, a hotel lobby and a distribution center floor carry different debris, different traffic and different hours. Treat a peer comparison as a prompt for questions, not a scorecard.
Keep the category in proportion too. A third place ranking reflects the sales mix that IFR's sample recorded in 2025. It does not measure floor quality, and it does not say that any particular facility has fallen behind.
How does a lease quote follow the gap check?
Once the gap is clear, the next step is a site conversation. Service Robot Co. is an OEM neutral commercial robot integrator for US businesses. We choose robots across manufacturers, lease them through financing, deploy and integrate them, train staff, and service every unit under RoboCare, our service plan, backed by regional service engineers in every state we service.
Our lease runs on a three year term with one fixed lease payment, quoted after a site assessment. A commercial cleaning robot lease quote built from your zone map and hours shows what closing the coverage gap costs, and what it leaves uncovered. We would rather review your floors than quote from a headline.
Frequently asked questions
Want a robot working for you?
Tell us the job and the site. We will recommend the robot, quote the lease, and keep it serviced.