Key takeaways
- IFR reported a 24 percent rise to almost 250,000 professional service robot units in 2025, based on a 238 company sample.
- The sample is not extrapolated to the whole industry, and its makeup varies from year to year.
- Treat cross report and year over year comparisons as directional, not as precise market trends.
- Name the edition, the sample, the definition and the measure in every memo that cites the figures.
What did IFR publish on September 30, 2026?
On September 30, 2026, the International Federation of Robotics released service robot figures for 2025 as part of its World Robotics 2026 Service Robots report. Global sales of professional service robots rose 24 percent to almost 250,000 units. Transport and logistics was the largest application, at 117,000 units.
Every figure in that report rests on a sample of 238 companies, according to IFR's German language press release. The release describes the data as sample data, not extrapolated to the whole industry, and says the sample's composition varies from year to year.
That gives decision makers the core answer. These are IFR sample results. They describe what the reporting companies recorded, so memos and board decks should present them as sample findings, not as a count of the whole market.
Why a sample of 238 companies is not a market total
A sample reports what its participants recorded. It does not tell you what every supplier shipped, and IFR does not scale the result up to the industry. A percentage can move because a large participant joined, left or changed its reporting, even when underlying demand held steady.
Unit sales and company counts also get blended in internal drafts. The 2024 IFR contents page shows company counts by country, an example of a supplier measure. A count of companies is not a count of robots sold, so keep the two labels apart in every table and chart.
A practical test helps here. Ask whether the figure would still hold if one large reporting company dropped out of the sample. If it would not, the number is too thin to carry a firm claim in a board paper.

Can you compare this year with last year?
Be careful. IFR's 2023 and 2024 contents pages list different section structures and numbering, which suggests scope sections were revised between editions. Use the 2026 contents page as the reference for present scope and definitions.
Combine a changing sample with revised scope and a year over year percentage has two moving parts. The reported change may reflect real demand, the makeup of the sample, or the revised scope. A memo can say the figure is consistent with growth in IFR's sample. It should not say demand rose 24 percent across the industry.
Which definitions sit underneath the number?
The 2026 report separates professional service robots from consumer and domestic service robots. A figure for one group says nothing about the other, and a board that reads a blended number will form the wrong picture.
The 2026 contents also include a section on where IFR definitions deviate from ISO definitions. If your memo uses the phrase service robot, name the IFR definition in the same paragraph. Otherwise the reader will assume the definition they already carry.
Unit figures and revenue are different measures, and this release is framed around units. Do not convert the unit figure into a dollar estimate for your budget. That conversion needs prices and product mixes the release does not provide.
Did IFR warn against comparing these numbers?
This matters because managers often look for an authority to cite. We did not find an IFR statement, in English or German, that explicitly advises against comparing service robot numbers across reports. The caution in this article comes from the sample language and from the scope and definition sections of the report contents.
Attribute the caution to your own reading of those sources. Writing that IFR forbids cross report comparison would claim more than the release says, and a careful reviewer checking the PDF will notice.
What does the transport figure tell a warehouse manager?
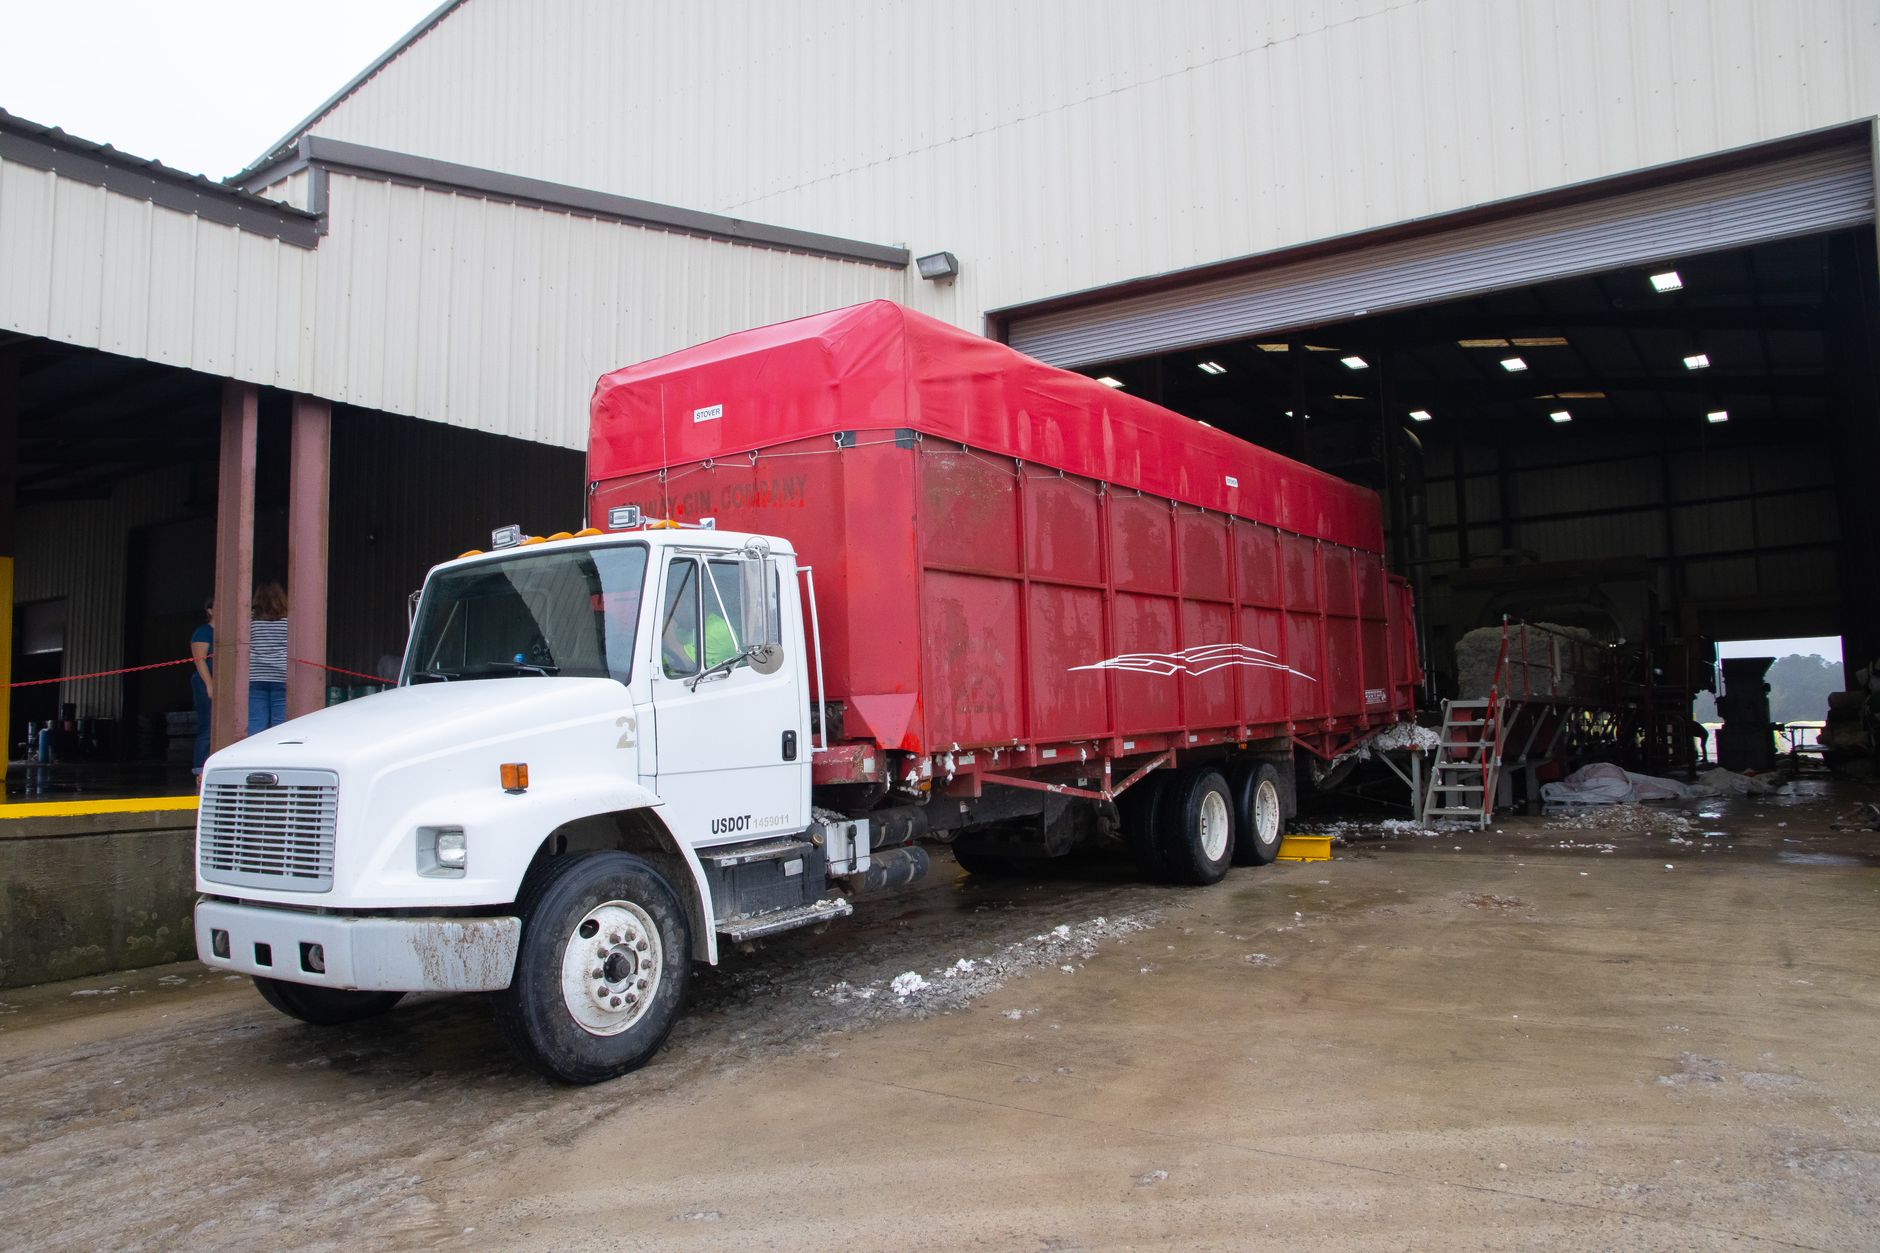
Transport and logistics leading at 117,000 units shows which job type the sample's suppliers reported most. That is useful context for a warehouse team deciding where to look first. It is not a forecast for your building, and it does not show whether a given robot fits your aisles, dock or order profile.
Use the figure to frame the question, then answer the site question with site data: material flows, shift hours, travel distances and staffing gaps. Those inputs move a lease decision, and an industry figure cannot supply them.
How should the figures read in an internal memo?
Name the source, the sample, the period and the measure in one sentence, then say what the figure does not support. Three phrasings do this cleanly:
Avoid phrases such as the market grew 24 percent, robots are taking over the sector, or the sample shows our share. Each one turns a sample finding into a claim the source does not make.
- IFR reported, from a sample of 238 companies, that professional service robot sales rose 24 percent to almost 250,000 units in 2025.
- This is sample data from one IFR edition, so we treat it as directional context rather than a market total.
- Transport and logistics was the largest application in the same sample at 117,000 units, and we have not projected that onto our sites.
Where does a site level number come from?
Board members often ask what sector figures mean for one facility. Sector data cannot answer that. A service robot leasing decision starts with a site assessment, and that is where Service Robot Co. begins. We are an OEM neutral integrator: we select robots across manufacturers, lease them through financing, deploy, integrate and train, then service each unit under RoboCare, backed by regional service engineers in the states we serve.
For a three year lease, the figure for the board packet is the fixed payment quoted after that assessment, with its scope written out. Compare robot lease options on the same site, the same tasks and the same service terms. A lease quote built that way is evidence a board can test, which an industry percentage is not.

What should the board packet check before it goes out?
Confirm the edition year, the reference year, the sample size, and whether the figure counts units or companies. Confirm the professional or consumer scope, and make sure the word sample appears wherever a number appears.
Check that any sub segment figure traces to the 2026 release. In our review we could not verify sub segment figures for cleaning robots, so leave them out until the source page is in hand. A shorter packet with traceable numbers holds up under questions better than a long one that cannot be sourced.
Frequently asked questions
Want a robot working for you?
Tell us the job and the site. We will recommend the robot, quote the lease, and keep it serviced.