Key takeaways
- The US installed 38,400 industrial robots in 2025, up 12%, according to IFR, moving past Japan's 36,200.
- The US now ranks second behind China, which installed about 59% of global demand.
- Food and beverage rose 30% to 2,900 units while automotive dipped 1%.
- A national ranking says little about your line, so task fit should drive the decision.
- As installs climb, service, integration and spare parts capacity becomes the real constraint.
What the 2025 count shows
The US installed 38,400 industrial robots in 2025, according to the International Federation of Robotics (IFR), up 12% year on year. That total put the US ahead of Japan, which installed 36,200, and moved the US into second place behind China in IFR's World Robotics 2026 report, released September 24, 2026.
IFR's June 2026 preliminary release had put US installs at about 38,000 for 2025, up 11%. The September revision moved both figures higher. Some outlets round the US total to about 38,500, but IFR's published figure is 38,400, and that is the number to quote.
Which industries drove the gain?
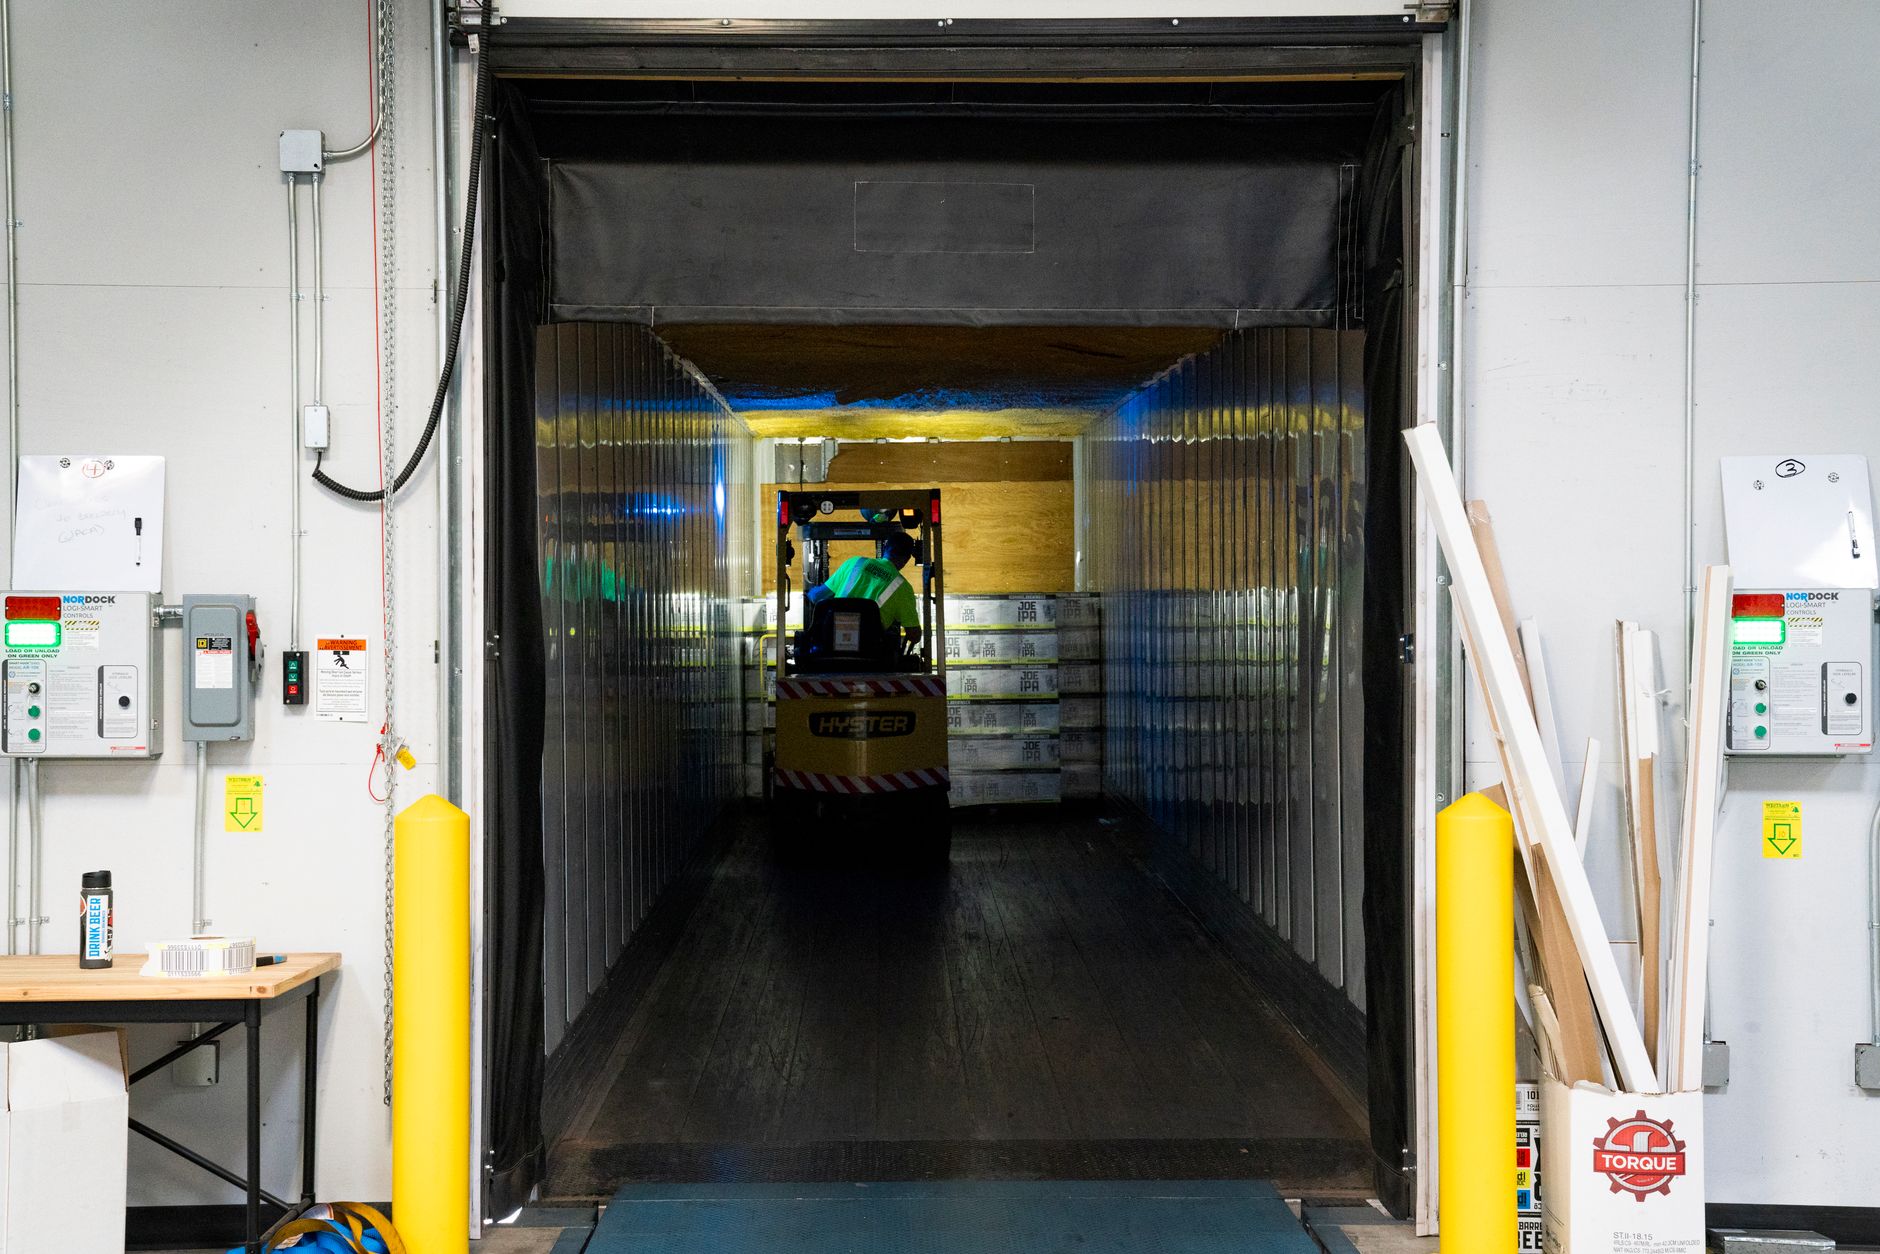
Coverage of the IFR data by Manufacturing Digital points to food and beverage as a clear driver. That segment rose 30% to 2,900 units in 2025. IFR also attributes part of US growth to food, warehousing and logistics, which shifts the picture away from the car-plant story many readers still carry.
Automotive, the largest US customer segment, installed about 13,500 units in 2025, down 1%. A flat automotive line alongside a fast-growing food segment suggests new demand is spreading into plants that never had a robot cell on the books.
How does the US gain look against the global market?
China installed 354,200 units in 2025, about 59% of global demand, according to a report on IFR's data from The Next Web. Global installations rose 11% to about 603,000 units, and IFR forecasts 655,000 for 2026, up 9%, as reported by Australian Manufacturing.
Second place is a real milestone, but it sits inside a market where one country takes about 59% of new units. For a plant anywhere in the US, the more practical reading is the pace: a double-digit gain in one year, with IFR expecting US installations to keep growing in 2026 and beyond. Trade tensions will weigh on demand in the short term, according to Manufacturing Digital.
What a national ranking does not tell your plant
National installs are an average across automotive lines, food packers, warehouses and everything in between. A total cannot say whether a 150-person plant should start with palletizing, machine tending or floor care, or how much cycle time a given cell would recover. Use the 12% as evidence that buyers are moving, then check your own task list.
Most US robots are imported, mainly from Japan and Europe, according to secondary coverage. We could not verify an exact import share, so treat any percentage you see as unconfirmed. Imports matter in practice because spare parts, software updates and trained technicians may sit far from your floor.
Why service and integration capacity become the bottleneck
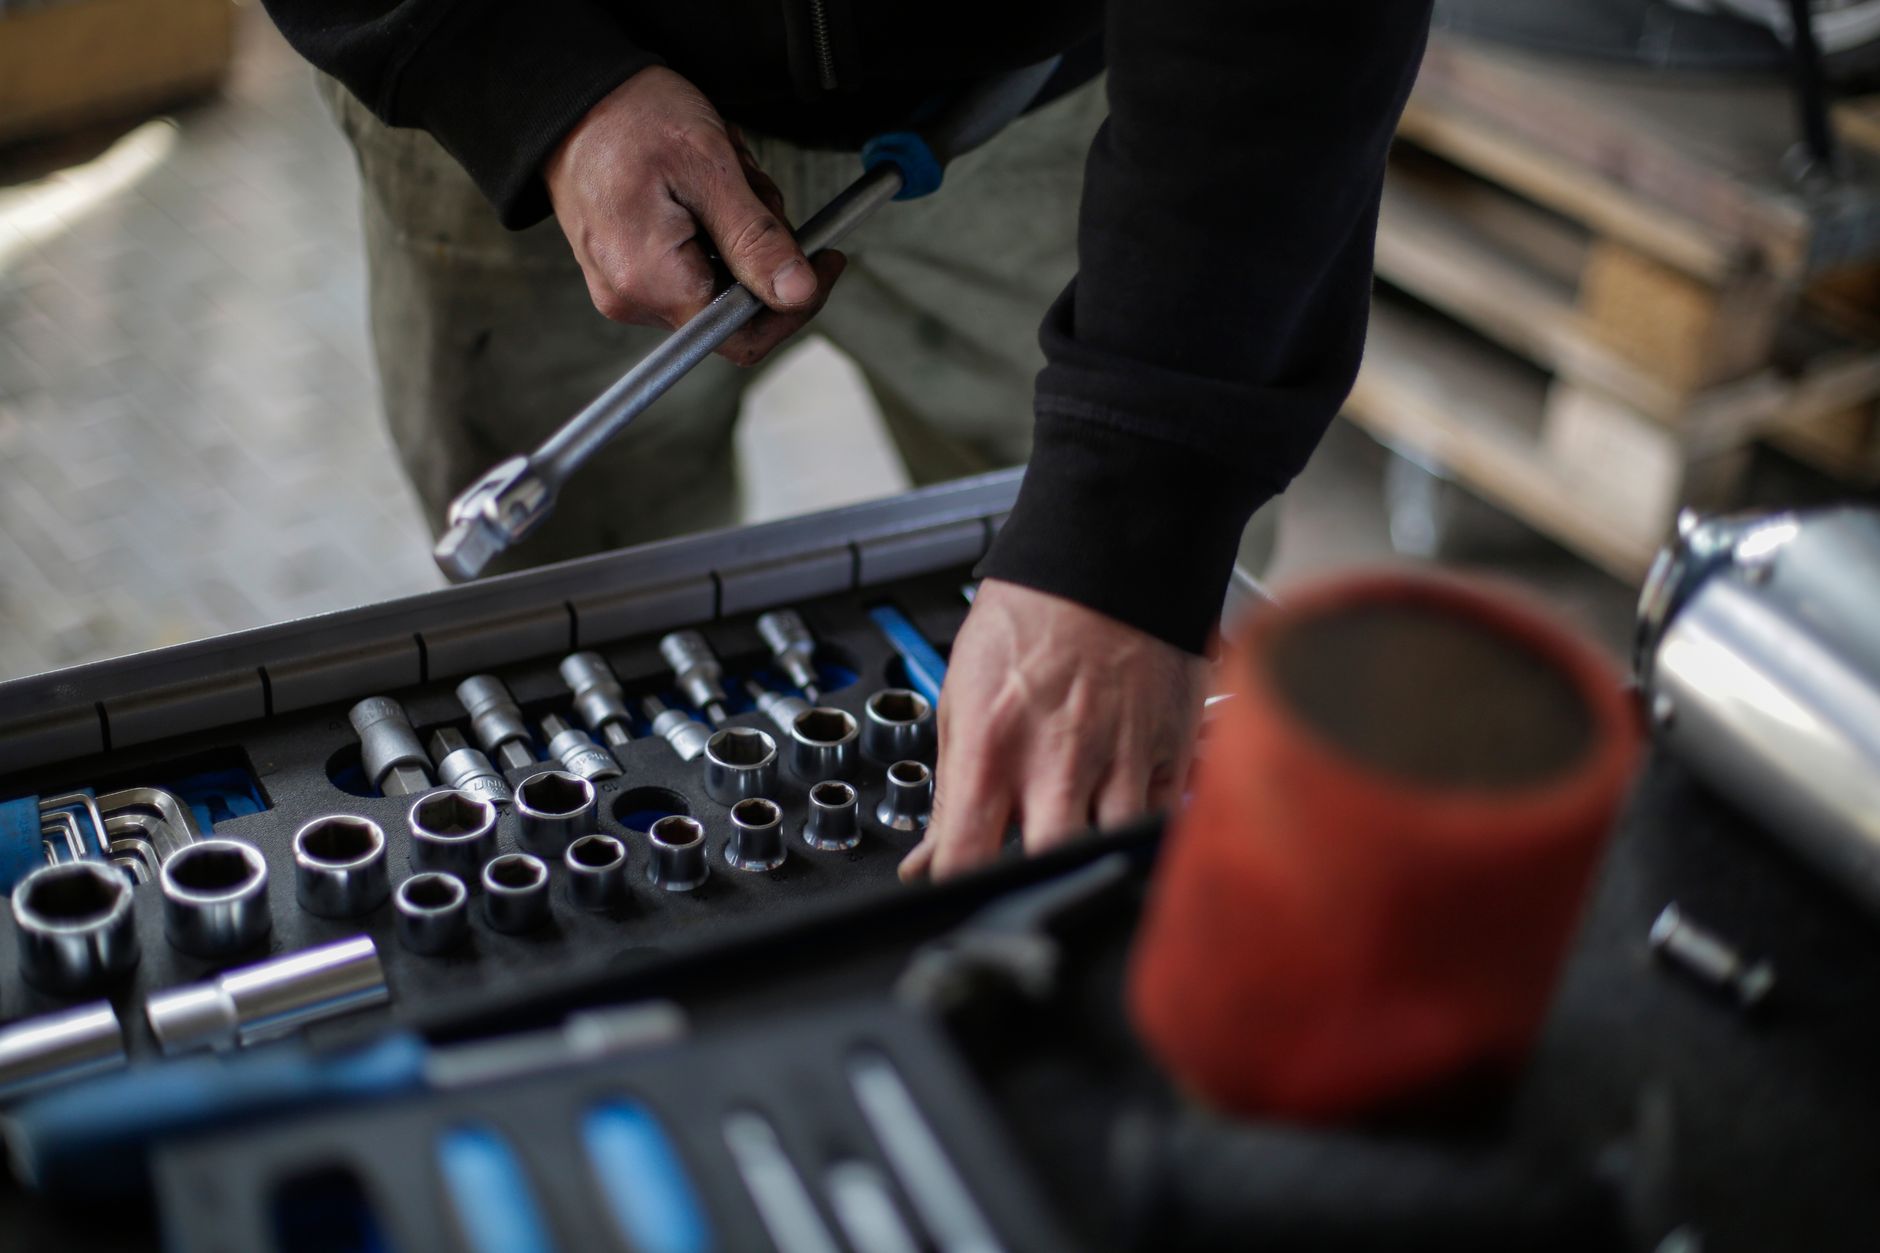
More installs mean more units to commission, integrate, train for and keep running. Each robot needs a route into the plant's systems, staff who can clear a fault without waiting on the factory, and a service contact who answers the phone. As volumes climb, the scarce resource shifts from the machine itself to the people who set it up and keep it running.
This is the gap our business is built around. Service Robot Co. is a full-service commercial robot integrator with an OEM-neutral approach: we select robots across manufacturers, then finance, deploy, integrate, train and service every unit through a nationwide US engineer network. That gives a mid-size plant one partner for the full lifecycle, from the first site visit to the last service call.
Customers lease robots on a 3-year lease, and the fixed lease payment is quoted after a site assessment, so the figure reflects their own floor rather than a catalog average.
Where does your plant sit on the curve?
Before your next budget meeting, sort candidate tasks into three groups: repetitive transport, machine tending and floor care, and inspection. Then ask which group your labor problem actually belongs to. The IFR figures put recent growth in food, warehousing and logistics, so those lines deserve the first look.
- Map each candidate task against its shift, floor area and the staff hours it currently consumes.
- Ask every bidder which service engineer covers your region and what response time they commit to in writing.
- Request a site assessment and a fixed lease payment quote before comparing robots by brand name.
What does a useful first step look like?
A plant that answers those questions honestly will know where it sits, ahead of the curve or behind it. If the answer points toward commercial robot leasing, the next step is a site walk, not a catalog page.
Frequently asked questions
Want a robot working for you?
Tell us the job and the site. We will recommend the robot, quote the lease, and keep it serviced.
Sources
- IFR press release, World Robotics 2026 US results
- Robotics Tomorrow, US now second largest robotics market
- Plastics Today, US overtakes Japan as second largest industrial robot market
- IFR, US robot industry returns to double-digit growth
- Manufacturing Digital, IFR food and logistics pushed US robot automation past Japan
- The Next Web, industrial robots World Robotics 2026 China 59 percent
- Australian Manufacturing, industrial robot installations rise 11 percent
Service Robot Co. is not affiliated with, sponsored by, or endorsed by the companies mentioned in this article.