
Key takeaways
- As of EIA's August 26, 2026 release, U.S. commercial electricity averaged 14.19 cents per kWh in June 2026, up 4.8% from June 2025.
- Charging cost per shift equals battery kWh used, adjusted for charging losses, multiplied by the utility rate, plus any allocated demand charge.
- Demand charges can matter more than energy charges when several robots charge together or a tariff includes ratchets.
- Utilization usually outweighs electricity in robot economics because more productive shifts spread fixed monthly program costs across more work.
- Large fleets should manage charging start times as carefully as routes, uptime, and labor coverage.
How much do higher power prices really change robot economics?
They raise charging cost, but usually not enough to redraw the whole robot business case. In the U.S. Energy Information Administration's July 23, 2026 update, the national average commercial electricity revenue for May 2026 was 13.54 cents per kWh, up 4.7% from May 2025. In EIA's August 26, 2026 release covering June 2026, the national commercial average rose to 14.19 cents per kWh, 4.8% above June 2025.
For most commercial robots, that changes the variable charging line item more than it changes total cost per shift. The heavier drivers are utilization, actual battery kWh used per shift, and whether charging creates a new peak on the building meter. Electricity turns from background noise into a board-level issue when a fleet is large, docks start together, or the tariff leans hard on demand charges.
The right move is to price charging per shift, then split the bill into energy charges and demand charges. That view makes the math honest. It also shows why a busy robot usually absorbs higher power prices better than an underused one.
Start with cost per shift, not cost per month
Monthly utility bills hide the mechanics that operators actually control. A better model follows the battery through the shift, through the charger, and onto the meter. Start with the battery kWh consumed in the shift, not with the robot's nameplate alone.
If a shift uses only part of a pack, count only that fraction. If one recharge supports more than one shift, spread the recharge across those shifts. Cost per shift becomes much cleaner when every variable is tied to actual battery use and actual charging behavior.
- Battery kWh used per shift = nameplate battery capacity x average depth of discharge used in the shift x charge cycles consumed by that shift.
- Energy cost per shift = battery kWh used per shift divided by wall-to-output efficiency x blended energy rate.
- Demand cost per shift = incremental peak kW created by charging x demand charge rate, divided by the monthly shifts served by that charging group.
- Total charging cost per shift = energy cost + demand cost + any measured standby losses.
What does one useful battery kilowatt-hour really cost at the wall?
Charging losses are easy to dismiss because each one looks small in isolation. They still belong in the model. The Department of Energy's procurement guidance for charging equipment uses on-mode efficiency benchmarks of 97%, 93%, and 90%, and the EPA's MOVES4 technical work uses 94% charging efficiency and 95% battery efficiency for new electric vehicles, which combines to 89.3% wall-to-output efficiency.
At the June 2026 national commercial average of 14.19 cents per kWh, each useful battery kWh costs about 14.6 cents at 97% charging efficiency, 15.3 cents at 93%, and 15.8 cents at 90%. Using the EPA's 89.3% wall-to-output benchmark, the cost is about 15.9 cents per useful battery kWh. The tariff says one thing, but the battery sees a slightly higher number.
Location widens the spread more than charger losses do. In the EIA July 23, 2026 update, contiguous-state commercial averages for May 2026 ranged from 8.07 cents per kWh in New Mexico to 26.71 cents in Rhode Island. Using the same 89.3% wall-to-output benchmark, that works out to roughly 9.0 cents to 29.9 cents per useful battery kWh before any demand charge is added.
Why demand charges deserve their own line on the spreadsheet
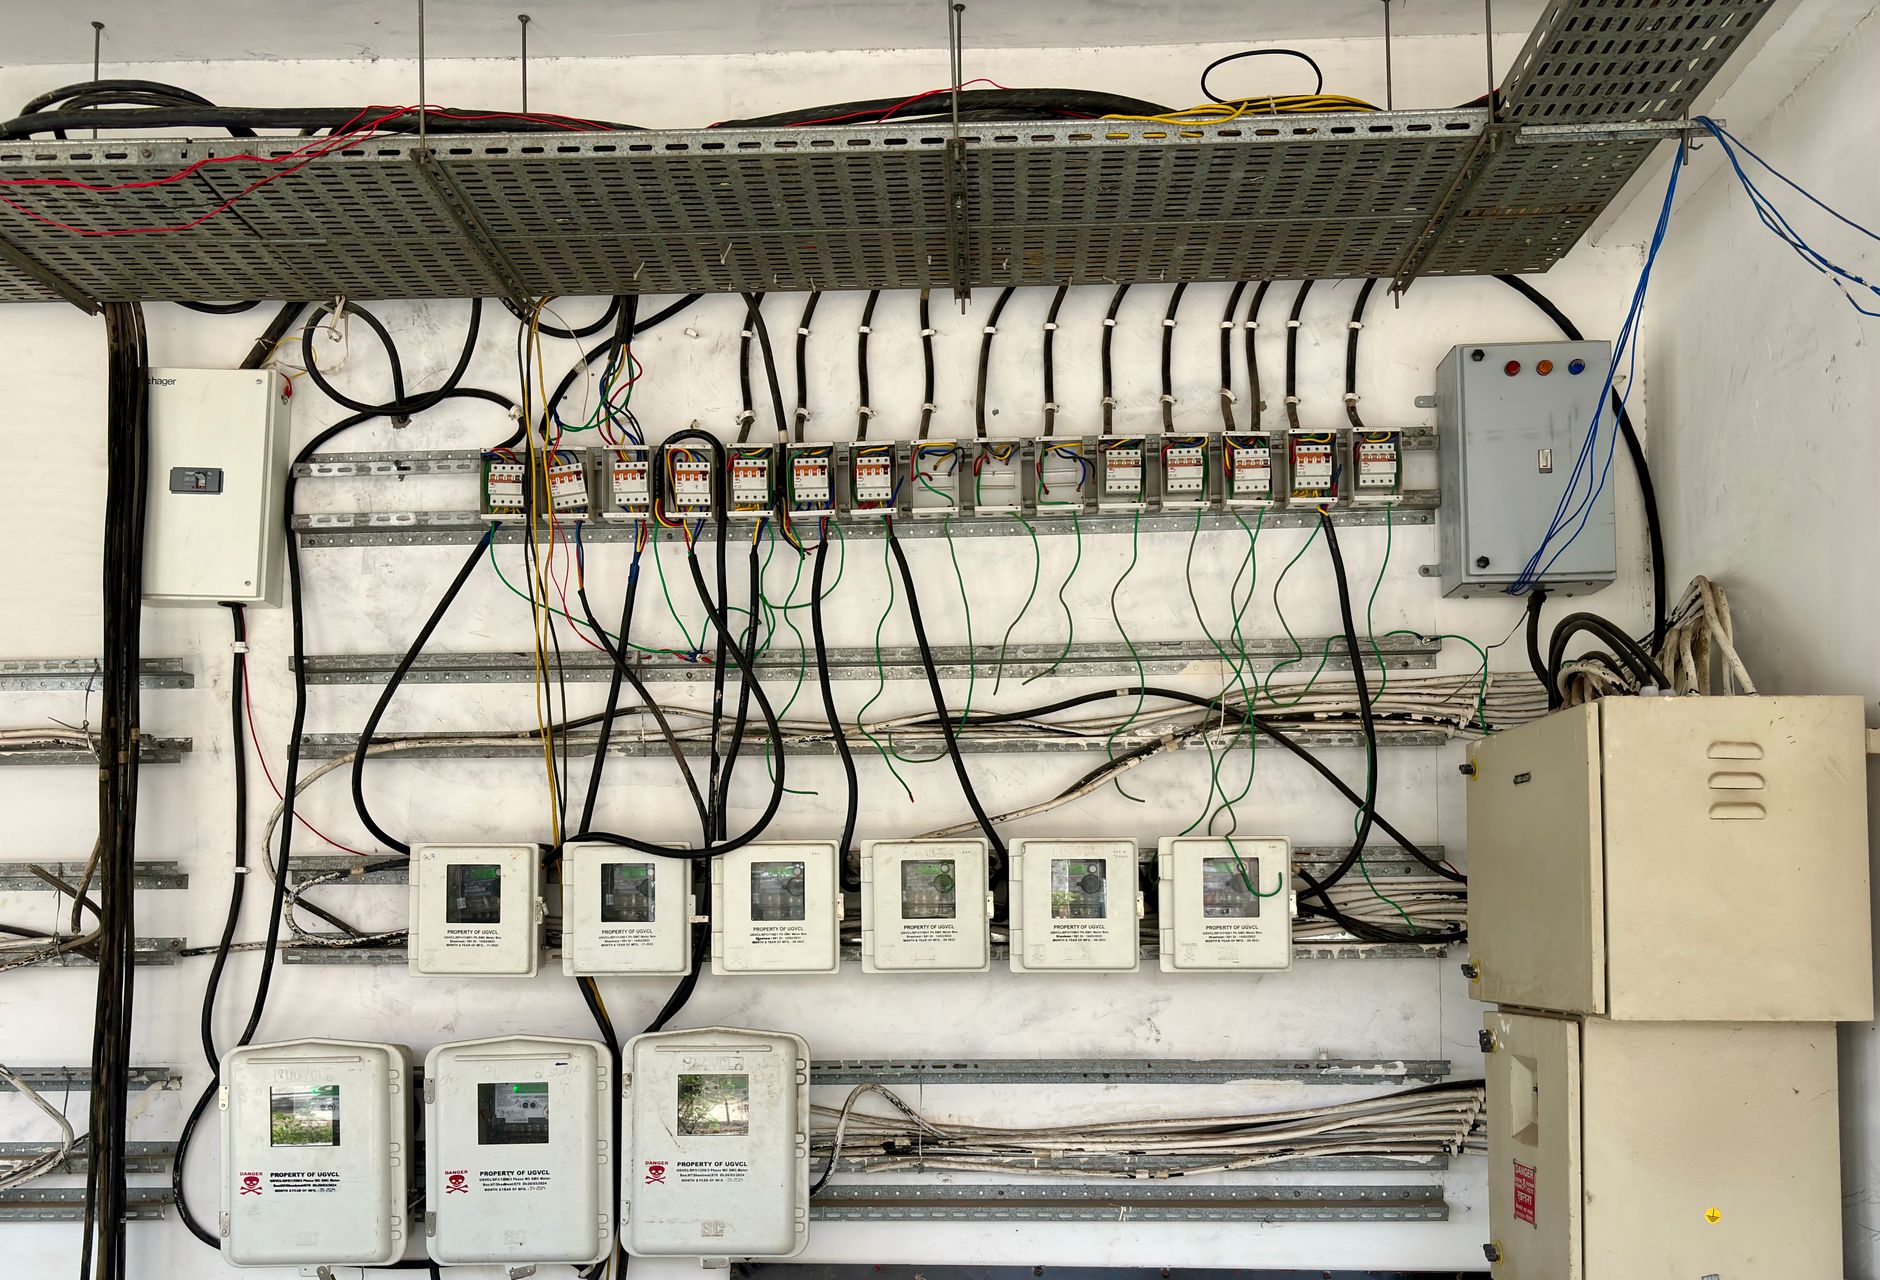
Demand charges deserve their own column because they are billed on power, not on energy. The Department of Energy defines them as charges based on maximum demand in kilowatts during a billing period, typically each month. One short charging pileup can therefore outweigh days of careful kWh conservation.
The same DOE guidance notes that some tariffs also use time-of-use demand charges, non-coincident demand charges, and look-back ratchets that can keep an old spike alive for months. That is why operators should care about when chargers start, not only how much electricity they consume by month end.
NREL's charging cost benchmarks make the point numerically. In its 2022 transportation assumptions, a lower-demand-charge depot case added the equivalent of 3 cents per kWh, a higher-demand-charge case added 10 cents per kWh, and a managed charging case pushed the demand-charge effect toward negligible. A robot fleet may not match those exact cases, but the lesson carries over cleanly. Scheduling can matter as much as the tariff.
Why utilization usually outweighs electricity
This is where utilization takes the lead. Most robot programs carry fixed monthly costs outside the utility bill, including the unit, software, service coverage, and support. If those non-energy costs equal F per robot-month and the robot completes S productive shifts, that slice of cost per shift is F divided by S.
Raise S and the fixed slice falls immediately. Double productive shifts, and every fixed monthly line item is cut in half on a per-shift basis. Electricity does not behave that way. It rises or falls with battery kWh used, charging efficiency, and the tariff, so it usually remains the smaller lever unless the fleet is large or the charging pattern is sloppy.
That is why power prices deserve attention without becoming the whole story. Even at June 2026's 14.19 cent national commercial average, the EPA-style 89.3% wall-to-output benchmark produces a charging cost of 15.9 cents per useful battery kWh. Real, yes. Dominant, usually no.
- Tariff sensitivity: moving from 13.54 to 14.19 cents per kWh raises the 89.3% wall-to-output cost from 15.2 cents to 15.9 cents per useful battery kWh.
- Efficiency sensitivity: at 13.54 cents per kWh, moving from 97% to 90% charging efficiency changes cost from 14.0 cents to 15.0 cents per useful battery kWh.
- Demand sensitivity: NREL's benchmark cases add about 3 cents to 10 cents per kWh equivalent when demand charges bite, and near zero when charging is managed.
- Utilization sensitivity: doubling productive shifts cuts every fixed monthly cost line in half per shift, while the energy line remains proportional to battery kWh used.
Where bigger fleets start to feel the squeeze
Single robots rarely bend a commercial meter very far. Fleets do. The risk grows in buildings where many units finish work on the same clock, return to the dock at the same time, or share a charging room with HVAC, refrigeration, kitchen loads, or other equipment that already drives monthly peaks.
Summer afternoons are especially unforgiving because some tariffs place higher demand charges inside specific peak windows, and look-back rules can preserve a bad day long after it is over. A fleet that seems cheap on an average cents-per-kWh basis can become expensive because of one badly timed charging wave.
The good news is that these are operating questions, not mysteries. Once charging is sequenced against the building load, many fleets move back into ordinary utility territory.
- Simultaneous dock returns after a common shift end
- Fast or high-power charging during on-peak tariff hours
- Shared meters that are already close to their monthly maximum demand
- Tariffs with demand ratchets or separate time-of-use demand windows
How a full-service integrator changes the charging math
This is where a commercial robot integrator should earn its fee. Service Robot Co. is an OEM-neutral partner for U.S. businesses, so the job is not to force one manufacturer's charging pattern onto every site. The job is to choose the right robots, then line up battery size, charger timing, route cadence, and site power reality before go-live.
That matters in every commercial robot lease, robot leasing for business program, and monthly lease because the charging bill never lives in isolation. It sits beside financing, service, uptime, training, and labor coverage. Service Robot Co. can finance, deploy, integrate, train, and service each unit, with RoboCare™ service, remote triage, and on-site dispatch through a nationwide U.S. engineer network, which makes it easier to compare lease and sale models against the same per-shift energy math.
For operators, the benefit is simple. One vendor can own the battery, building, and operations conversation at the same time. That is often the difference between a neat spreadsheet and a fleet that actually behaves the way the spreadsheet promised.
What should be on the monthly dashboard
The DOE energy data guide recommends tracking consumption, demand charges, and total cost per meter for every billing cycle. Robot operators should extend that dashboard with battery kWh delivered per shift, productive shifts per robot, and the number of simultaneous charging sessions that occurred during the billing period peak.
Those few fields answer the question executives actually care about. Did cost per shift rise because power got more expensive, because charging collided with the building peak, or because the robots simply were not used enough? Without that separation, energy prices get blamed for underutilization and poor scheduling.
Rising power prices are real, and they deserve a place in every fleet review. Panic is not the useful response. Meter-aware scheduling, clean utilization data, and disciplined per-shift costing usually keep charging where it belongs: an operating input, not the fate of the program.