
The short answer
Autonomous forklift ROI in Charlotte comes from the repeat pallet and freight moves that laborers and freight, stock, and material movers, hand work takes up on a site, measured as hours per shift against a fixed lease payment. The Bureau of Labor Statistics counted about 42,880 people in that job in the Charlotte metro in May 2023, but a site's savings depend on how many of its own hours a robot can realistically take on mapped lanes. The lease payment is quoted only after a free site assessment, which measures those hours and turns the calculator range into a figure for your building.
Key takeaways
- The return comes from repeat, mapped moves that laborers and freight, stock, and material movers, hand work takes up, not from a headcount cut.
- Payback depends on the share of your own hours the robot realistically takes, so measure those hours before trusting any range.
- Charlotte has a deep labor pool for this job, with about 42,880 people employed in it in May 2023 according to the Bureau of Labor Statistics.
- Forklift work carries real injury exposure, so moving repeat lanes off people is a second reason to run the numbers.
- The lease payment is quoted after a free site assessment, which replaces estimates with your own shift and dock data.
Run the numbers for your site
Auto-detected from your location - we use the real BLS wage here. Not right? Pick your city or state above.
What do you want to automate?
The robot takes the repetitive cart and pallet moves off the heaviest motion.
Autonomous forklift ROI in Charlotte: what return can a business expect?
The return on an autonomous forklift in Charlotte, NC comes from a narrow kind of work: repeat pallet and freight moves on set lanes that a laborers and freight, stock, and material movers, hand worker would otherwise do by hand or on a powered truck. Those hours are the labor offset. The other side of the math is the fixed lease payment, which is quoted only after a site assessment, because the right unit, the lanes and the service plan all depend on the building.
For most sites the return is not a headcount cut. It is the transfer of hours from repeat transport onto exception handling, receiving checks and the work that needs a person. A building that runs the same lanes every night will see a clearer offset than one with irregular inbound loads, which is why the calculator asks about lanes and shifts before it shows any range.
Charlotte has a large base of this work, so the useful question is less whether the work exists and more how much of it sits on lanes a robot can run cleanly. Answering that is the job of the site assessment. The sections below explain how the numbers fit together and where they can go wrong.
How big is the labor pool for this work in Charlotte?
According to the Bureau of Labor Statistics, the Charlotte metro had about 42,880 people employed as laborers and freight, stock, and material movers, hand in May 2023. The May 2023 BLS release also showed a location quotient of 1.7 for that job. A location quotient above 1 means the metro holds more of this work than the national average would predict.
The BLS Charlotte release for May 2024 reported that transportation and material moving made up 10.8 percent of local employment. That share is context rather than a forecast for your site, but it shows how much of the metro workforce is tied to moving goods. Use it to judge whether your location sits in a freight-heavy part of the market, and check lane counts and shift patterns first.
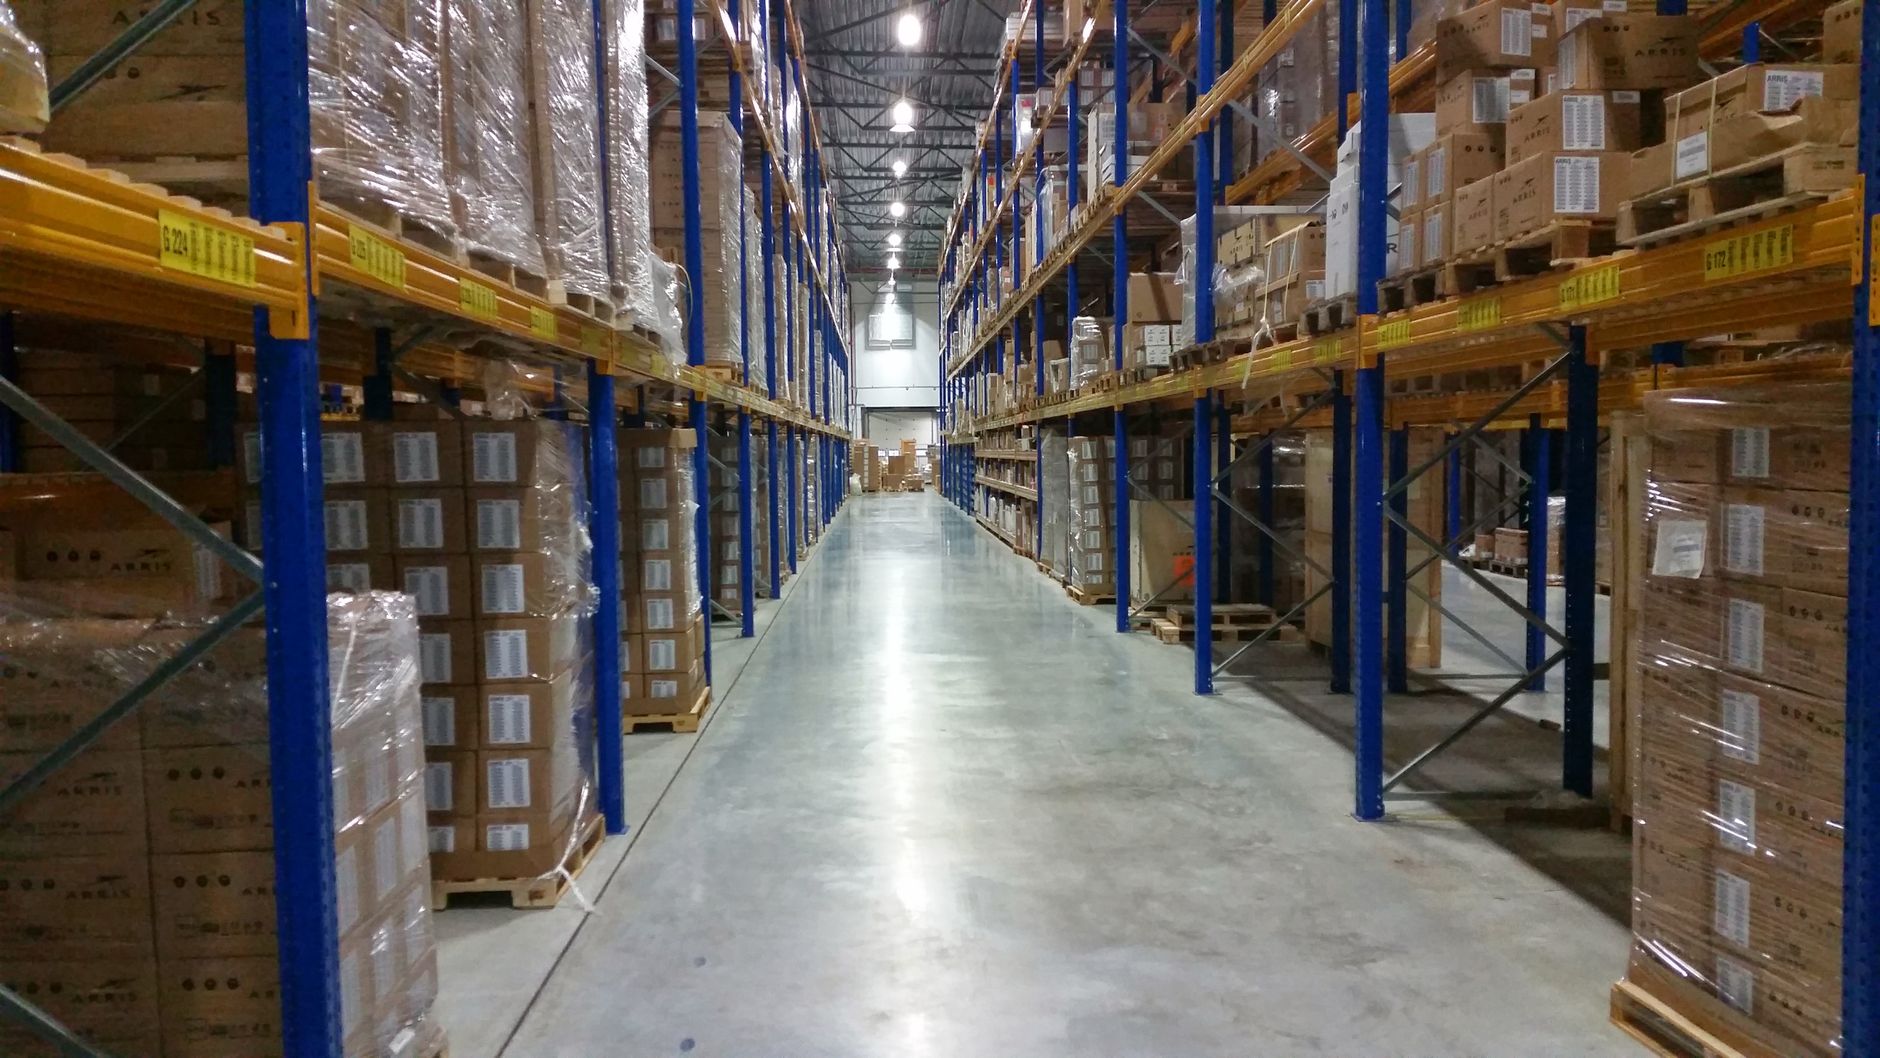
The government wage data panel on this page shows the local wage for this job, and the labor side of the calculator uses that wage. Hours of this work are what the robot takes over, so the wage sets the value of each hour and the hours set the offset. Read the two together, and do not treat the wage as a saving on its own.
Median hourly wage, Laborers and Freight, Stock, and Material Movers, Hand
$4,130
Monthly cost of one full-time worker in Charlotte, NC, at the median wage plus payroll costs (an estimate, not a quote).
How does the autonomous forklift ROI math work?
The basic calculation has three inputs. The first is the hours per shift that laborers and freight, stock, and material movers, hand work takes up on lanes the robot can run. The second is the share of those hours the robot realistically takes, which is almost never all of them. The third is the fixed lease payment, quoted after assessment and set against the value of the hours taken over.
A simple version runs like this. Take the hours on mapped lanes, multiply by the local wage for the job from the government data panel, then multiply by the shifts the unit will actually run in a year. That gives a gross offset. Subtract the lease payment, the staff time to supervise and clear exceptions, and any extra route setup. What remains is the return, shown as a range because the share of hours is uncertain until the site is mapped.
Two points keep the math honest. Hours that are not on a mapped repeat lane do not count toward the offset, even if a person does them. A unit that runs one day shift will show far fewer hours per year than one running two or three shifts, so shift count changes the arithmetic as much as the robot does.
What moves autonomous forklift payback up or down?
The number moves most with the share of hours on repeat, mapped lanes. Long, consistent runs gain the most. Sites where every load is a one-off gain less, because the robot stops more often and people still handle the work. Shift count matters too, since utilization decides how quickly the lease is covered.
Layout and floor condition come next. Clear aisles, consistent pallet sizes, wide enough routes and few blind corners let the robot run more of the day. Ramps, uneven floors, mixed-height racking and frequent layout changes shrink the share the robot can take, and each one needs a plan before the quote is final.
Staffing and service also move the result. A site with a stable team that understands the robot's stops and alerts loses less time on exceptions. A site that treats the robot as a replacement for supervision may find the offset disappears under handling time. The checklist below lists what to confirm before you trust the range.
Why do injury rates belong in the case for an autonomous forklift?
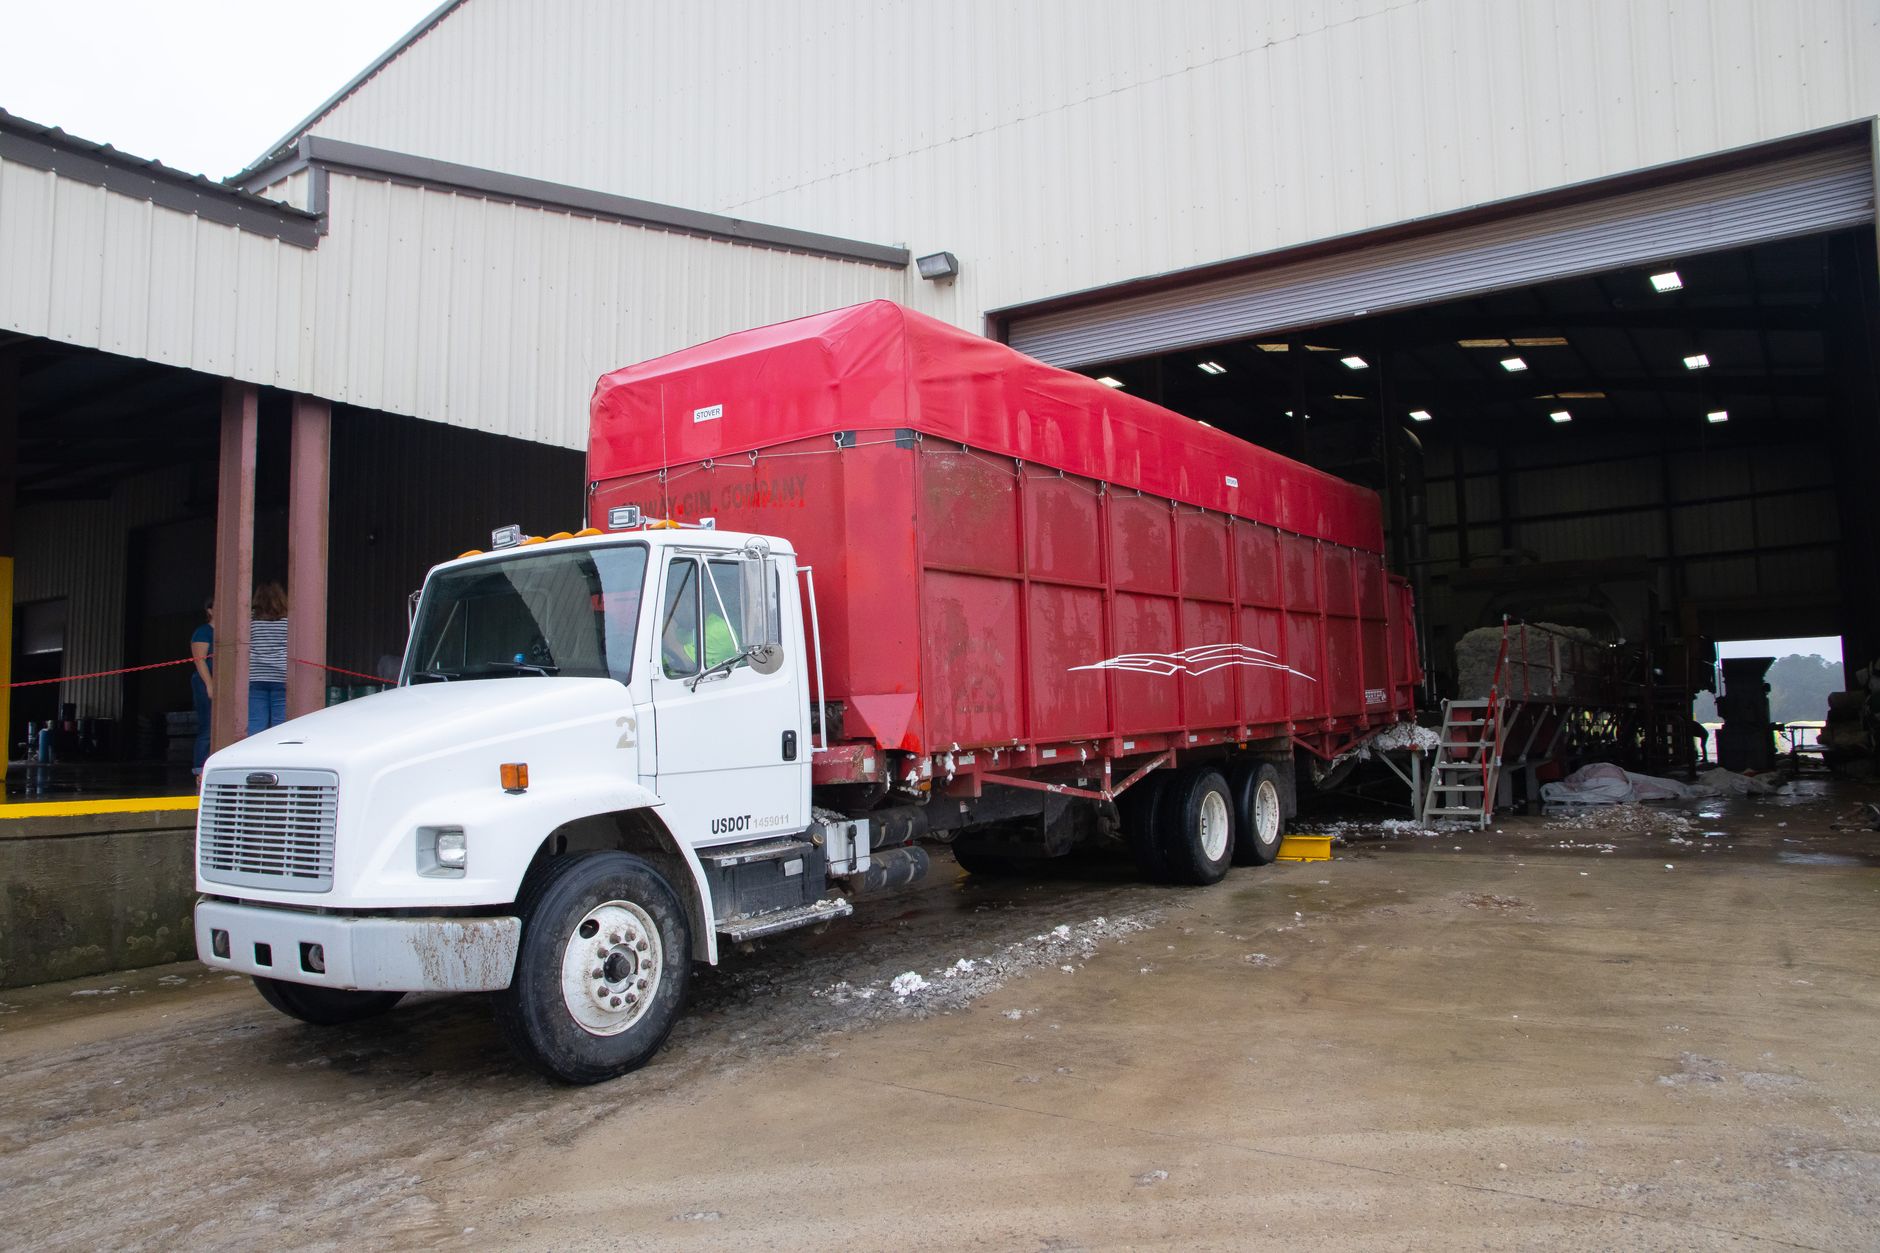
According to DC Velocity, citing Bureau of Labor Statistics data, transportation and warehousing reported 4.5 injuries per 100 full-time workers in 2023, ranking first of 19 industries. That is an industry average, so an individual site may sit above or below it, but it gives a baseline for the exposure this work carries. Treat it as context for the safety case, not as a measure of your building.
The OSHA Region I directive for fiscal 2017 estimated about 85 forklift fatalities and 34,900 serious injuries per year. It also stated that 42 percent of forklift fatalities involving operators were crushed when the vehicle tipped. These are older estimates, and their counting rules differ from later BLS counts, so read them as direction rather than a recent baseline.
Injury cost is not part of the offset calculation on this page. Treat it as a separate case. Fewer people on repeat lanes means less exposure on those lanes, and the site's insurer and safety lead may weigh that separately from the labor math.
How do turnover and staffing gaps change payback?
Turnover varies widely across warehouse employers. Instawork's 2025 State of Warehouse Labor Report, a vendor publication, found that most respondents reported annual turnover under 10 percent, and a notable share reported 20 percent or more. Treat that as a survey of one vendor's respondents, and pull your own two-year turnover count from HR records before you set the baseline.
Each departure brings a period when a new hire is slower than an experienced one, and that lost output belongs on the labor side of the math. A high-turnover site often gets the most value from the robot on its busiest lanes, because a steady, repeatable move holds up while staff are being replaced. The offset is still measured in hours, not in heads.
For planning, this page assumes about four people do this work at one site, an estimate and not a published count. Your own roster and shift schedule replace that assumption, so the site assessment asks for both before it sets the baseline.
- Repeat lanes on a fixed route
Autonomous Forklift
Runs the same mapped route every shift without fatigue
Staff
Adjusts quickly when a lane is blocked or a load looks wrong
- Night coverage
Autonomous Forklift
Runs unattended after mapping, with stops and alerts
Staff
Needed for exceptions, handovers and anything off the map
- Irregular loads
Autonomous Forklift
Stops and alerts when a load does not match the plan
Staff
Handles unusual shapes, damage and mis-staged pallets
- Turnover and onboarding
Autonomous Forklift
No hiring cycle, but needs remapping when the layout changes
Staff
Hiring, training and a ramp-up period for each new worker
- One-off unplanned moves
Autonomous Forklift
Slower to start a move that was not in the plan
Staff
Faster on a one-off move, with no route setup
What are the risks to the return, and how do you avoid them?
The most common risk is overcounting hours. A site that treats every move as robot work will overstate the offset. Count only mapped, repeat lanes, and check them against a typical week of dock logs before the number goes into any internal case.
Layout drift is the second. Changes to racking, staging or dock doors can invalidate a route and cut the share of hours the robot takes. Plan for remapping and budget staff time for it, so a layout change does not quietly erase the offset.
The third risk is an idle unit. A unit that sits through slow shifts or light weeks earns less than the plan assumed. Start with one leased unit on the busiest lane, measure it for several weeks, and widen only when the hours hold up. A spare unit plan and remote triage reduce the cost of downtime if a unit goes down during a busy shift.
What is a realistic timeline from site assessment to payback?
Assessment comes first. A site visit maps routes, measures the hours on target lanes and sets the lease quote. The quote follows the assessment rather than preceding it, so it reflects the actual floor. Expect the visit to take as long as walking the lanes and reviewing a representative set of dock logs and shift records requires.
Deployment follows. Integration, route setup and staff training fit the schedule the site allows, and a phased start on one lane keeps the rest of the operation running without a shutdown. Go-live support covers the first shifts, when the crew is learning the robot's stops and alerts and the route is being tuned.
Payback is measured from steady operation, not from day one. Track hours on the robot lanes for several weeks, compare them with the assessment baseline, and confirm the offset before adding units. The payback date depends on those measured hours, so the calculator range is a starting point, not a commitment.
How do you get a precise figure from a free site assessment?
Ask for the free site assessment and bring your shift schedule, a typical week of dock logs, and a rough layout of the aisles, docks and ramps. The assessment maps the lanes the robot can run, measures the hours on those lanes and produces a lease quote with a narrower savings range than the calculator shows.
Our team picks the right robot for the site, arranges the lease through financing, deploys and integrates the unit, trains your staff and services it nationwide. Ask what the quote includes: maintenance, on-site dispatch, remote triage, and whether spare unit coverage is part of the plan. A quote with clear service terms is easier to compare with other options.
The range on this page stays a range until the assessment confirms the share of hours. Once the lanes and shifts are measured, the figure becomes specific to your building, and that is the number to put in front of the decision maker.
Frequently asked questions
Put a robot to work in Charlotte.
We walk your site, learn the job, and recommend the unit that fits. Then we quote the lease, deploy it, and keep it serviced.
Sources
- US Bureau of Labor Statistics, Occupational Employment and Wage Statistics (OEWS May 2024)
- Bureau of Labor Statistics, Charlotte metro occupational employment and wages, May 2024
- Bureau of Labor Statistics, Charlotte metro occupational employment and wages, May 2023
- DC Velocity, transportation and warehousing injury rankings citing Bureau of Labor Statistics
- OSHA Region I forklift directive, fiscal 2017
- Instawork 2025 State of Warehouse Labor Report (vendor publication)