
The short answer
Autonomous mobile robot ROI for car dealerships comes from having a robot take repeat parts and tote moves between receiving, parts storage and service bays, priced on the hours of laborers and freight, stock, and material movers, hand work it takes over. The return is a range rather than a promise, and it rises with move volume and route repeatability and falls with exception-heavy work and a higher lease payment. A free site assessment measures your move hours and produces a fixed robot lease payment quote, so you can test the range against your own numbers.
Key takeaways
- Parts and tote legs between receiving, storage and service bays are the repeat work that fixed routes suit.
- The savings range prices only the hours of laborers and freight, stock, and material movers, hand work the robot takes over.
- Move volume, route repeatability and the share of exceptions move the number more than anything else.
- No dealership-specific hours or adoption figure was verified, so the site assessment measures your own hours.
- Payback follows pilot results, and the fixed lease payment is quoted only after a free site assessment.
Run the numbers for your site
Pick your city or state for a real regional number - we use the real BLS wage there. (On the live site this auto-detects from your location.)
What do you want to automate?
The robot takes the repetitive cart and pallet moves off the heaviest motion.
What is autonomous mobile robot ROI for car dealerships?
Autonomous mobile robot ROI for car dealerships is the return a dealership gets when a robot carries parts totes and stock along fixed internal routes, measured against the labor hours that work used to take and the fixed lease payment for the robot. The result is a range. It moves with how often parts travel, how repeatable the routes are and how much of the work still needs a person.
This page covers where that return comes from in a dealership, what published data says about the people and sites involved, how the savings range is worked out, and where the risks sit. The ROI calculator on this page is pre-filled for this industry. Treat the range it shows as a starting point for a site assessment, not a finished answer.
Where does the return come from in parts and service?
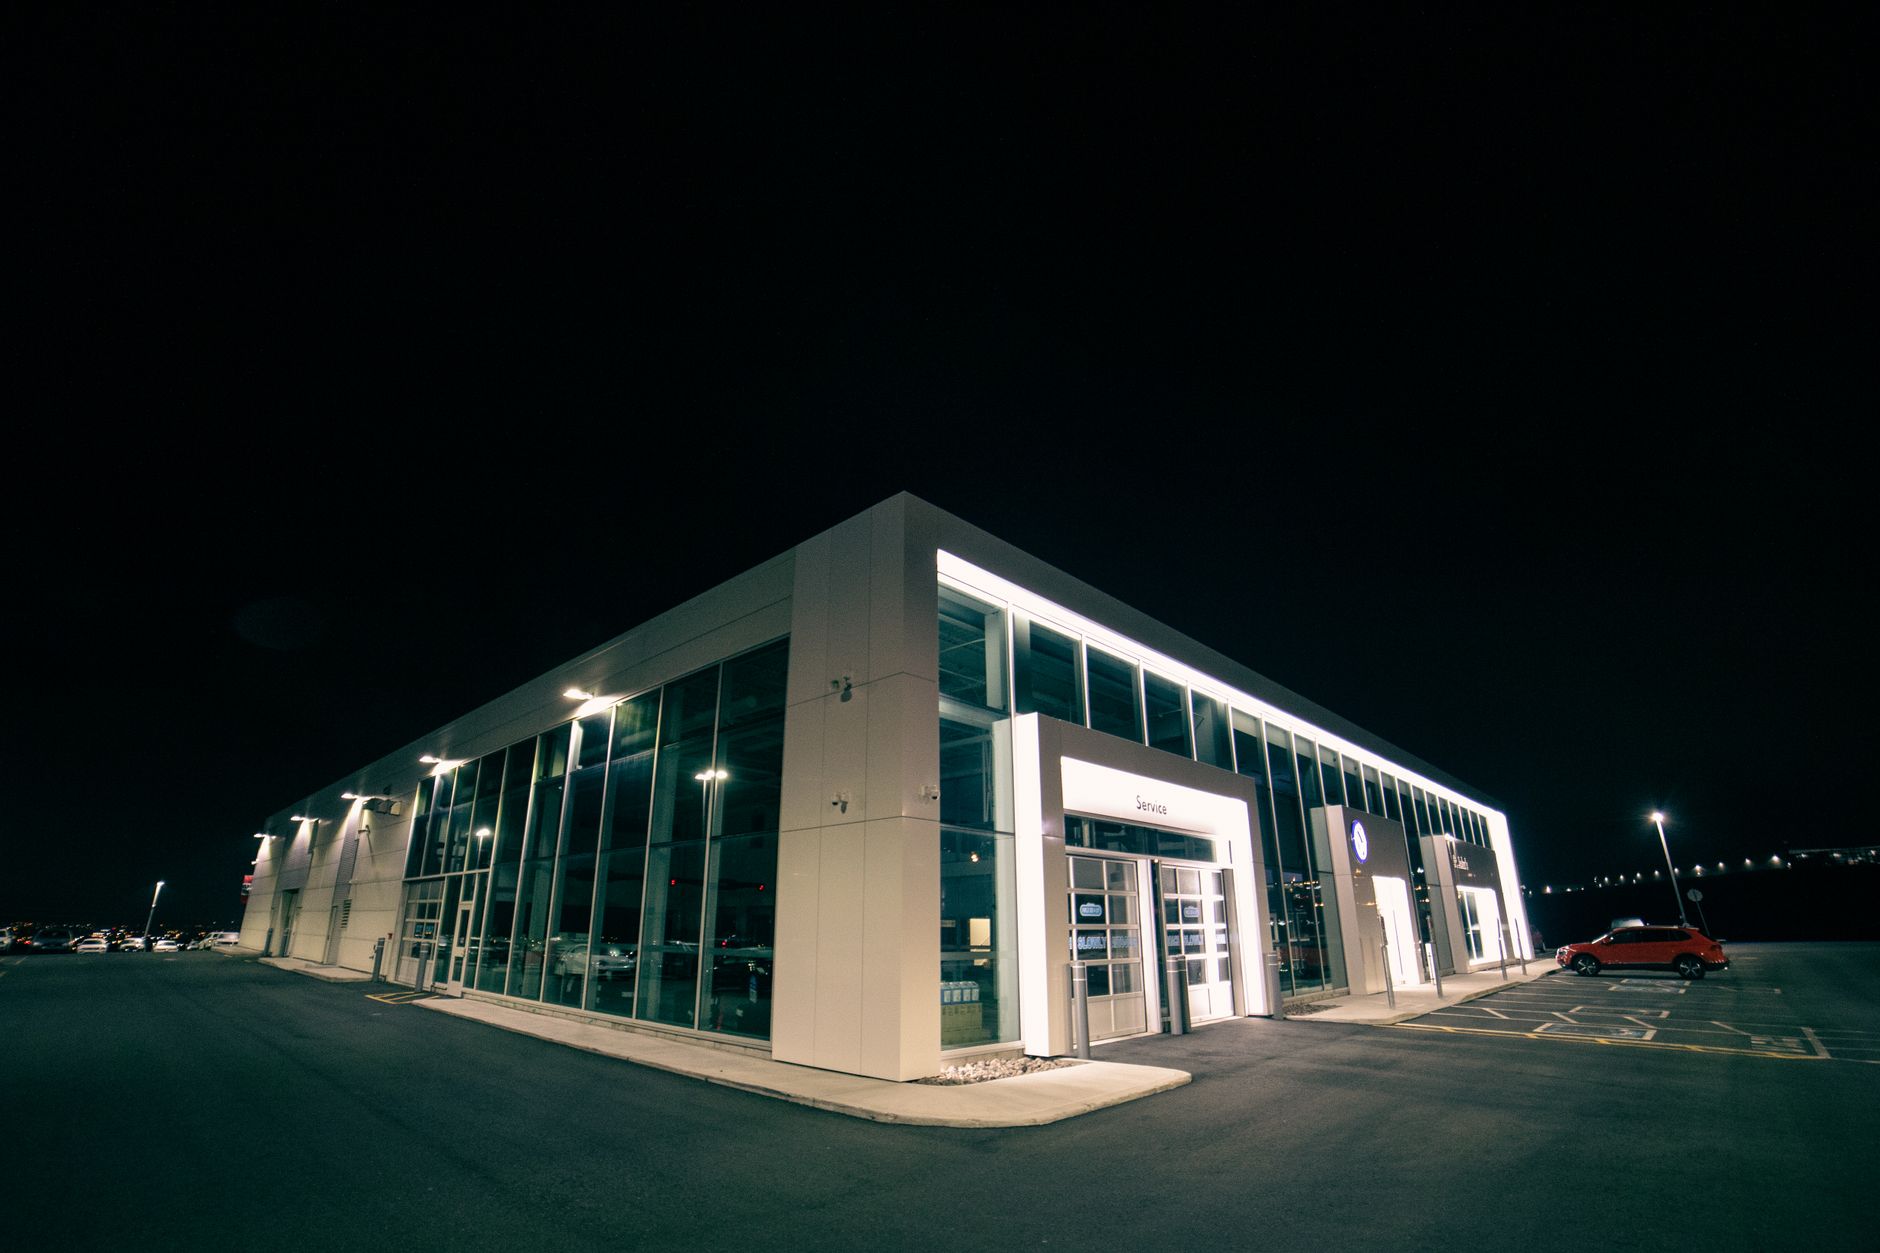
A dealership moves parts in a loop. Parts arrive at a receiving dock, go into parts storage, then travel to service bays, and some return to staging when a job changes or a part comes back. Much of that movement follows the same paths every day, which is why an autonomous mobile robot suits it. The robot repeats a mapped route and stops at set points.
The return comes from three places. The first is staff time spent on the legs of that loop, which is the measurable part. The second is technicians and advisors waiting on a part to reach a bay. The third is slower bay turnaround when a part run is held up by other work. The first can be priced directly. The other two should be counted only if the dealership tracks them.
Parts counter staff and service advisors are not usually laborers, so the robot takes the laborers and freight, stock, and material movers, hand type of work off their plate. Their time is not priced in this model. The hours that are priced are the hours of that moving work.
Median hourly wage, Laborers and Freight, Stock, and Material Movers, Hand
$4,380
Monthly cost of one full-time worker, at the median wage plus payroll costs (an estimate, not a quote).
- Repeat legs on a fixed route
Autonomous Mobile Robot
Runs the same path every time without breaks
Staff
Can do it, but gets pulled to other work
- Off-hours moves
Autonomous Mobile Robot
Can run on a set schedule once routes are mapped
Staff
Needs a shift and an overtime decision
- Special orders and oversized loads
Autonomous Mobile Robot
Not the right tool
Staff
Handles them with judgment and lifting
- Unexpected blockages
Autonomous Mobile Robot
Stops and alerts, then needs a fix
Staff
Routes around the problem
- One urgent part for one bay
Autonomous Mobile Robot
Slower to set up than a person walking it over
Staff
Faster for a single trip
- Consistency across weeks
Autonomous Mobile Robot
Same path and pace each day
Staff
Varies with fatigue and staffing
How many dealerships and workers are in scope?
According to NADA's 2026 midyear report, as reported by Auto Body News, there are 16,991 franchised dealers nationwide. Each has a receiving area, a parts operation and a service department, so the count describes how many sites share this flow of parts.
NADA's 2025 midyear report, as reported by CBT News, puts total employment at U.S. franchised dealerships at 1.13 million in 2024, the highest since 2019. Dividing that by the dealer count gives roughly 67 employees per dealership. That is our own average, built from figures for different years and sources, not a published per-store number, and it covers every role, not only the people who move parts.
The Bureau of Labor Statistics reports that automotive service technicians and mechanics held about 805,600 jobs in 2024, and that automobile dealers were the largest employer group for that work at 32%. Floor area is harder to pin down. Projects vary widely from one dealership to the next, and we did not find an authoritative typical figure, so the assessment measures your own floor.
How do labor hours offset the lease cost?
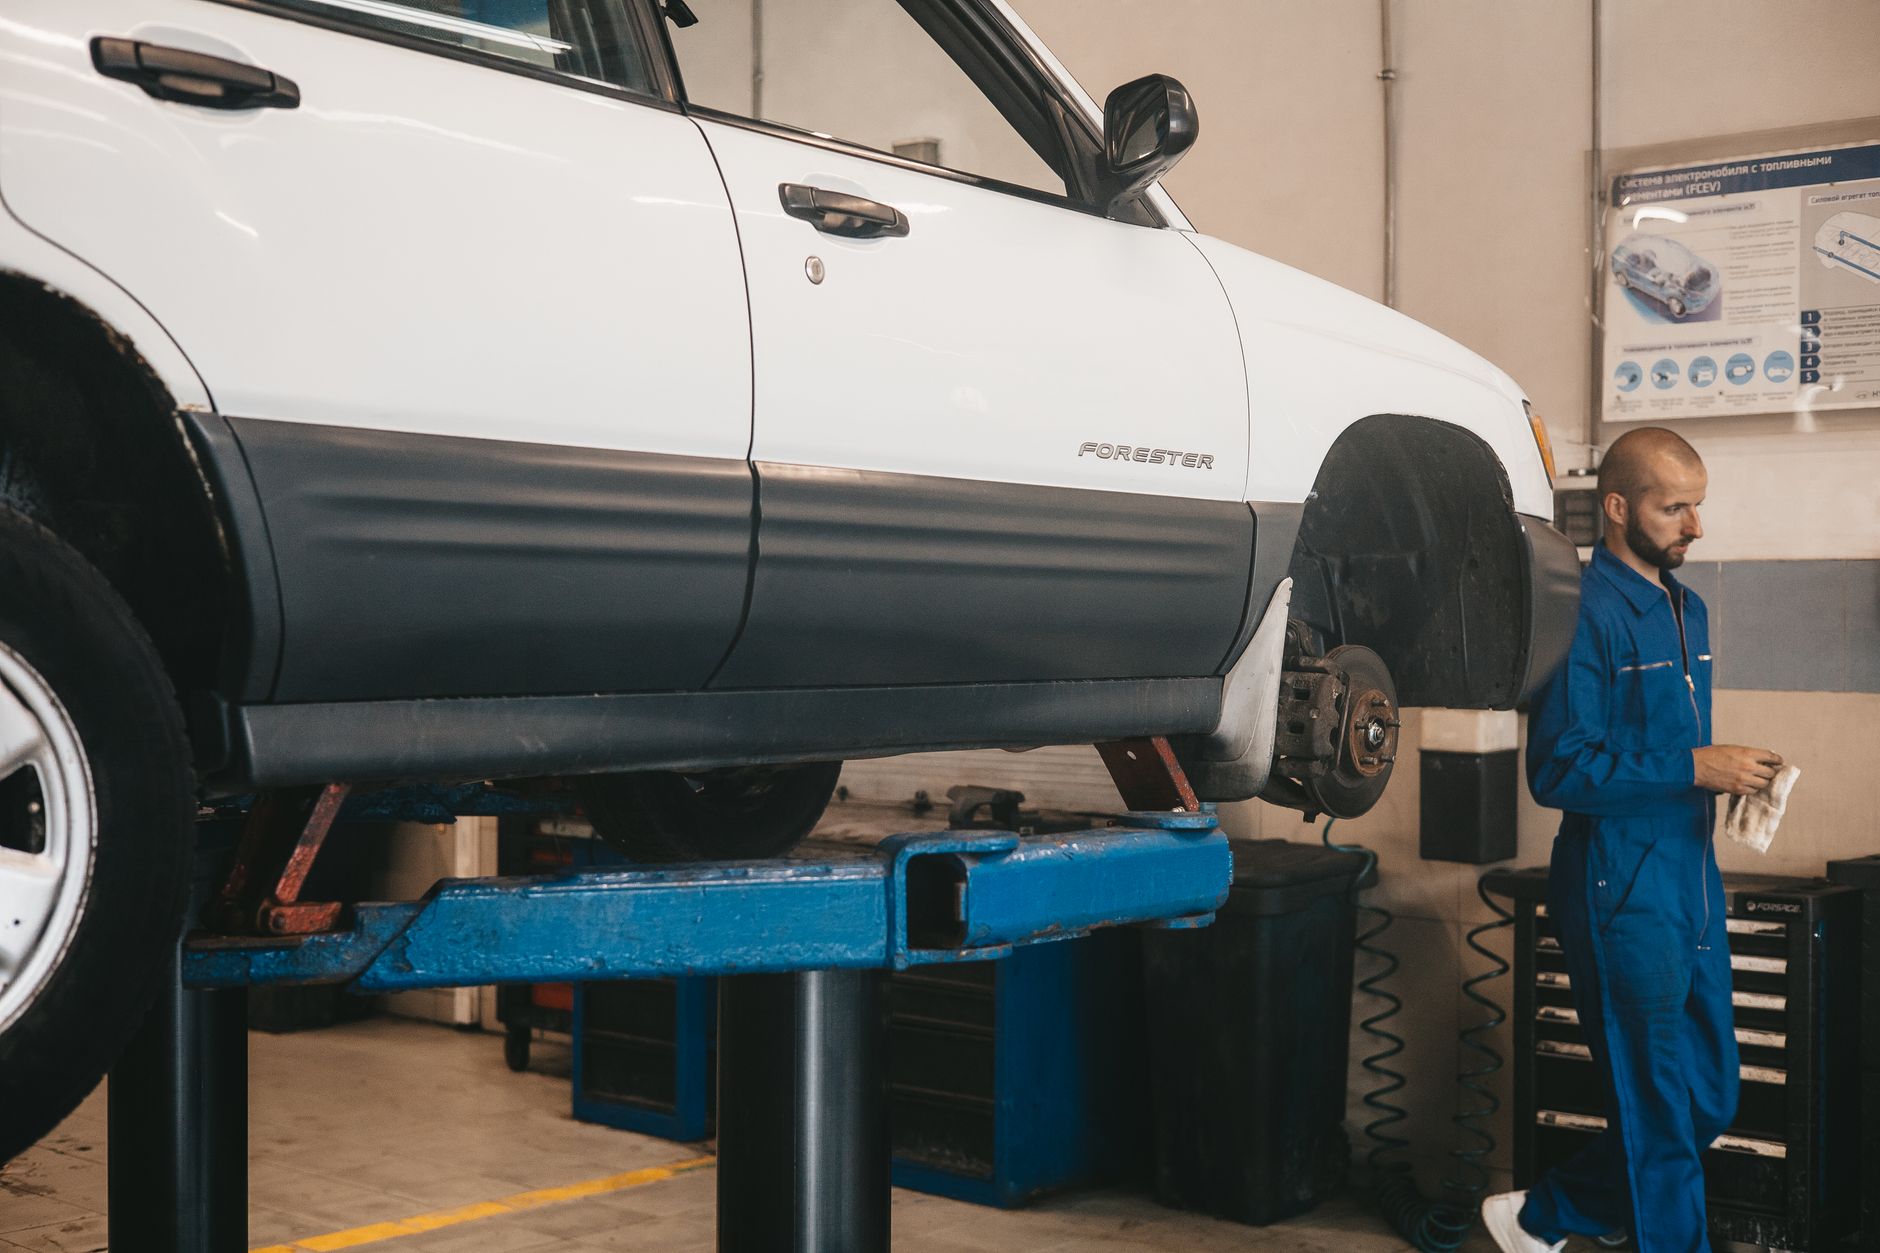
The labor side of the math is the hours of laborers and freight, stock, and material movers, hand work that the robot completes. The government wage data on this page gives the local wage for that job, and the savings range prices the hours taken over at that wage. Nationally, the Bureau of Labor Statistics counts 2,988,900 jobs in this occupation in 2024, with 3,033,100 projected for 2034, which shows how large and steady the pool of this work is.
We did not find a published hours figure for parts or service moves at dealerships, so the hours have to be measured on your floor. The site assessment counts the legs, the trips per shift and the wait time, and turns them into the hours table the calculator uses.
The offset applies only to the share of those hours the robot can realistically take. Repeatable legs on a mapped route count. Special orders, oversized items and moves that need a person to load or sign for something stay with staff. We do not assume the robot takes every move.
How is the savings range calculated?
The calculator uses three inputs. The first is the hours of laborers and freight, stock, and material movers, hand work on your site, measured during the assessment. The second is the share of those hours the robot can realistically take, based on route repeatability and exceptions. The third is the fixed robot lease payment, quoted after the site assessment.
The offset is the hours taken over, priced at the wage on this page, set against the lease payment over the lease term. Where the offset exceeds the payment, the site earns a return. Where it falls short, the case may still hold if faster bay turnaround is tracked and counted. The output is a range because each input is a range.
Read the range as a bracket. The low end assumes fewer hours taken and more exceptions. The high end assumes steady, high-volume legs on repeat routes. Neither end is a promise, and both move when the assessment changes an input.
What changes the number up or down?
Move volume is the strongest driver. Hours taken over scale with the number of legs per shift, so a dealership with heavy parts flow and a busy service drive sees more offset than a low-volume store. Route length matters too, because a longer repeat route gives the robot more of each leg.
Floor conditions and exceptions pull the number down. Thresholds, steep ramps, elevators that are not mapped and aisles that are often blocked add work or stop the route. A high share of special orders and irregular loads keeps work with staff. The checklist below lists what to check before the decision.
What are the risks to the return and how do you avoid them?
The biggest risk is a route that stops working. Changes to the building, a new dock layout or a shifted parking pattern can break a mapped path, and a stalled unit leaves totes waiting. Schedule a route review at any site change and keep a staff fallback on each route.
Downtime is the second risk. A unit out of service on a busy Saturday gives back the time it was meant to save. Ask what backup unit coverage and on-site dispatch the quote includes, and how remote triage handles a fault before a technician arrives. We service the robots nationwide, and those terms are written into the quote.
Injury risk is a reason some sites give for automation. The Bureau of Labor Statistics industry profile for motor vehicle and parts dealers reports a total recordable rate of 2.8 per 100 full-time workers, though the year was not confirmed in our search. A California state table for 2024 shows 3.2 per 100 workers for the same industry group, which is a state figure and should not be read as national. A robot removes some lifting, but not every hazard, so the return should not be built on injury savings.
Is adoption high enough to plan around?
We did not find a dealership-specific adoption figure for autonomous mobile robots. The closest published data covers warehouses and material handling. The MHI 2025 Industry Report, as reported by 365Retail, finds that 41% of supply chain organizations have implemented robotics and automation, and 42% plan to within five years. Those are general automation figures, not figures for mobile robots.
A January 2025 survey of 217 professionals, reported by Material Handling 247, found that 32% planned to adopt within three years and 43% expected to raise robotics budgets in 2025. Only 32% had approved funding. Labor shortages and rising labor costs were the top drivers.
The gap between plans and approved funding is the useful signal. Many organizations intend to automate, but fewer have the money approved, so starting with one leased unit on one proven route fits how the broader market is moving. Adoption alone does not prove a return for your site, which is why the assessment measures your own hours.
How long does it take from assessment to payback?
The sequence runs from site assessment to route mapping, a pilot on one leased unit and one or more routes, go-live support, and then a review of hours against the plan. Floor access, the dealership's own schedule and the number of routes in scope set the length, so the quote sets the dates rather than a generic timeline.
Payback is judged on the pilot results. Early weeks often include training, route adjustment and exception handling, so the offset may run below the steady range until those settle. Expansion to more routes or units should follow the pilot numbers rather than the first estimate.
We did not verify a single payback period for this setting, so none is stated here. Ask for the pilot length and the review point in writing with the quote, and check that the review uses hours measured on your floor.
How do you get a precise figure from a free site assessment?
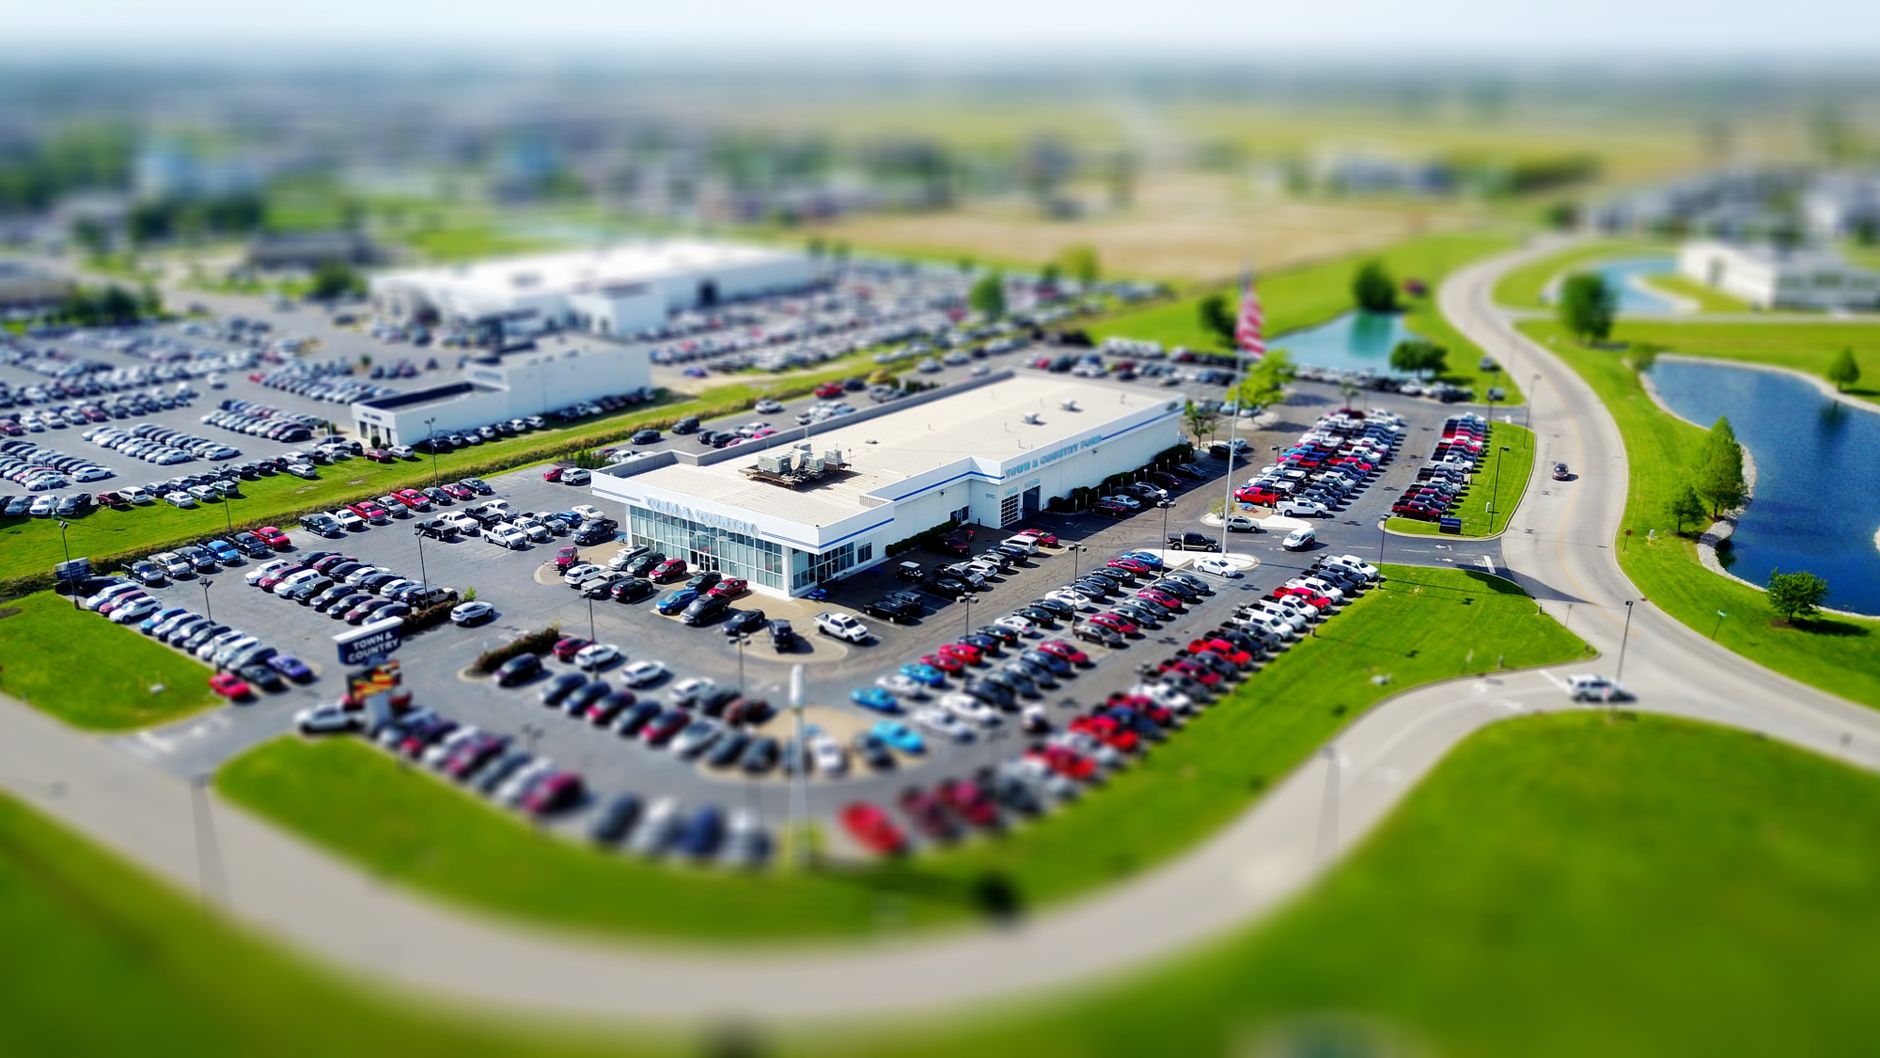
The free site assessment produces the inputs the calculator needs. We walk the receiving dock, parts storage, service drive and bays, and log the legs that repeat. If parts move records exist, we use them, and if they do not, we time a sample of runs.
We then map the candidate routes, check floor conditions and thresholds, and mark the exceptions that stay with staff. The output is an hours table for your site, a realistic share of work the robot can take, and a fixed robot lease payment quote. We train staff on the system and provide go-live support.
Bring parts move logs if you have them, a floor plan, dock hours, the bay count and the roles that move parts today. The more of this you supply, the tighter the range. If logs do not exist, the assessment still gives a measured figure from a shorter sample.
Frequently asked questions
Want a warehouse robot at your car dealership?
Tell us about your site. We will recommend the robot, quote the lease, and keep it serviced.
Sources
- US Bureau of Labor Statistics, Occupational Employment and Wage Statistics (OEWS May 2024)
- NADA 2026 midyear report, as reported by Auto Body News
- NADA 2025 midyear report, as reported by CBT News
- BLS Occupational Outlook Handbook, automotive service technicians and mechanics
- BLS Occupational Outlook Handbook, hand laborers and material movers
- BLS industry profile, motor vehicle and parts dealers (NAICS 441)
- California Department of Industrial Relations, 2024 injury table
- 365Retail, MHI 2025 Industry Report
- Material Handling 247, warehouse robotics adoption trends 2025