
The short answer
Autonomous mobile robot ROI in Fresno comes from labor hours: a robot takes over part of the laborers and freight, stock, and material movers, hand work on the floor, and the savings range is the value of those hours less the fixed lease payment and the staff time still needed, adjusted for the share of tasks the robot completes on its own. Sites with repeated moves on mapped routes usually show the clearest return, while irregular, low-volume work usually shows a narrow one. A free site assessment measures the hours and sets the lease quote before anyone commits to a figure.
Key takeaways
- The return comes from labor hours on repeatable routes, valued at the local wage for this job.
- A robot takes a share of the work, not all of it, so that share is the number to measure.
- The fixed lease payment and service plan are set in a written quote after a free site assessment.
- Turnover and overtime raise the value of covered hours, but they do not change the robot's share of the work.
- Payback depends on floor layout, shift pattern and training, so measure before committing.
Run the numbers for your site
Auto-detected from your location - we use the real BLS wage here. Not right? Pick your city or state above.
What do you want to automate?
The robot takes the repetitive cart and pallet moves off the heaviest motion.
Autonomous mobile robot ROI in Fresno: what to expect
An autonomous mobile robot earns its return by taking over repeatable transport work that people otherwise do by hand or with carts. In Fresno, that work sits mostly with people in the laborers and freight, stock, and material movers, hand occupation, so that job is the labor side the savings math is built on. The calculator on this page is pre-filled for Fresno and shows a savings range from the hours you enter. It is an estimate, not a promise.
The range matters as much as its midpoint. Two sites of the same size can land far apart, because one runs steady routes every shift and the other changes its layout every few weeks. The sections below explain each input, so you can test the range against your own operation before you rely on it.
Where does the labor return come from in Fresno?
The labor pool is large enough to matter. A third-party aggregator of 2024 OEWS data reports about 8,140 people working in laborers and freight, stock, and material movers, hand in the Fresno metro. That is a sizing check, not a Bureau of Labor Statistics table. The local wage for this job appears in the government wage data panel on this page (OEWS May 2024, Fresno, CA), and the savings math uses that wage, not the headcount.
Transportation and warehousing is the wider employer group. According to the Federal Reserve Economic Data (FRED) series, transportation and warehousing employment in the Fresno metro was about 18.6 thousand, seasonally adjusted, as of January 2026. That count covers more than warehousing, so it shows how much of the regional workforce sits in movement work, not how many people one robot replaces. The most recent warehousing-only local figure we found is from the EEOC 2008 EEO-1 aggregate report, which lists 368 employees in Fresno warehousing and storage. It is old, so use it only as a rough signal of scale.
Median hourly wage, Laborers and Freight, Stock, and Material Movers, Hand
$4,179
Monthly cost of one full-time worker in Fresno, CA, at the median wage plus payroll costs (an estimate, not a quote).
How much of the work does a robot actually take?
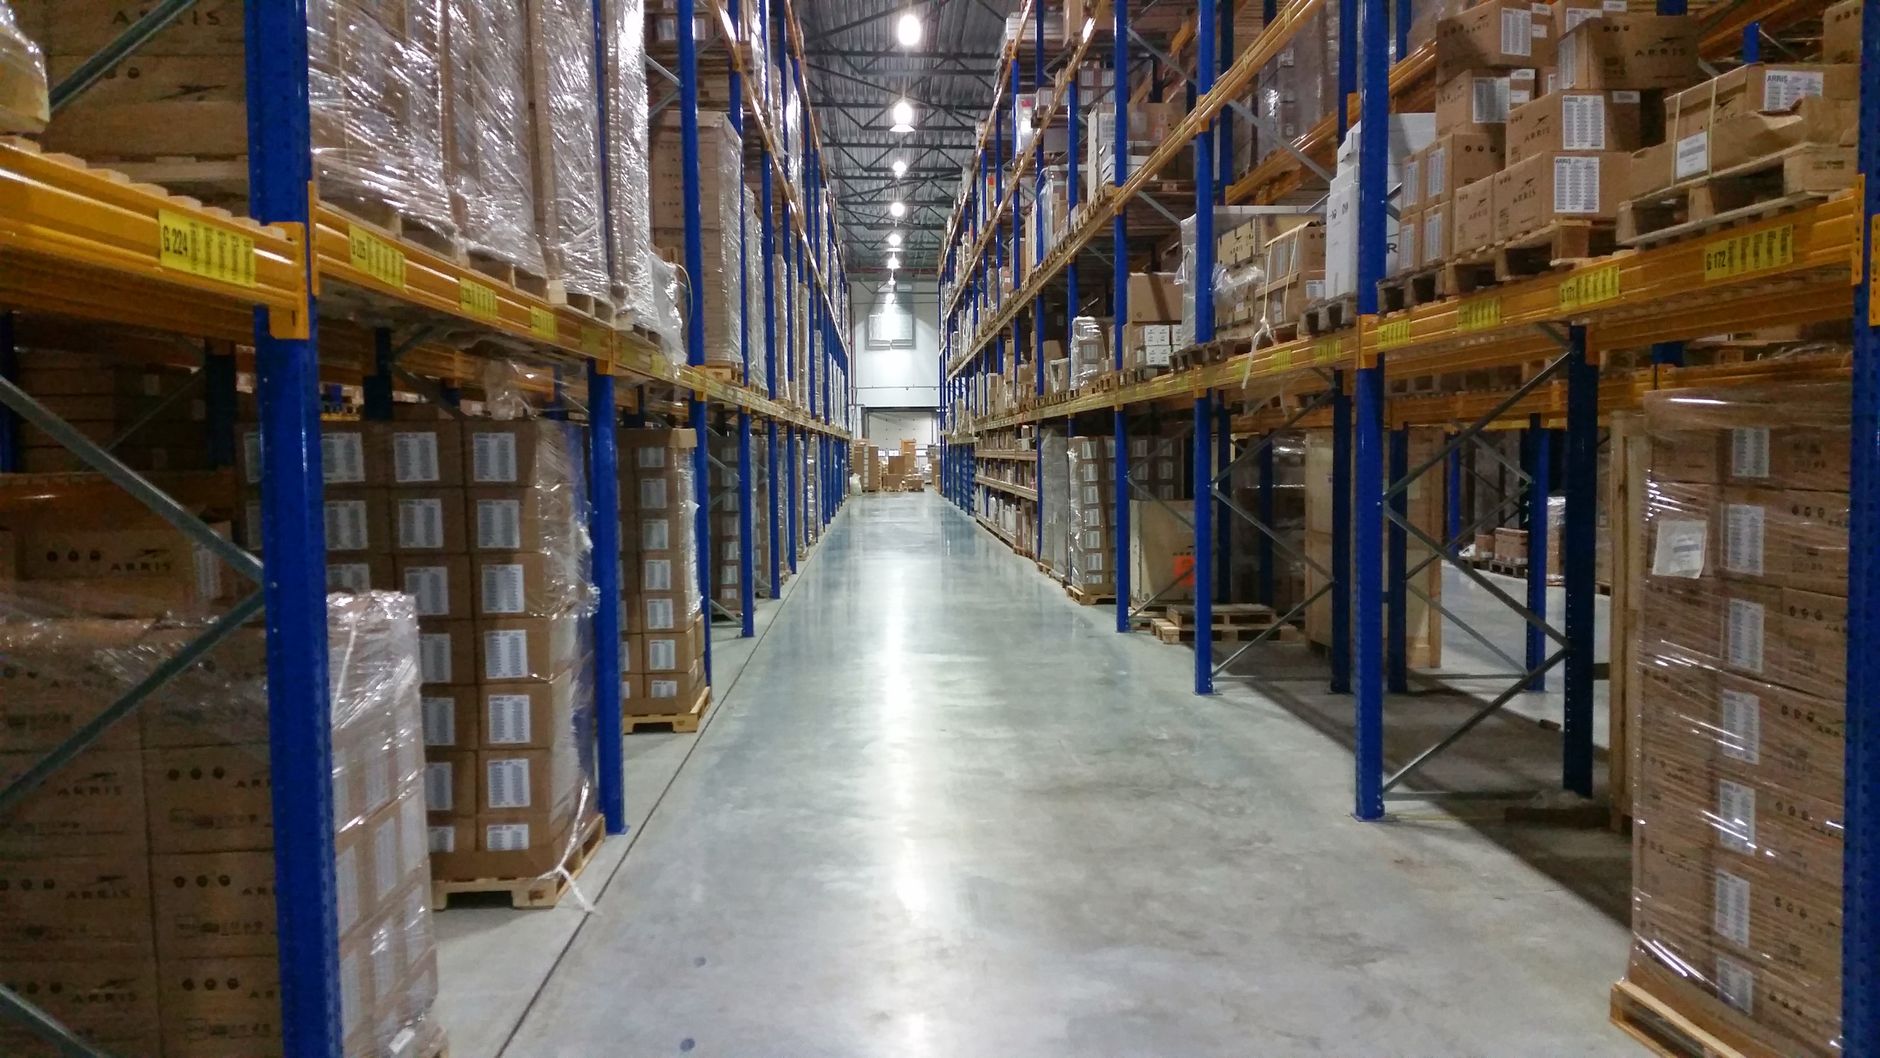
No robot takes every task, and the share it takes is the input most often overstated. Floor scrubbing on mapped aisles, repeated tote runs between two fixed stations, and cart moves on a set loop automate well. Work that needs a person to open doors, load racks, make exceptions or handle damaged goods stays with staff. The share depends on the task list, not on the robot's rated speed, which is why the assessment starts with the list.
Count only the hours that fall on repeatable, mapped routes. Subtract the staff time the robot still needs for loading, supervision and charging. For planning, we assume four people do this kind of work at a typical site of this kind. No published per-site count turned up in our research, so your roster replaces that assumption during the assessment. Ask for the task list in writing before any lease quote, and check each line against the floor.
| Task | Today | With a robot |
|---|---|---|
| Move totes between two fixed stations | Staff time on every run, counted during the site walk | Robot time on the route, plus staff to load and unload |
| Run carts on a set loop | Full staff time on each loop across the shift | Robot time on the loop, with staff at the handoff points |
| Scrub mapped aisles overnight | The crew's time on the same aisles | Setup and a daily check by staff at shift start |
| Open doors, load racks, handle exceptions | Staff time, unchanged | Staff time, unchanged |
| Charge, clean sensors and check faults | Often missing from the plan | Staff time added, and subtracted from the savings range |
No hour figures are shown. Each row is measured during the free site assessment from your own shifts. The tasks come from the floor, not from published data.
How does the savings math work?
The math has four inputs. The first is the labor hours the robot takes over, valued at the local wage for this job from the government wage data on this page. The second is the share of those hours the robot completes on its own, which is lower than the share on paper. The third is the staff time still needed to load, supervise, charge and check the robot. The fourth is the fixed lease payment, set in a quote after the site assessment, with the service plan included.
The savings range is the value of the robot's share of hours, less the staff time it still needs, less the lease payment. A narrow range means the site measured its hours well. A wide range usually means the task list is still rough. The calculator runs this arithmetic with Fresno inputs, and the range moves as you adjust the share, the hours and the staff time.
What raises or lowers the return?
Turnover is the factor most operators check first, and it helps the case only when vacancies cost real labor. A 2025 industry analysis of BLS transportation, warehousing and utilities data implies about 26.4 percent annual voluntary turnover. That is a sector rate, not a Fresno rate. A 2022 National Employment Law Project brief estimated about 124 percent annual turnover at large e-commerce warehouses in New Jersey, using 2020 data. That is an extreme case from another market and should not be used to forecast a Fresno site.
Other factors move the number too. Steady volume on fixed routes gets more out of a robot than peaks that shift each week. Floor layout, aisle width and how often routes change all affect how much work fits. Overtime and unfilled shifts raise the value of hours a robot covers, while a low-volume, single-shift operation may see a thin return.
What are the risks to the return, and how do you avoid them?
The main risk is over-counting hours. A site that assumes the robot does all of a crew's moves will see the gap at go-live. Avoid it by measuring hours during the assessment and running a pilot on one route before any wider fleet. Safety is the second risk. The Bureau of Labor Statistics reported a 2024 total recordable injury and illness rate of 4.8 cases per 100 full-time workers for warehousing and storage, with 4.1 cases involving days away from work, job restriction, or transfer, and 1.5 days-away cases. Those rates describe the sector, not the robot's effect, so do not book a safety saving in the math.
Uptime is the third risk. A robot that is down on a busy shift returns nothing. We address this through maintenance included in the lease, remote triage, on-site dispatch and spare unit coverage, so one fault does not stop the route. Plan staff cover for any hours the robot is down, and write the response time into the service plan.
How fast does payback happen, from assessment to go-live?
The timeline runs in stages. First is the site assessment: we walk the floor, map routes, time the work and agree the task list. Then comes the lease quote, which reflects the measured hours and the service plan. Next we deploy and integrate, train the staff who will run the robot, and go live on one route with support on site. Stage length depends on site size, the number of routes and how fast mapping is signed off, so we set dates during the assessment rather than quoting a general figure.
Payback arrives when the cumulative savings range covers the lease payments and the staff time the robot still needs. The first weeks of operation show the real share of work the robot completes. That reading should replace the assessment estimate, and the math should be rerun with it.
- Free site assessment: walk the floor, map routes, measure hours
- Quote: fixed lease payment and service plan, in writing
- Deployment and integration: mapping, testing and staff training
- Go-live on one route, with support on site
- Payback check: the savings range compared against measured results
Is this already happening across logistics?
Adoption is growing. According to the International Federation of Robotics, as reported in a trade press article on its World Robotics service robots report, transportation and logistics robot sales reached 102,900 units in 2024, up 14 percent. That figure is industry-reported and includes mobile robots for goods handling, so it describes a broad category, not one robot type. Use it to show that the work is being automated across the sector, not to predict a Fresno result.
For a Fresno operator, the practical point is whether the floor has the repeatable routes the technology needs. Those routes are what the site assessment checks first, and they decide the return more than any sector trend.
How do I get a precise figure for my site?
The calculator on this page gives a starting range for autonomous mobile robot ROI in Fresno. A precise figure comes from a free site assessment, where we map your floor, time the moves across shifts, confirm the share of work a robot can take, and set the fixed lease payment in a written quote. We are a US commercial robot integrator. We pick the robot for the site, lease it through financing, deploy and integrate it, train your staff and service it nationwide, so one partner handles the full chain.
Bring your shift schedule, a floor plan and your turnover and overtime records. Those three inputs replace estimates with measured hours. If the assessment finds the share of work is too low for the lease to pay back, we will say so, and the range will reflect it.
Frequently asked questions
Put a robot to work in Fresno.
We walk your site, learn the job, and recommend the unit that fits. Then we quote the lease, deploy it, and keep it serviced.
Sources
- US Bureau of Labor Statistics, Occupational Employment and Wage Statistics (OEWS May 2024)
- Third-party aggregation of 2024 OEWS data for Fresno metro laborers and freight jobs
- Federal Reserve Economic Data (FRED), transportation and warehousing employment, Fresno metro
- EEOC 2008 EEO-1 aggregate report, Fresno warehousing and storage
- Bureau of Labor Statistics, injury and illness rates, warehousing and storage (NAICS 493)
- 2025 industry analysis of BLS transportation, warehousing and utilities turnover data
- National Employment Law Project brief on warehouse jobs, 2022 (2020 data)
- Trade press report on International Federation of Robotics World Robotics service robots data