
The short answer
Autonomous mobile robot ROI in Houston, TX comes from taking over repeatable transport hours that would otherwise go to the laborers and freight, stock, and material movers, hand type of work. The savings range depends on how much of that work a given site can realistically hand off, minus a fixed lease payment quoted after a free site assessment. Savings are ranges, not promises, so measure your own transport hours before trusting any figure, including the one on this page.
Key takeaways
- The return comes from transport hours the robot takes over, valued at the local government wage for this job.
- Only the share of work a robot can realistically absorb counts, not the whole shift.
- The lease payment is fixed and is quoted after a free site assessment.
- Injury rates and turnover point to value beyond wages, but they sit outside the savings math on this page.
- Savings are ranges, and measured hours beat any estimate.
Run the numbers for your site
Auto-detected from your location - we use the real BLS wage here. Not right? Pick your city or state above.
What do you want to automate?
The robot takes the repetitive cart and pallet moves off the heaviest motion.
Autonomous mobile robot ROI in Houston: what return to expect
Houston has a large transportation, warehousing and utilities workforce. According to the Dallas Fed series published on FRED, that group held about 199 thousand jobs in September 2025, seasonally adjusted. A BLS-sourced series for the Houston metro puts the same group at 194.9 thousand jobs in 2024, not seasonally adjusted. The labor a robot can offset is therefore local and sizable, but metro size alone does not tell you what your own site will return.
The return from an autonomous mobile robot is the labor hours moved to the machine, valued at the government wage data for the local job, set against a fixed lease payment for the period the robot runs. Once the hours are measured, little else in the math is a guess. That is why this page starts with the hours and not with the robot.
The calculator on this page is pre-filled for Houston and shows a savings range from your inputs. The rest of the page explains where that range comes from, what moves it, and how a free site assessment replaces assumptions with measured figures. Treat the range as a planning tool, not a forecast.
Where does the return come from in a Houston warehouse?
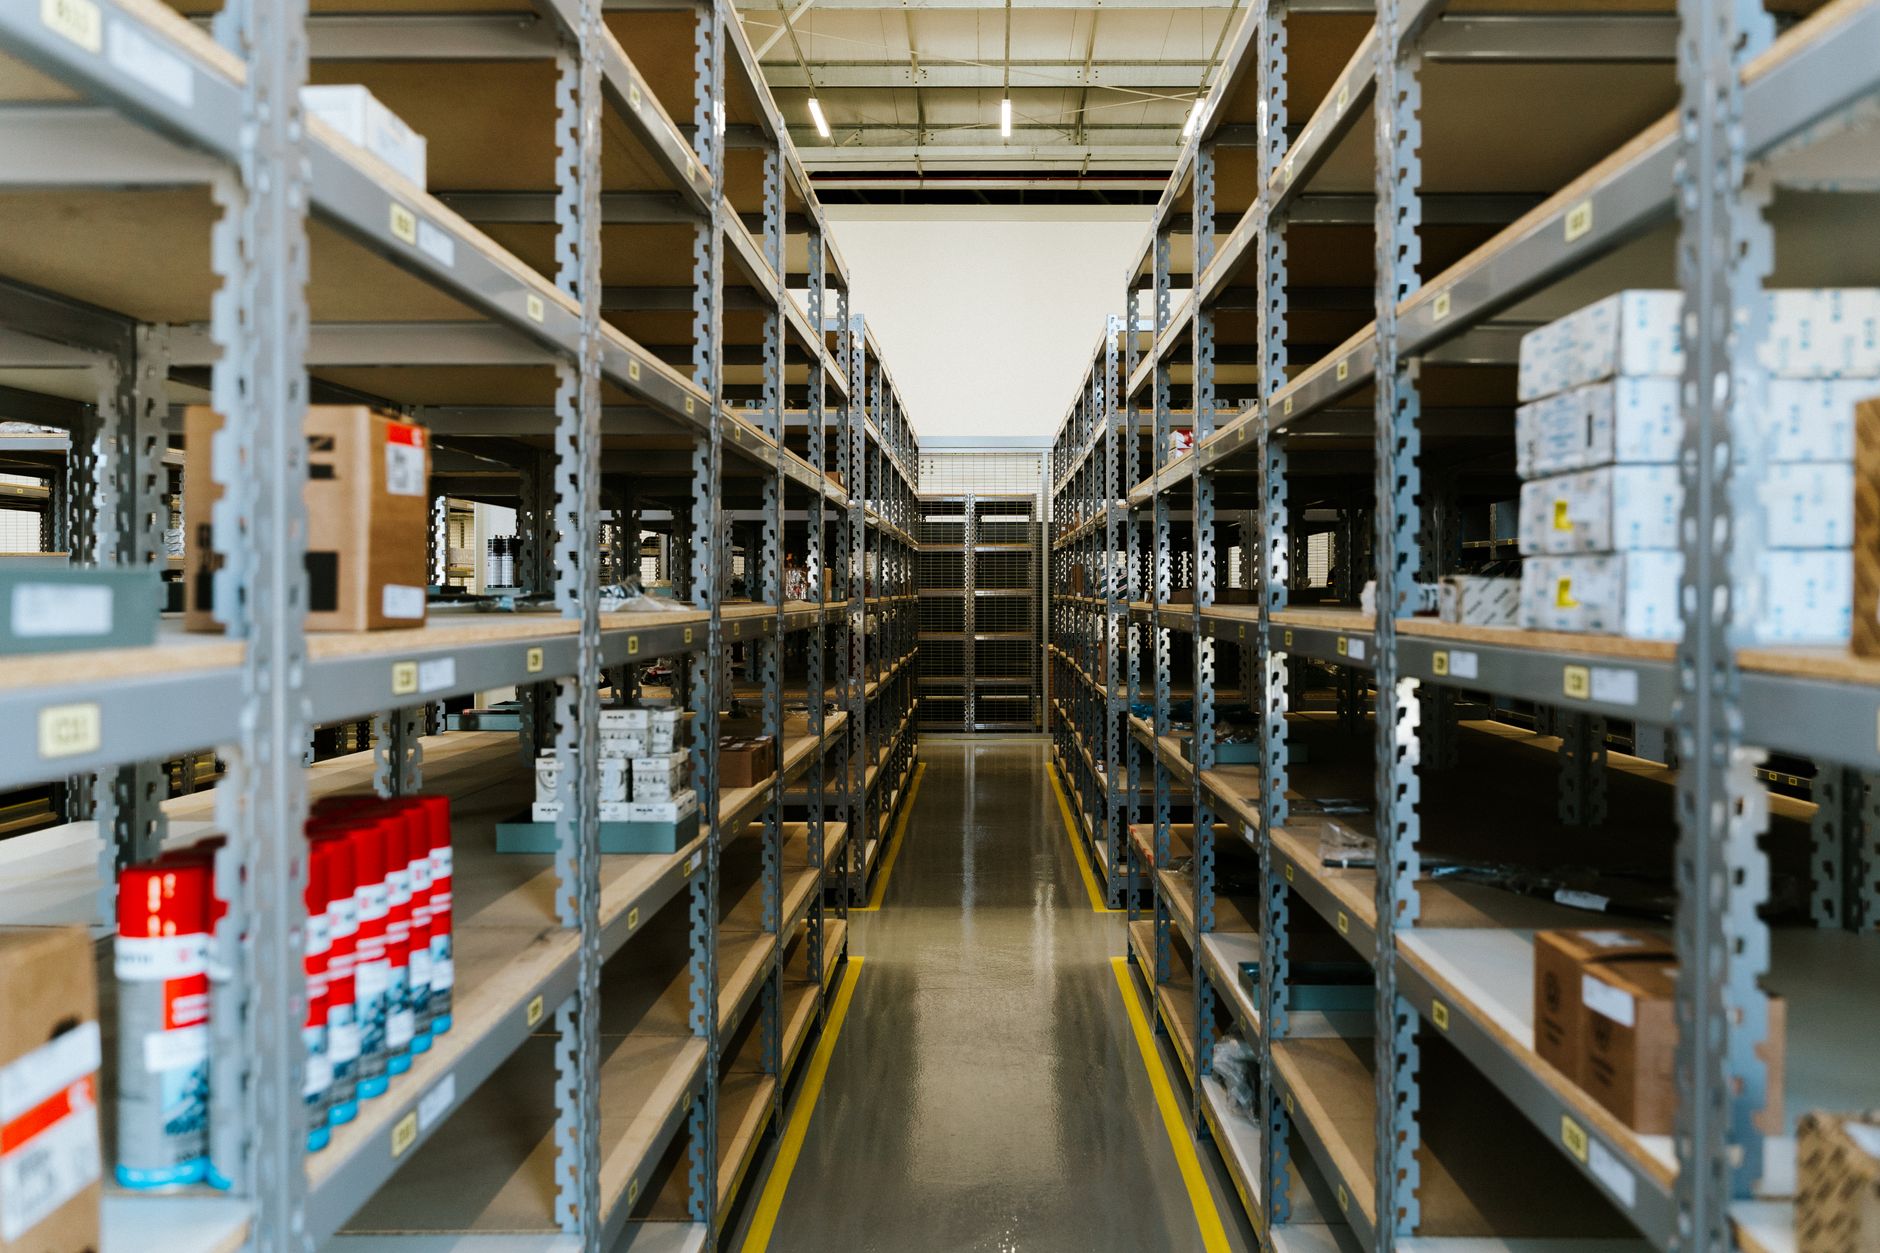
The return sits in repetitive transport work: moving pallets, totes and materials along fixed routes between receiving, staging, pick zones and shipping. Nationally, the detailed occupation Laborers and Freight, Stock, and Material Movers, Hand held 2,988,900 jobs in 2024, according to the Bureau of Labor Statistics Occupational Outlook Handbook. That count sits inside a broader hand laborers and material movers group of about 6.95 million jobs. The same handbook projects 4% growth from 2024 to 2034, about 258,400 new jobs, at a pace it rates as fast as average.
Warehousing and storage is a large industry with many sites. BLS quarterly counts list 21,604 establishments in the fourth quarter of 2022 and 22,124 in the third quarter of 2023, the second figure preliminary. Each site carries a different number of transport hours, so the count of sites tells you how many buildings could be examined, not how many hours a given one will free up.
Houston postings show how hard transport labor is to fill. An aggregator snapshot of Houston warehouse and logistics job listings counted 255 postings, 204 full time and 41 part time. That count reflects open roles on one date, not turnover, so read it as a sign of demand rather than a headcount.
Turnover is where many sites feel the cost. Secondary summaries of warehouse labor cite turnover far above the all-industry rate, but we did not confirm the survey behind those figures, so use them to check your own exit records rather than as a benchmark. Each departure brings hiring, onboarding and a gap in shift coverage. A machine does not leave a shift short, though it does need its own checks and oversight.
Median hourly wage, Laborers and Freight, Stock, and Material Movers, Hand
$4,231
Monthly cost of one full-time worker in Houston, TX, at the median wage plus payroll costs (an estimate, not a quote).
How does the savings range get calculated?
The math has three parts. The first is the transport hours per week that a robot can realistically take over, measured at your site. The second is the local government wage for that work, which sets the value of each offset hour and is shown in the panel beside this text. The third is the fixed lease payment for the robot, its service and support over the lease term. The savings range is the value of the hours offset minus the lease cost, shown as a low case and a high case.
Share of work matters more than headcount. A robot does not take a whole job. It takes the repeatable legs of the job, such as moving full pallets from the dock to staging or running the same aisle route on a fixed cycle. Damage checks, mixed loads, manual picking and off-route tasks stay with people. The offset is therefore the robot's realistic share of transport hours, not the total hours in a shift.
Here is the logic without numbers. If a site spends a set number of transport hours each week and a robot can realistically take half of them, the labor offset is half those hours multiplied by the local wage for the job. The return is that offset compared with the lease payment, and payback arrives when the cumulative offset covers the lease cost plus any one-time setup costs in the quote. The low case uses a smaller share and more exceptions, while the high case uses the full repeatable route.
Headcount varies from site to site. The public sources we reviewed do not publish a per-site count for this kind of transport work, so the site assessment sets the real number. The count you enter in the calculator should come from that assessment, not from an average. Treat the typical count shown with this page as a planning starting point only.
| Task | Today | With a robot |
|---|---|---|
| Move full pallets from receiving to staging | hours logged by timed walk study during the assessment | robot runs the repeatable leg, staff load and release |
| Run the same aisle route between picks and dock | measured per shift in the assessment | robot follows the fixed route, staff handle exceptions |
| Move totes between cross-dock lanes | measured per shift in the assessment | robot covers the lane, staff clear jams and reroute |
| Return empty carriers to the start of the line | measured per week in the assessment | robot returns carriers on schedule |
| Check and charge the robots | not applicable today | short check at start and end of shift, sized in the quote |
No hour figures are stated because they differ by site. Hours come from timed observation during the free site assessment, and the local government wage for this job values each transport hour the robot takes over.
Which hours can a robot realistically take over?
Robots take repeatable transport hours on known routes. The strongest candidates run the same path on a schedule, carry standard loads and move through clear, predictable traffic. A site where the same flows repeat each shift usually shows a larger share than a site where every day is different. That is the first thing the assessment checks.
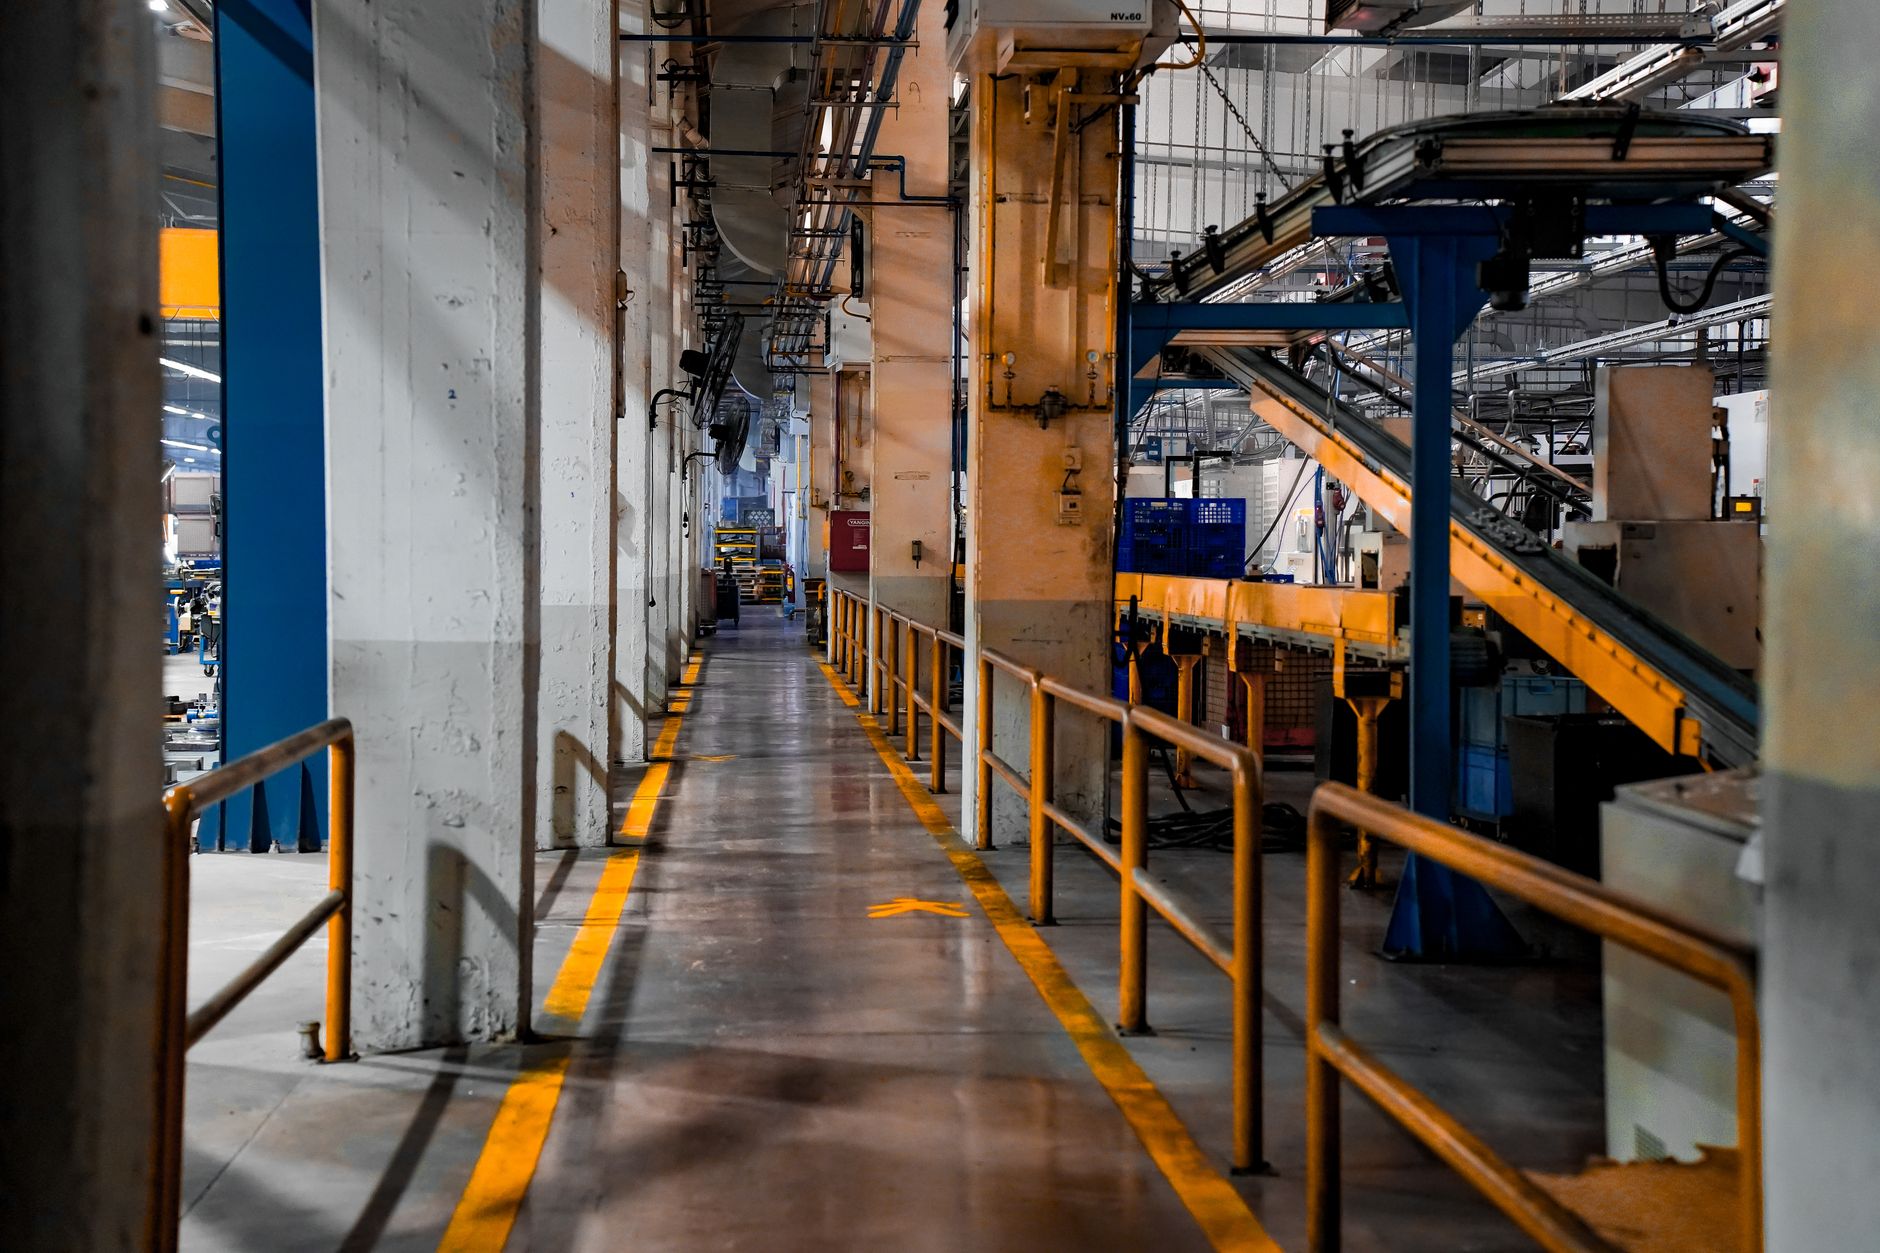
Two areas are common candidates. Dock and staging areas move product in volume, and aisles between pick zones are the main travel lanes. Both are easier to map and keep clear than the rest of a building. The zones below show where the robot works and what it does there, and where people stay on the work.
A realistic share is set by the least predictable step on the route. One blocked lane, a missing charge point or a pallet left outside the route can cut the robot's share sharply on a given day. The assessment therefore maps the route and marks the points where people still need to act.
Timed observation is the only reliable way to size the share. A walk study logs how long each leg takes, how often it repeats and how often it stops for an exception. Over several full cycles, those logs show which legs are stable enough to hand off and which still need a person in the loop.
What changes the number up or down?
Route repetition is the biggest lever. A route that runs the same way each shift keeps the robot's share high. A site with frequent layout changes or irregular volume keeps more hours with people, and each layout change adds mapping time. Ask how often the racking and dock doors move before committing to a route.
Shift pattern matters. A robot that runs longer or overnight cycles spreads the lease cost across more transport hours than one used only on a short day shift. Two-shift and three-shift sites often show a different offset from a single shift, so the assessment models each shift separately.
Local labor conditions move the value. The local government wage for this job sets the value of each hour, and turnover adds costs that the basic offset does not count, such as hiring and training. The Dallas Fed series on FRED shows combined transportation, warehousing and utilities jobs in Houston grew about 1.2% over 2024 and about 3.5% over 2023, measured December to December. Growing local demand keeps transport labor hard to fill, but it does not change the math on your own hours.
Volume peaks change the picture too. A site with seasonal peaks may need a second unit for those weeks, which changes the lease term and the offset. Model peak weeks separately from normal weeks so the range does not rest on one busy stretch.
What are the risks to the return and how do you avoid them?
The most common risk is overestimating the share. Sites often take total transport hours from a plan and forget shift changes, exceptions and dock jams. Avoid this by measuring several full cycles across every shift, then setting the low case from the lowest measured week rather than the average.
The second risk is under-use. A robot that sits idle because routes were never mapped or staff were not trained produces no offset at all. Training should cover loading, exception handling and daily checks. The site also needs one named owner who reviews the daily queue, because a robot is only as useful as the route it is given.
The third risk is downtime. A stopped unit leaves its hours with people unless there is cover. A spare unit program, remote triage and on-site dispatch shorten that gap, and the quote should state how quickly a stopped unit returns to service.
The fourth risk is a layout change that breaks the route. A moved rack or a closed door can cut the robot's share without anyone noticing. Put a re-map in the service plan so layout changes are caught early rather than discovered weeks later in the hours.
How long does it take to reach payback?
The timeline for autonomous mobile robot ROI in Houston runs in phases. The free site assessment measures hours, maps the route and sets the lease quote. Deployment and integration follow, covering mapping, route setup, staff training and a go-live period with support. Payback starts once the robot runs its repeatable share reliably, not on the first day it powers on.
Timing depends on site readiness, floor clearance and how quickly staff are trained. A single-site pilot with one leased unit moves through these phases faster than a multi-site rollout. A multi-site rollout is normally phased so that one site proves the route before the next one starts. The quote states the expected go-live window.
Measure hours at the end of the first few full weeks and compare the offset with the lease payment. If the measured share falls below the expected case, check the route, the staffing plan and the layout before revisiting the lease term.
How do you get a precise figure from a free site assessment?
A free site assessment replaces the calculator's assumptions with your measurements. We walk the transport routes while they run, time the hours by task and shift, check floor condition and clearance, and map the repeatable share. The measured figures set the low, expected and high cases, and the lease quote follows from them.
Bring a few weeks of shift schedules, daily volume by lane, any layout drawings, and turnover records for the transport roles. The better these inputs, the tighter the range. Ask for each case to be shown with the hours behind it, so the sign-off rests on numbers you can check.
We are a US commercial robot integrator. We choose the robot that fits the floor, lease it through financing, deploy and integrate it, train your staff, and service it nationwide with on-site dispatch and remote triage. One partner covers the path from assessment to daily operation, so there is one point of contact when a route changes.
Is an autonomous mobile robot worth it compared with more staff?
Adding staff is the default answer when transport work backs up. It adds hourly cost, hiring time and turnover risk on every shift. A robot adds a fixed lease payment and a set of routes, and it covers only the repeatable hours. The real comparison is not a whole crew against a machine. It is the repeatable transport hours, where the robot is the better option, and everything else, where people remain the better option.
People still win on judgment, damage checks, exception handling and anything off the route. A robot wins on repeatability, long or overnight running, and not needing a person to fill the shift. The best outcome is usually a mix: staff keep the exceptions and the robot keeps the repeatable legs.
The A3 trade association reported 36,766 North American robot orders for full year 2025, up 6.6% in units, and 17,635 robots in the first half of 2025. Those counts cover industrial robot arms and exclude mobile robots, and the full-year total includes 7,212 cobot units. They show the broader automation trend, not the market for this kind of robot, so use them as context rather than as a benchmark for your site.
Frequently asked questions
Put a robot to work in Houston.
We walk your site, learn the job, and recommend the unit that fits. Then we quote the lease, deploy it, and keep it serviced.
Sources
- US Bureau of Labor Statistics, Occupational Employment and Wage Statistics (OEWS May 2024)
- BLS Occupational Outlook Handbook, hand laborers and material movers
- BLS Injuries, Illnesses, and Fatalities, warehousing and storage (NAICS 493)
- FRED, Dallas Fed transportation, warehousing and utilities jobs, Houston
- A3, North American robot orders full year 2025 release
- A3, first half 2025 robot orders release