
The short answer
Autonomous mobile robot ROI in Indianapolis comes from taking over repetitive transport and material movement work that Laborers and Freight, Stock, and Material Movers, Hand staff now do by hand. The return depends on how many hours a robot realistically takes over, how many shifts it covers and the lease quote from a free site assessment. The savings range on this page is an estimate that moves with those inputs, not a promise.
Key takeaways
- The return comes from labor hours the robot takes over, not from headcount on paper.
- Indianapolis has about twice the national concentration of Laborers and Freight, Stock, and Material Movers, Hand jobs, so local data matters.
- Only the share of the work a robot realistically takes counts toward the return.
- The lease cost comes from a quote after a free site assessment, not from this page.
- Treat the savings range as an estimate that changes with shift coverage, layout and utilization.
Run the numbers for your site
Auto-detected from your location - we use the real BLS wage here. Not right? Pick your city or state above.
What do you want to automate?
The robot takes the repetitive cart and pallet moves off the heaviest motion.
What does autonomous mobile robot ROI in Indianapolis actually mean?
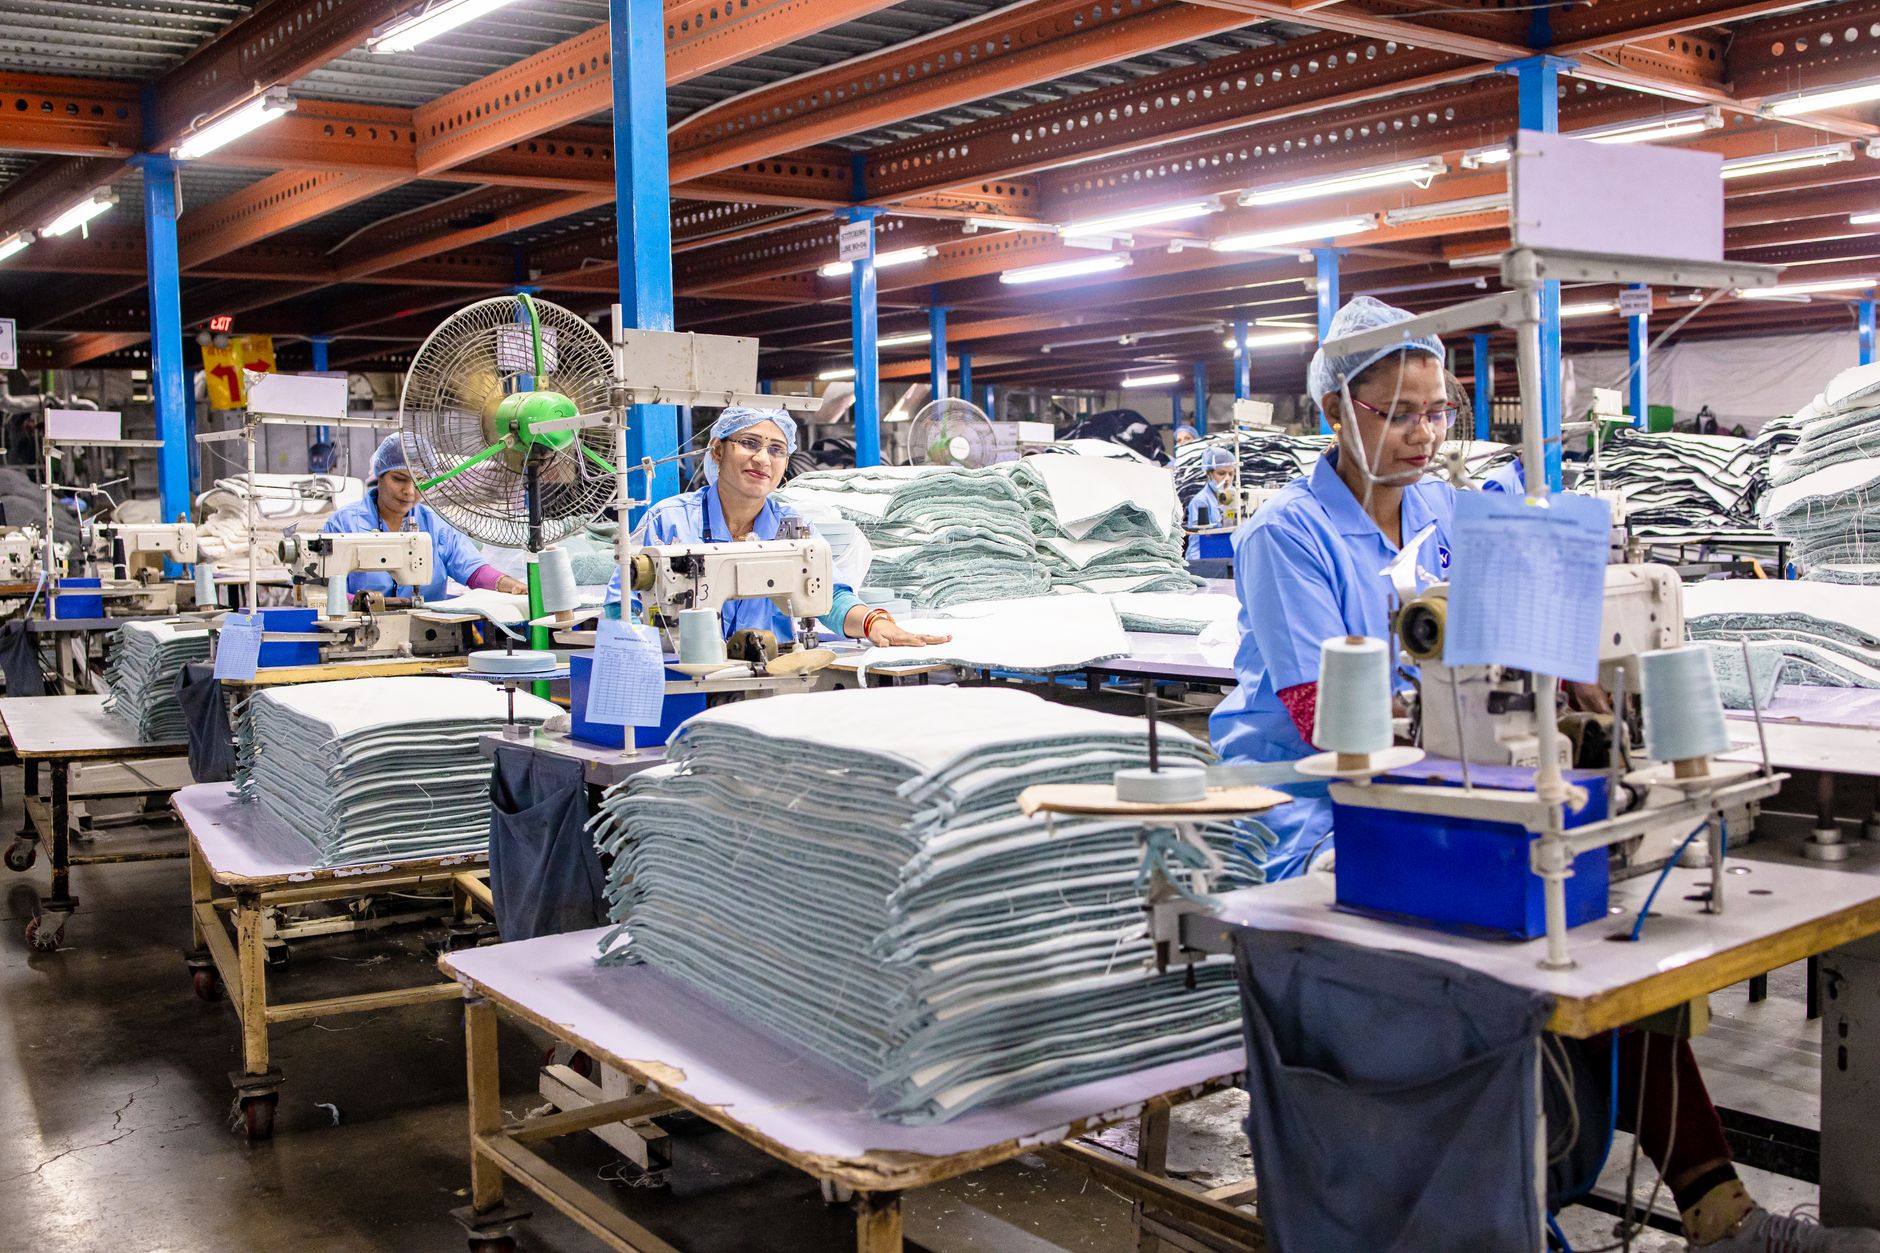
Return on investment for an autonomous mobile robot is the value of the work it takes off a site's hands, measured against what it costs to lease and run. In Indianapolis the labor side is large. The Bureau of Labor Statistics May 2024 estimates for the Indianapolis-Carmel-Greenwood metro count about 46,530 people in Laborers and Freight, Stock, and Material Movers, Hand, with a location quotient of 2.19, roughly twice the national concentration of that job.
The government wage data panel on this page gives the local wage for this job. The savings range is calculated by applying that wage to the hours a robot takes over, so the math rests on hours and not on a generic labor figure. Before trusting the range, check that the share of hours assumed matches your own floor.
Two limits apply. The BLS notes that its May 2024 estimates use new metro definitions based on the 2020 census, so older Indianapolis figures may not match. We also found no published count of this job per site, so the typical headcount on this page is a planning assumption that your site assessment replaces.
Where does the return come from in Indianapolis facilities?
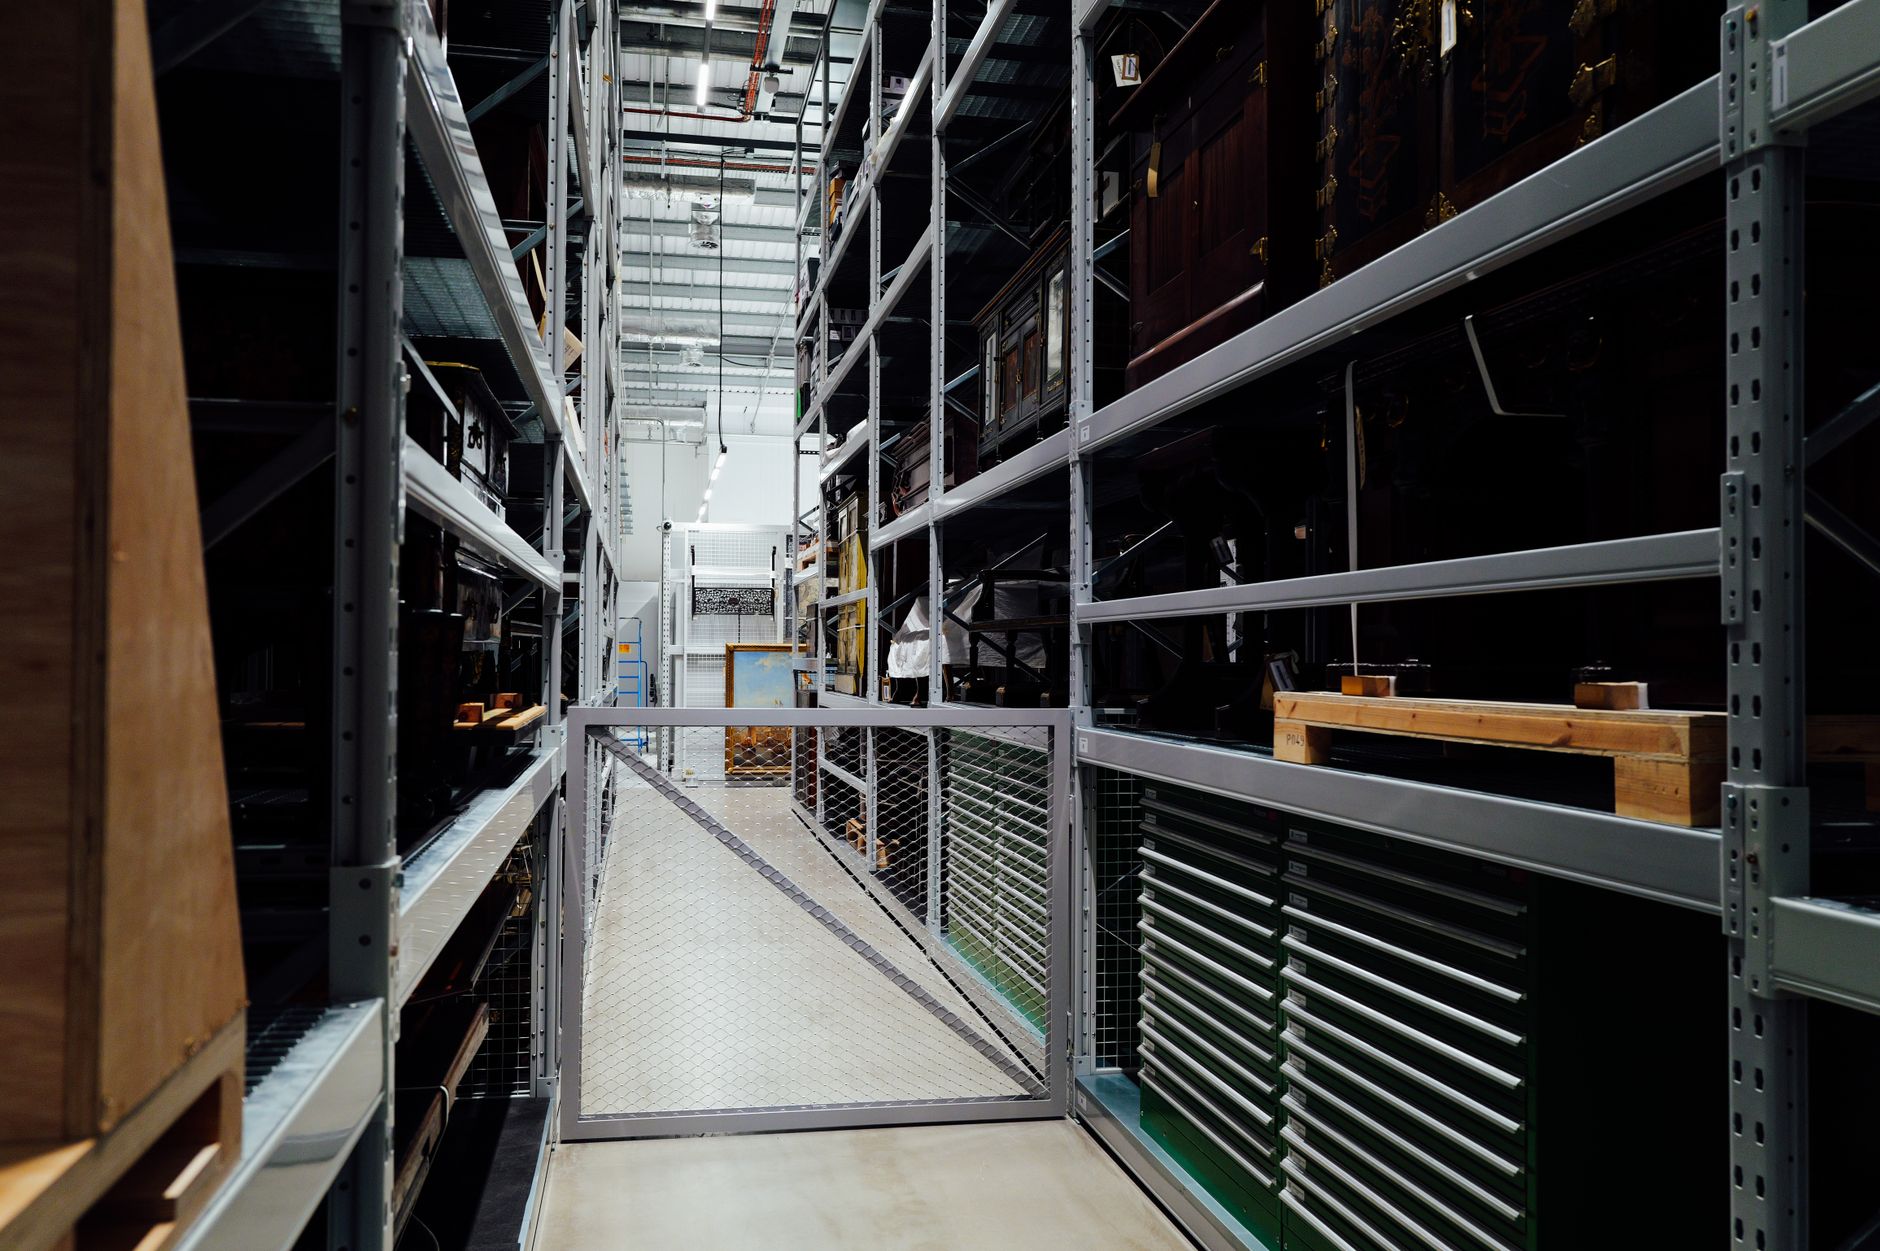
Indianapolis has a large industrial stock. According to a Q4 2025 Indianapolis industrial market report from a commercial brokerage, inventory was about 431,373,087 square feet and vacancy was 8.15 percent. A separate Q4 2025 Indianapolis industrial report from another large brokerage put vacancy at 8.2 percent, with more than 8.1 million square feet of leasing activity, and described vacancy as contracting at a record pace with few new spec spaces being built.
A tight market has a practical effect. When vacancy is low and new space is limited, many operators stay in the buildings they run, so the return has to come from automating a site that is already operating. The strongest returns appear where the same loads move between the same points on every shift, such as receiving to reserve racking, and where a few repeated runs take a steady share of a person's day.
Median hourly wage, Laborers and Freight, Stock, and Material Movers, Hand
$4,689
Monthly cost of one full-time worker in Indianapolis, IN, at the median wage plus payroll costs (an estimate, not a quote).
How do you calculate ROI for a leased autonomous mobile robot?
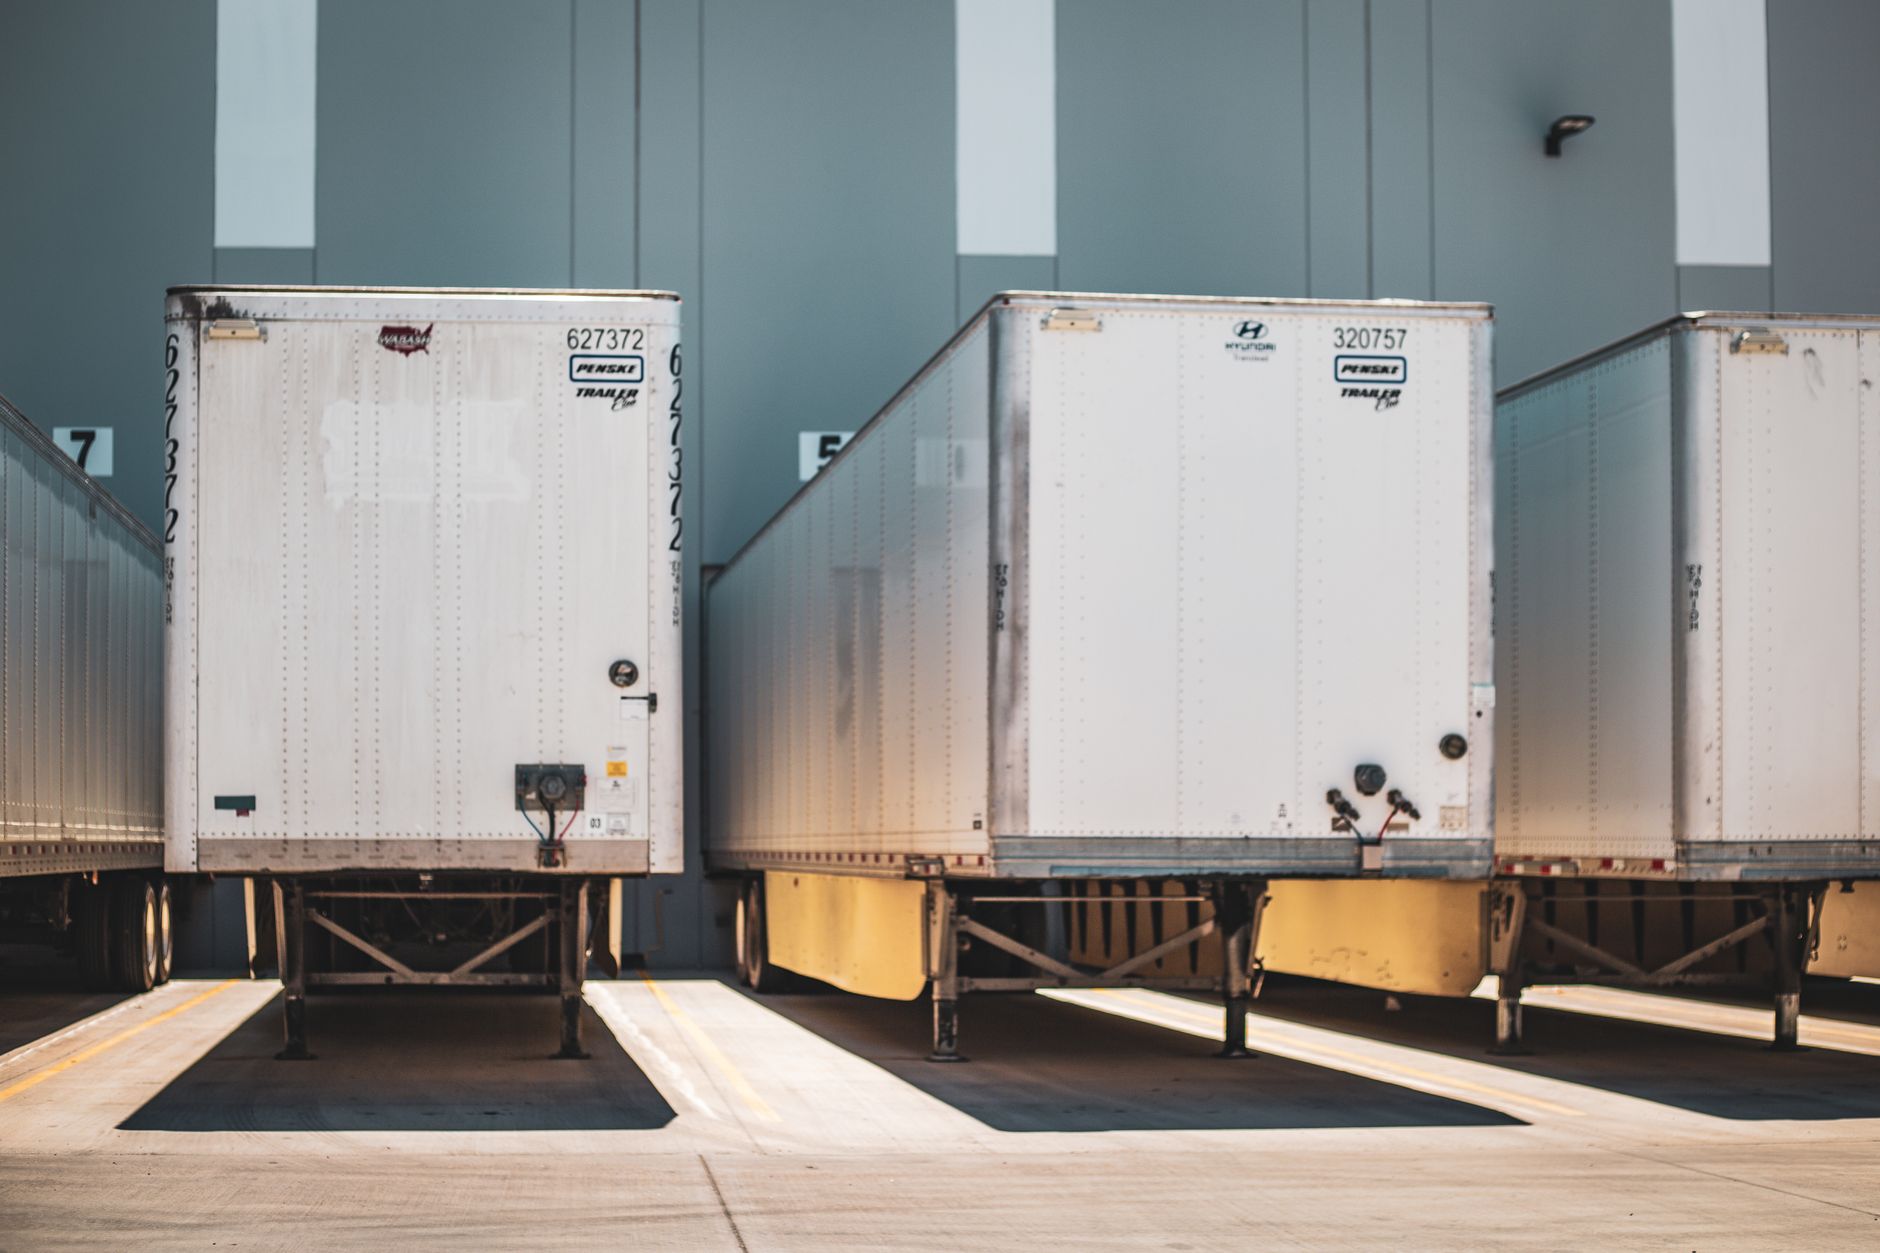
The core math is short. Start with the weekly hours that people in this job spend on tasks a robot can handle, such as moving pallets and carts along fixed routes. Multiply by the share of those hours the robot realistically takes over and by the share of shifts it covers. Then multiply the result by the local wage for the job from the government data panel. That product is the labor offset.
Subtract the lease cost and the operating costs your site carries, such as charging space, floor preparation and the staff time spent clearing exceptions. What remains is the net return for each period. Payback is the point where cumulative net return covers the one-time start-up work, such as integration and training.
Check what the lease quote includes, because service, integration and training terms change the net figure. The calculator on this page follows the same structure, and the range appears because each input is uncertain. Narrow the range by replacing assumed hours with logged hours from your own building.
What does the local labor market say about turnover?
The BLS job openings and labor turnover data show how hard it is to keep people in transportation and warehousing work. For transportation, warehousing and utilities as a sector, the quits rate was 2.2 percent in January 2025, 2.3 percent in December 2025 and 1.7 percent in January 2026, which is preliminary. These figures are not seasonally adjusted.
Those are monthly sector rates, not annual turnover for material movers in Indianapolis. We did not find a turnover rate for this specific job, so the calculator does not use one to size the return. Staffing pressure is still a real reason to test. Sites that lose people often pay for recruiting and training each time, and a robot that covers a fixed set of runs keeps those runs covered while people come and go.
A robot does not remove the need to train staff for the work it leaves behind. Use turnover as a reason to pilot, and keep it out of the savings math unless your own records support it.
- Repeatable runs on fixed routes
Autonomous Mobile Robot
Runs the same route on schedule at a steady pace
Staff
Adapts to changes but tires and needs breaks
- Coverage across a shift
Autonomous Mobile Robot
Covers scheduled runs whenever the site allows it
Staff
Limited by shift schedules, hiring and absence
- Irregular or fragile loads
Autonomous Mobile Robot
Poor fit for unusual shapes or fragile freight
Staff
Handles judgment calls, damage and odd loads
- Picking from shelves
Autonomous Mobile Robot
Outside the robot's scope in this setup
Staff
Stays with staff
- Starting a new task
Autonomous Mobile Robot
Needs mapping and route work first
Staff
Can start after a briefing and training
- Cost structure
Autonomous Mobile Robot
A lease quote with service and integration terms
Staff
Wages, benefits and time off, valued on the wage data panel
How safe is this work, and does injury data change the math?
Injury rates in this sector give useful context. A warehouse safety analytics summary reports a total recordable case rate of 4.8 per 100 full-time workers for warehousing and storage in 2024. A summary of BLS data puts general warehousing at 4.9 per 100 full-time workers for the same year. The peak season summary adds a DART rate of 4.1 and 32 fatal injuries in warehousing and storage in 2024, up from 28 in 2023.
These are secondary figures. We did not check them against the BLS injury tables, and the summaries do not agree on category and rate basis. Use them as background, and confirm them against the official tables before any internal decision.
The savings range on this page does not count injury reductions, because we did not find verified data tying robot runs to fewer recordable cases at a given site. Treat any safety benefit as a separate line for your own review, and compare incident records before and after go live.
How common are robots in industrial work, and what does that tell you?
A North American robotics trade association reported 36,766 industrial robot orders in 2025, up 6.6 percent from 31,311 in 2024. Collaborative robots made up 19.6 percent of 2025 orders. Fourth quarter 2025 orders reached 10,325, against 8,277 in the same quarter of 2024.
Those counts exclude mobile robots. They describe the arm market, not autonomous mobile robots, and we did not find a verified 2025 unit figure for mobile robots. The trend shows automation spreading across general industry, which is useful background but does not prove a return at any one site.
For a single facility, the useful evidence is its own labor hours and route data. National order counts can explain why the question is being asked, but the lease decision should rest on logged hours and a quote for the building in front of you.
What are the risks to the return, and how do you avoid them?
The most common risk is low utilization. A robot that sits idle for part of each shift takes less work than the calculator assumes, so the range falls. Layout changes are the second risk. Moving racks, adding pick faces or blocking a lane can break a mapped route, and the route needs remapping before the robot runs it again.
A third risk is people. If staff do not know how to clear an exception or call for help, the robot waits and the hours return to the floor. A fourth is peak periods, when volume can exceed the share the robot covers. The staffing plan needs a peak answer, not just a normal week answer.
Avoid these risks with a few habits. Start with one leased unit on the highest volume route, pilot it long enough to see the real share, train staff on exceptions before go live, and ask the quote how faults are handled, what service response looks like and whether a loaner unit covers a long repair. Settle those answers before signing, not after.
What is a realistic timeline from assessment to payback?
The sequence runs in stages. It starts with a free site assessment, where we map the building, log routes and trips and measure the hours a robot can take. The next step is the lease quote, which sets out the terms, what is included and the deployment plan.
Deployment follows. We integrate the robot with the site's routes and dock doors, train staff on the work it takes and the exceptions it leaves behind, and support go live. The first period is a ramp, when logged hours are compared with the projection and the route is tuned to real traffic.
Payback is measured on logged hours from real operation, not on the projection from the assessment. The schedule for your site depends on building size, integration scope and staffing, so the quote is the right place to read the timeline for your facility.
How do you get a precise figure from a free site assessment?
The assessment replaces estimates with your own numbers. Bring the shift schedule, the number of people doing transport work, the layout drawings and any dock constraints. We map the route, log runs across typical shifts and identify which tasks the robot takes and which stay with staff.
We then pick the robot that fits the floor and quote the lease through financing, with the terms of deployment, integration, training and nationwide service spelled out. The calculator is then updated with your logged hours, your local labor value and your lease terms, so the range narrows to your site.
Robots are only leased, through financing, and the lease is quoted after the site assessment. Nothing on this page is an offer. Ask for the assessment, then compare the quote against logged hours rather than against the range alone.
Frequently asked questions
Put a robot to work in Indianapolis.
We walk your site, learn the job, and recommend the unit that fits. Then we quote the lease, deploy it, and keep it serviced.
Sources
- US Bureau of Labor Statistics, Occupational Employment and Wage Statistics (OEWS May 2024)
- BLS Indianapolis OEWS May 2024 release
- Warehouse safety analytics summary of 2024 injury data
- Warehouse peak season injury statistics summary
- General warehousing injury rate summary citing BLS
- North American industrial robot orders 2025, trade association report
- Q4 2025 Indianapolis industrial market report, commercial brokerage
- Q4 2025 Indianapolis industrial figures, commercial brokerage
- BLS job openings and labor turnover, transportation, warehousing and utilities