
The short answer
Cobot ROI for glass manufacturers comes mainly from repetitive loading, unloading and inspection hours taken off fixed stations, valued at the hours of laborers and freight, stock, and material movers, hand work they replace. The savings range is that labor pool multiplied by the share of those hours a cobot realistically takes on your line, minus a fixed lease payment quoted after a free site assessment. National sources show the lifting burden is real, but the number that matters is set by your own cycle times and glass sizes.
Key takeaways
- Glass loading, unloading and inspection stations return labor hours from repetitive handling, not from removing whole lines.
- The savings range prices the hours of laborers and freight, stock, and material movers, hand work the cobot takes over.
- The share of cycles that fit the arm is the biggest lever, and a time study at your site measures it.
- Lease cost is a fixed payment quoted after a free site assessment, and the savings range is never a promise.
- Glass size, part mix, breakage and integration with washers and racks move the number more than headline figures do.
Run the numbers for your site
Pick your city or state for a real regional number - we use the real BLS wage there. (On the live site this auto-detects from your location.)
What do you want to automate?
The cobot stacks the repetitive end-of-line pallets; your team handles changeover and QA.
What is the cobot ROI for glass manufacturers, in plain terms?
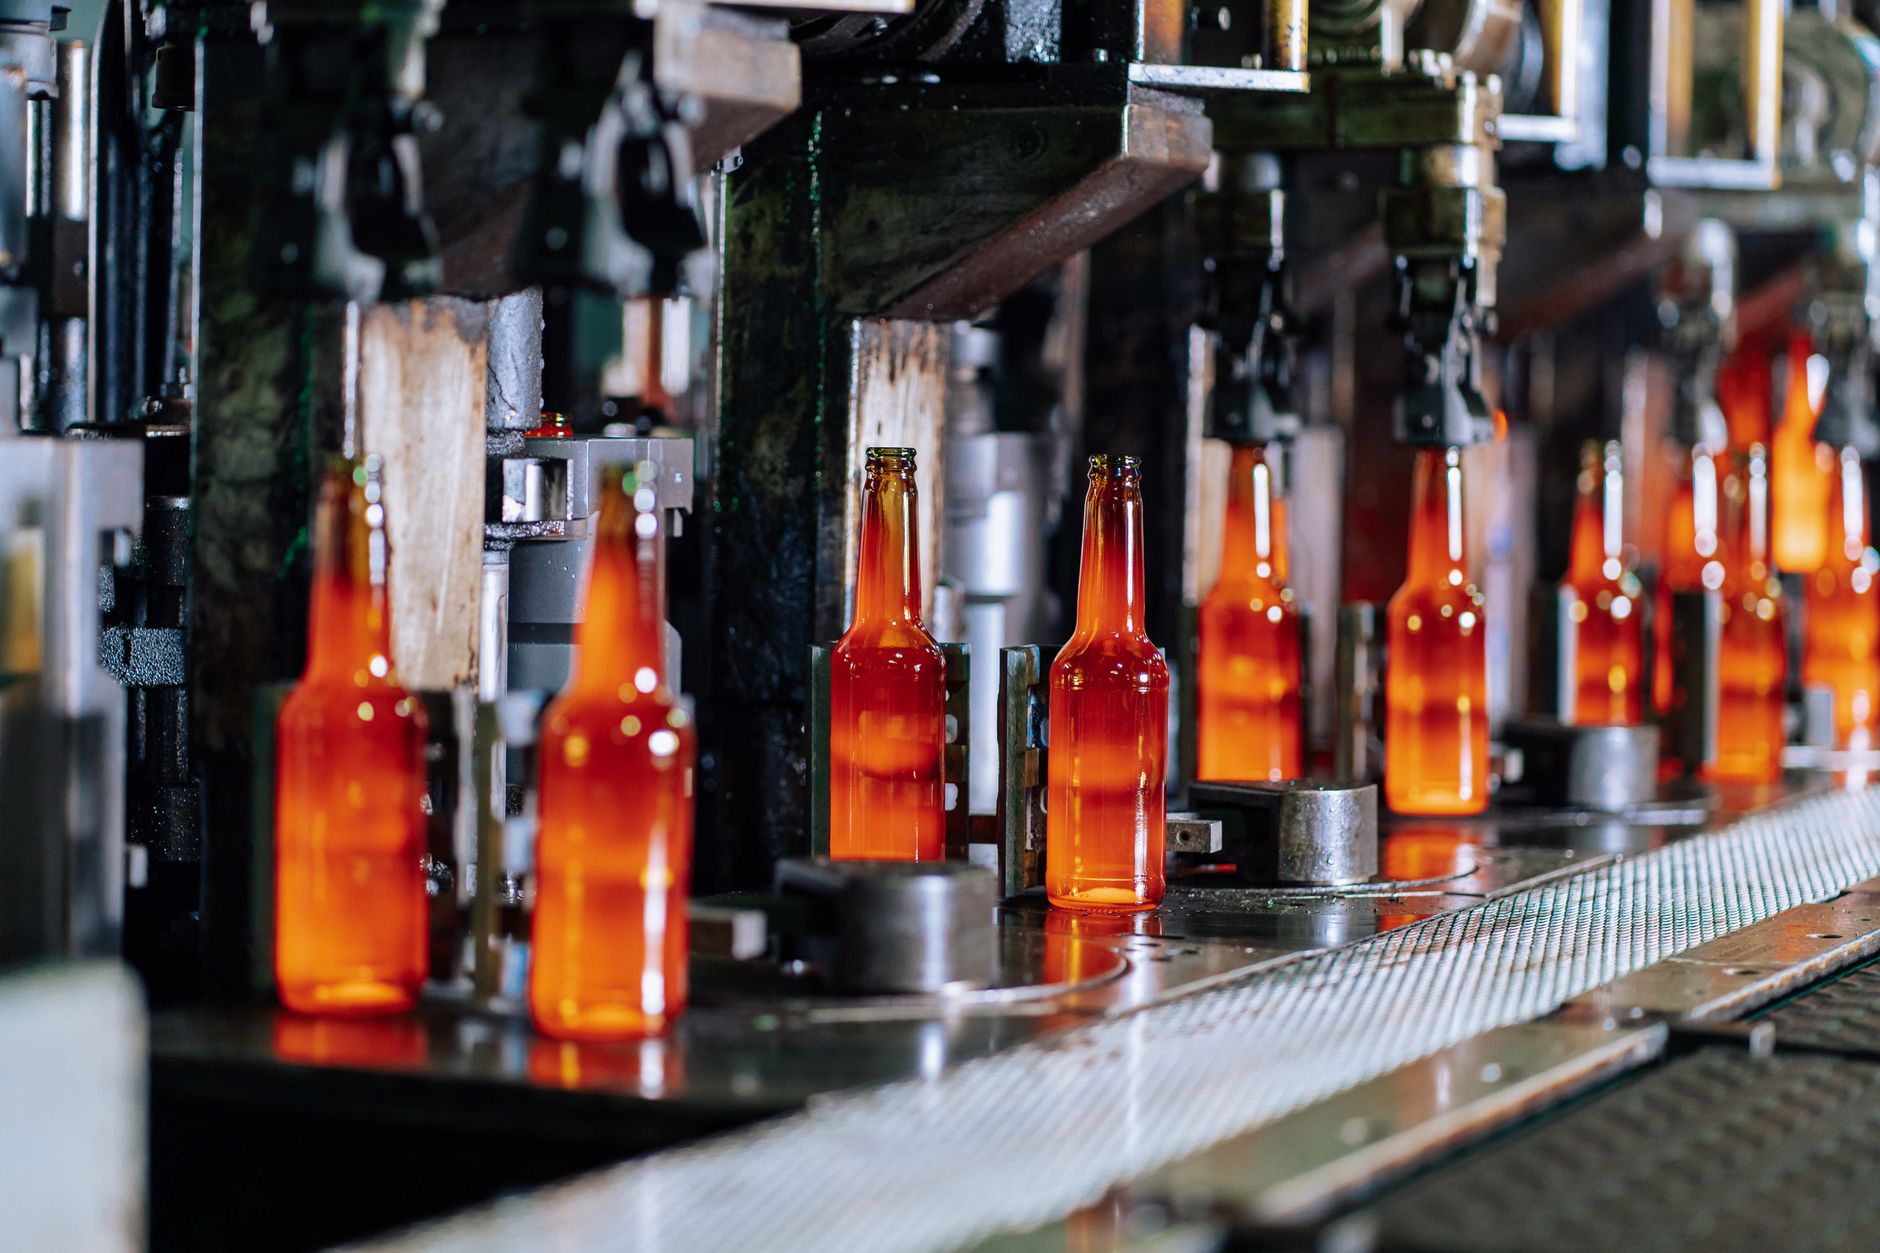
A cobot is a collaborative robot arm that works beside people at a fixed station. The return is easiest to see where a person moves the same kind of glass part again and again. In glass plants that means loading a washer or cutting table, stacking finished pieces onto racks or crates, and presenting parts at an inspection bench. Each job is material handling, and the labor behind it is the hours of laborers and freight, stock, and material movers, hand work that the arm can take over.
The sector is large. According to the Federal Reserve Bank of St. Louis (FRED), whose series is built on BLS data, NAICS 3272, glass and glass product manufacturing, had about 94,601 employees in 2024, down from 97,750 in 2023. A third-party aggregator for NAICS 327215, which covers plants that coat, laminate, temper or shape glass rather than melt it, lists 976 establishments and 49,897 employees, with no source year given.
Headcounts describe the sector, not your return. The return depends on how many hours of handling each station carries, and that is the number the rest of this page shows you how to measure.
Where does the labor return come from on a glass line?
The return comes from stations where the same motion repeats through the shift. Loading a washer infeed or cutting table, stacking parts onto racks and feeding an inspection bench are short cycles that a person repeats many times per shift. The load shows up as cumulative lifting and reaching, not as one hard event, which makes it easy to undercount.
The physical cost is documented in adjacent work. In a NIOSH and CPWR review of construction glass and glazing, which is field work rather than plant work, manual material handling was reported as the hardest task and was linked to back and shoulder injuries. The suggested fixes included mechanical handling equipment, which is why fixed-station handling is a sensible place to test a cobot.
Plant-wide rates are a baseline, not a benchmark. According to the BLS injury and illness chart for 2024, manufacturing overall had a rate of 2.7 per 100 full-time workers. That figure covers all of manufacturing, so compare it against your own OSHA log for these stations before drawing a conclusion.
Median hourly wage, Laborers and Freight, Stock, and Material Movers, Hand
$4,380
Monthly cost of one full-time worker, at the median wage plus payroll costs (an estimate, not a quote).
How does the cobot ROI math actually work?
The calculator prices labor in hours. Start with the hours per shift that laborers and freight, stock, and material movers, hand type of work occupy at the stations in scope. Multiply by the local wage for this job, which the government wage data on this page reports, and by the shifts and days the station runs. That product is the labor pool the cobot can address.
Next apply the share. Not every hour can be moved to a robot. The arm can take cycles that fit its reach, payload and cycle time, while setup, changeovers, jams and exception handling stay with people. The share is the largest single lever, and the site assessment exists to measure it instead of guessing.
Then subtract the lease cost. The lease runs as a fixed lease payment through financing, and the figure is quoted after a free site assessment. The savings range is the labor pool times the share, minus that payment and the service cost, shown as a range and never as a promise.

How much of the handling work can a cobot realistically take?
A cobot does best at a fixed station with one part family and a predictable cycle. Glass varies by thickness, size and coating, so the grip, the rack layout and the placement tolerance decide whether the arm takes the whole cycle or part of it. A station that changes part size every hour gives the arm far less to repeat than one running a single size all day.
The best published evidence on handling load comes from window manufacturing, not from a cobot trial. In a 2024 ISARC paper, the authors reported that reducing cart loads from 35 glass units to 25 cut transfer time by 7 percent, labor hours by 38 percent, and average fatigue from 5.0 to 4.0 on a 5-point scale. The result shows how strongly the size of each load drives labor hours, which is the lever a cobot pulls at a station, though the paper did not test a cobot.
Expect the share to be partial. Many stations will see the arm take the repetitive pick and place while people keep the exceptions. A partial share still counts, as long as the savings range is built from it.
What hours does a cobot take off the line each shift?
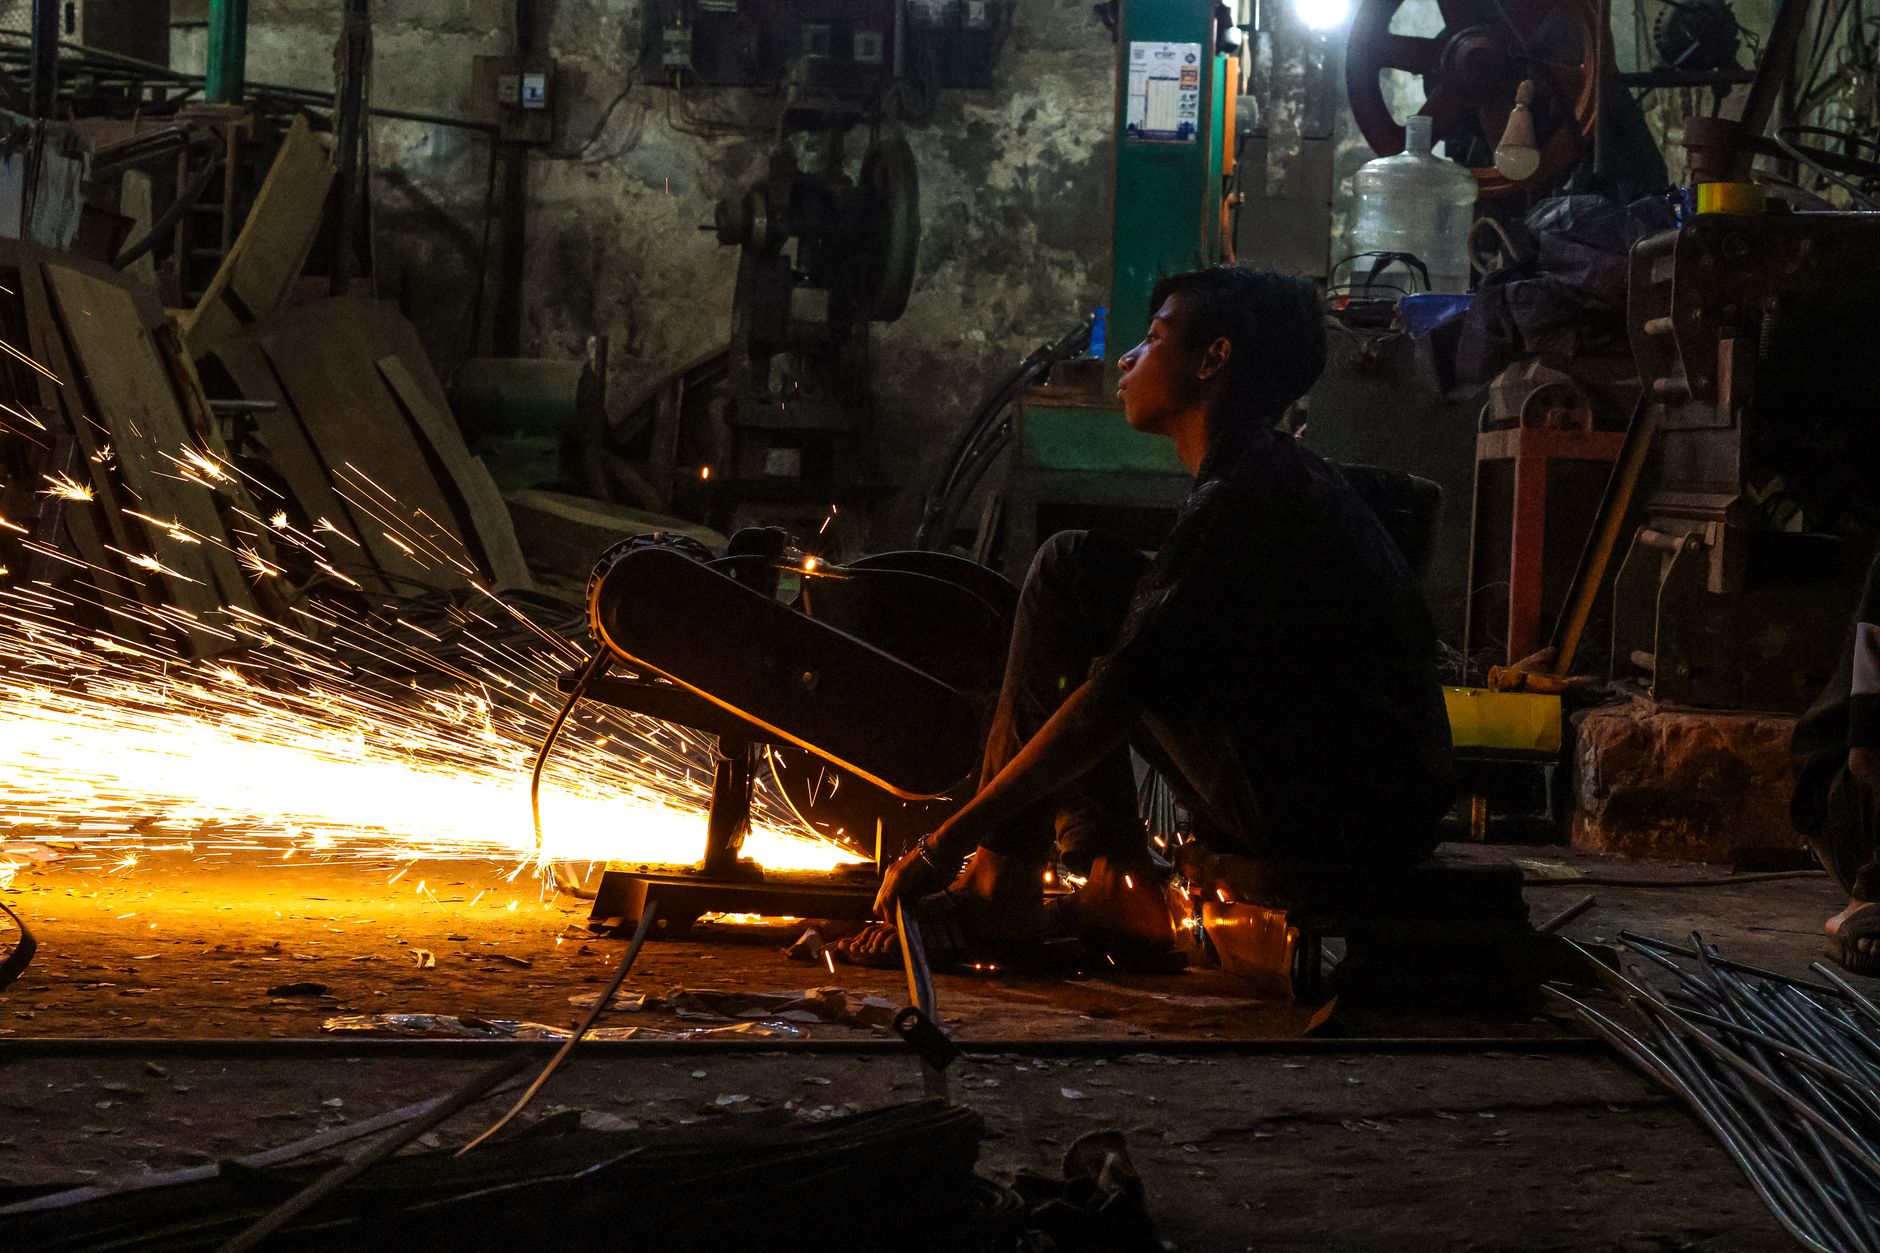
The sources reviewed for this page did not publish hour counts for glass loading or inspection stations, so the table below describes the work by task rather than by number. Your own time study sets the figures. Time each station's loading, unloading and inspection cycles across a full shift, and include the walking, waiting and clearing time people spend between cycles.
Cycle time alone is not the return. An arm that picks a part quickly still needs a person to refill its input rack, clear a jam, swap a gripper for a different glass size and sign off on rejects. Count those tasks as staff time that stays on the job, not as hours the robot removes.
Use the table as a checklist for the time study. Every row that stays with people reduces the share, and the share is what the savings range depends on.
What changes the cobot ROI for glass manufacturers, up or down?
Four factors move the number most: the share of cycles that fit the arm, how often the part mix changes, how many shifts the station runs, and how much breakage or rework the station produces. A station running several shifts on one part family gives the cobot far more repeated hours to work with than one that changes its part mix several times a day.
Glass size and weight set the grip and how many parts a cycle can carry safely. Rack and crate layout set placement tolerance. A station fed by an automated washer or cutting table has fewer hand-offs to people, so more of its cycles can stay with the arm.
Labor churn is a secondary effect. According to BLS JOLTS, the annual total separations rate for all industries was 3.3 percent in 2025, unchanged from 2024. A plant's own rate may be higher or lower, so track separations at each station, since new-hire training is part of the labor you measure.
What are the risks to the return, and how do you avoid them?
The biggest risk is an arm that waits. If the washer runs slower than the cobot, or racks fill before the crate station clears them, the labor saving leaks into waiting time. Map the flow from station to station before choosing the cell size, and make sure the arm is not the slowest item in the chain without a reason.
Breakage and edge damage erode the return too. A grip that marks a coated surface or a placement that chips an edge creates scrap, and scrap brings its own handling hours. Test grips on your real parts and write inspection criteria before go-live.
Integration is the third risk. A cobot that is not tied into line signals, safety zones and inspection logging still needs people watching it. Budget for integration and staff training as part of the project, not as an afterthought.
Adoption is growing, but growth is not return. According to IFR, and in a preliminary figure, US industrial robot installations reached 38,000 units in 2025, up 11 percent, and food-industry installations rose 30 percent. Globally, IFR reports 66,000 new cobot installations in 2025, 11 percent of industrial robot installations, and cobot growth of 7 percent trailed the overall market.
How long does it take from site assessment to payback?
The order matters more than the calendar. A site assessment comes first, then the quote, then deployment and integration, then staff training and go-live support, and only after that a full measured period of station hours. Payback is judged on that measured period, not on the day the arm starts moving parts.
Deployment should be phased so the line keeps running wherever possible. Each station is commissioned against its own time study, and staff are trained on the station before the arm takes its first full shift. Early running usually surfaces grip and program adjustments, so plan for tuning rather than a clean first run.
Measure the return against the assessment's time study. Compare hours taken over, hours left with staff and scrap changes, rather than the headline range from the calculator. The range is a planning tool, and the measured hours decide the payback.
How do I get a precise figure from a free site assessment?
A free site assessment replaces estimates with your own numbers. We map each station, time the loading, unloading and inspection cycles across a full shift, log part sizes and weights, and count the staff hours that touch each station. The output is the labor pool and the share the arm can take, which the calculator turns into a savings range.
We are a US commercial robot integrator. We pick the right robot for the site, lease it through financing, deploy and integrate it, train the staff who run it, and service it nationwide. One partner handles fit, lease quote, installation and service, so the people signing off deal with one point of contact.
Bring the shift pattern, the part list, the staffing count at each station and the scrap log. With those, the lease quote reflects your line rather than an industry average, and the range you sign off on has a basis you can check.
Frequently asked questions
Want a cobot at your glass manufacturer?
Tell us about your site. We will recommend the robot, quote the lease, and keep it serviced.
Sources
- US Bureau of Labor Statistics, Occupational Employment and Wage Statistics (OEWS May 2024)
- Federal Reserve Bank of St. Louis (FRED), NAICS 3272 employment, BLS data
- Third-party aggregator, NAICS 327215 industry data
- BLS, nonfatal work injuries and illnesses by industry
- ISARC 2024, material handling strategies in window manufacturing
- IFR, US robot industry returns to double-digit growth
- IFR, President's report on 2026 cobot installations
- BLS, JOLTS news release
- NIOSH and CPWR, construction glass and glazing (2019)