
The short answer
A delivery robot in a senior living community returns caregiver time by taking over the repeated carrying of meal trays, supplies and linens along fixed routes, and the savings range prices only the hours of waiter and waitress type work it takes over. A PHI summary of a study of seven nursing homes found that resident aides spent about 35.5 percent of their time on non-value-added work, but meal runs were not broken out, so each site has to count its own runs. The delivery robot ROI for senior living communities depends on the share of runs a robot realistically takes and on the lease quote that follows a free site assessment.
Key takeaways
- The return is caregiver time: the robot takes repeated carrying, not care.
- The savings range prices only meal and tray hours, valued on the government wage data for waiters and waitresses.
- One nursing home study put aide non-value-added time at about 35.5 percent, but meal runs were not broken out.
- Turnover above a third makes freed hours more useful, but only if roles and routines are rewritten.
- Your own figure comes from run counts and a lease quote after a free site assessment, not from averages.
Run the numbers for your site
Pick your city or state for a real regional number - we use the real BLS wage there. (On the live site this auto-detects from your location.)
What do you want to automate?
The robot walks the repetitive trays; staff stay with guests and tables.
What return can senior living communities expect from delivery robots?
The return from a delivery robot in a senior living community shows up first as caregiver time, not as a smaller staff. The robot takes over the repeated carrying of meal trays, supplies and linens along long corridors and in elevators, work that comes up many times in every shift and follows the same route each time. The hours it frees can go back to direct care, such as time with residents, help at mealtimes and checks at the bedside.
A delivery robot ROI for senior living communities is therefore a capacity return. It is measured in hours that move from carrying to care, and the savings range on this page converts the share of those hours a robot realistically takes over into a range you can test. The range is a planning tool, not a promise.
Results depend on the building. A community with long straight corridors, a kitchen far from the residential wings and elevators a robot can ride will return more than a compact single-floor building. The rest of this page covers where the hours come from, how the math is built, what changes it, and what would weaken it.
How many senior living communities would this apply to?
The count depends on the definition. The Senior List reports over 30,500 assisted living communities for 2026, and other counts differ because they use broader or narrower definitions of residential care. Neither is an official federal tally, so treat any single figure as a range when sizing a market.
Capacity is tight. In a press release, NIC reported that NIC MAP data for the first quarter of 2026 showed occupancy of 89.5 percent across 214 markets, which NIC says covers 85 percent of US supply. NIC also projects a shortfall of about 550,000 senior housing units by 2030.
For a facility manager, the practical point is that the strongest fits are multi-wing communities rather than the smallest buildings, because long routes give a robot more repeated runs to take over. A small single-building community can still fit, but the run count decides it.
Median hourly wage, Waiters and Waitresses
$3,798
Monthly cost of one full-time worker, at the median wage plus payroll costs (an estimate, not a quote).
Where does caregiver time go during a shift?
The clearest published figures come from a study of seven nursing homes observed over two months, with 368 hours of observation, as summarized by PHI. Resident aides spent about 35.5 percent of their time on non-value-added work, including linen distribution and restocking. Evening-shift aides were at about 37.5 percent, and day-shift aides were at about 30.9 percent.
Meal delivery was not broken out in those results, so the study does not tell you how many hours a given site spends on tray runs. That is the number the site assessment has to measure. The study covers nursing homes, not senior living as a whole, so use it to see the pattern rather than to set the savings figure.
The research pass found no published count of dining or delivery staff per community, so the typical staff count used for this page is a planning assumption rather than a sourced number. Confirm it at assessment. A robot does not take the whole non-value-added share, only the carrying segments that run on fixed routes, which is why the calculator asks for run counts instead of a percentage.
Why does staffing pressure make this return matter?
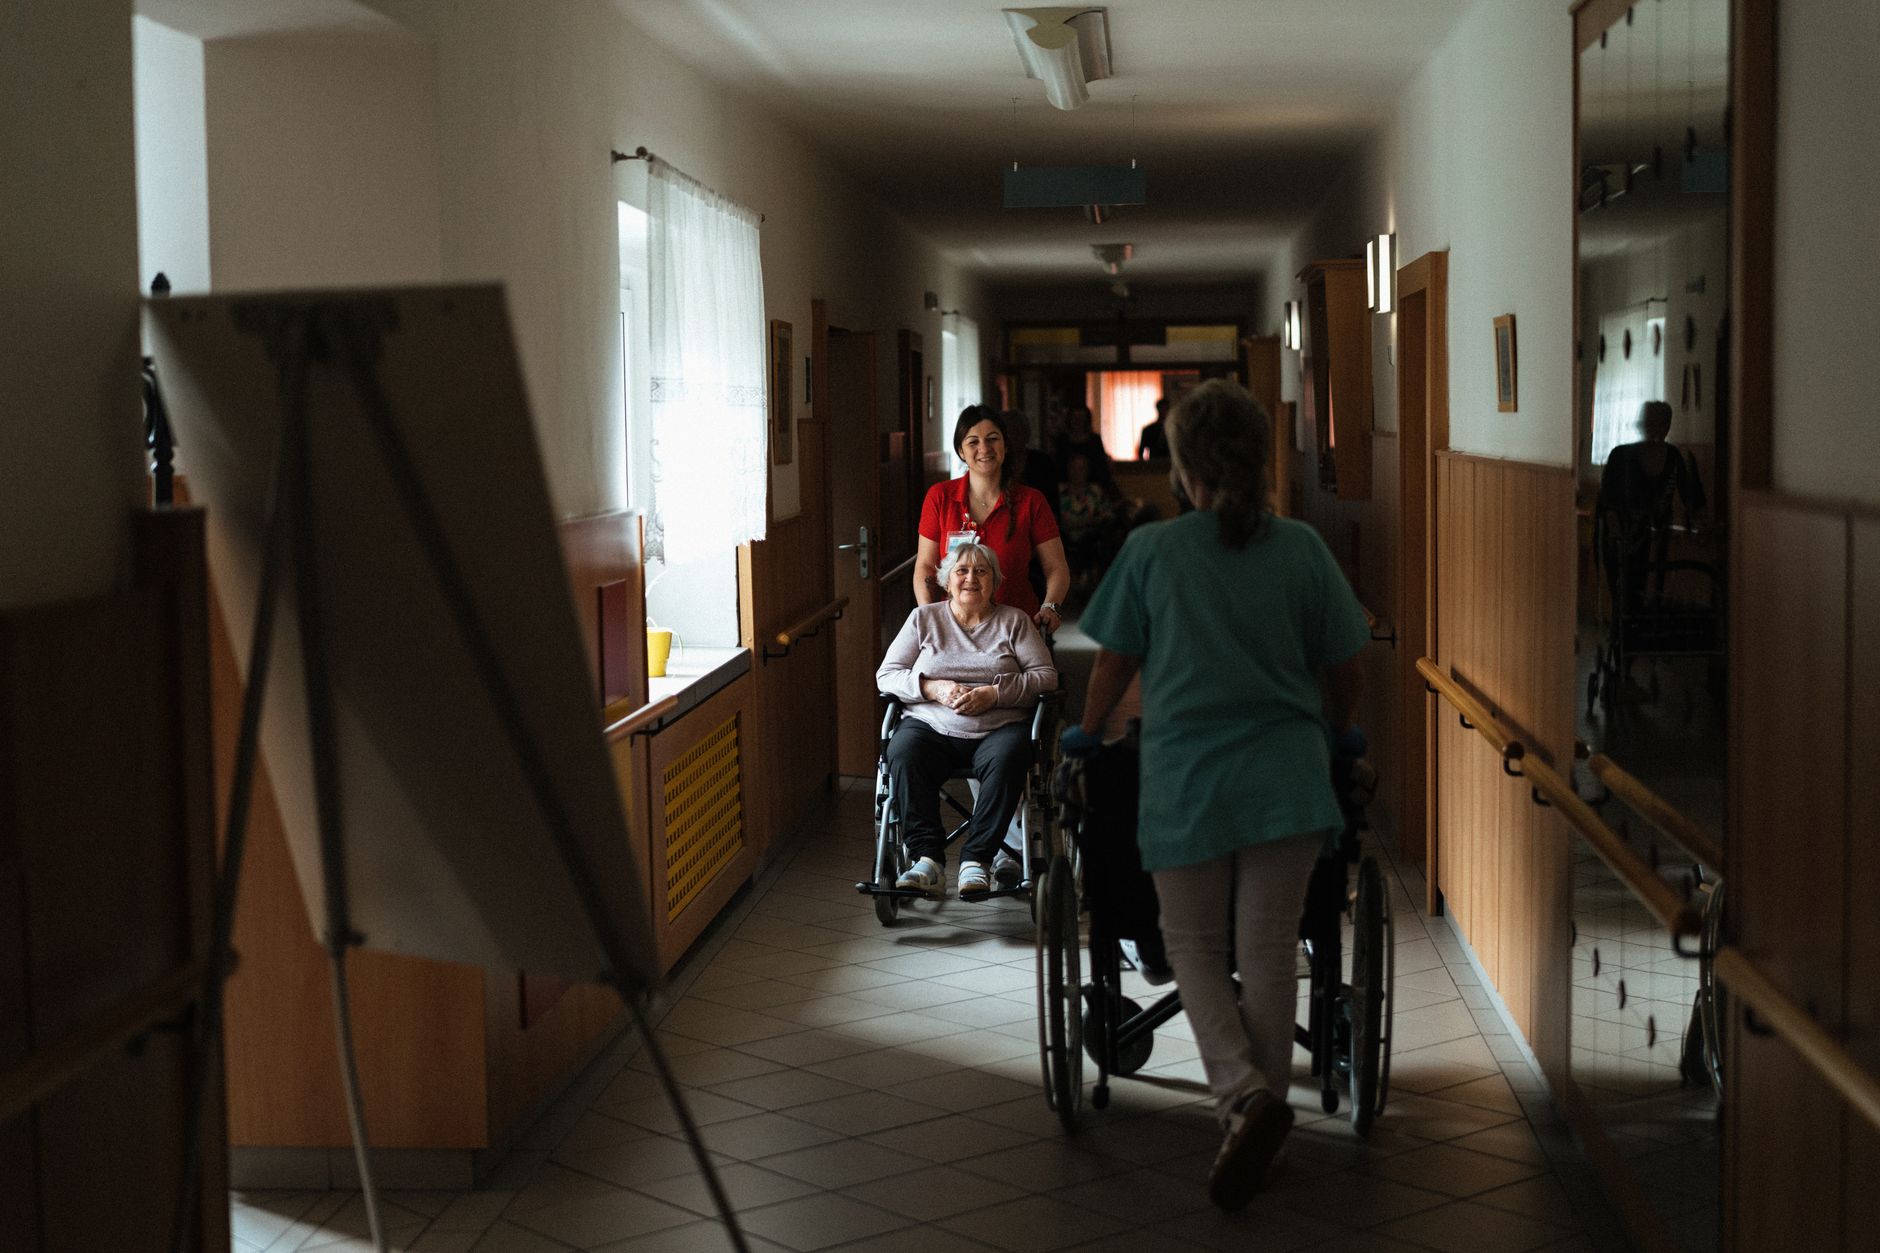
Turnover is high in the roles that do the carrying. The Hospital & Healthcare Compensation Service 2025 Assisted Living report, as published by Senior Housing News, put total assisted living turnover at 34.53 percent in 2025. Resident assistants and personal care aides ran at 43.25 percent, and certified nursing assistants at 40.59 percent.
The Ziegler July 2026 CFO Hotline survey reports average total workforce turnover of 36.3 percent in 2025 and 35.4 percent in 2026, with dining staff turnover at 40.0 percent in 2026. When a shift opens, its carrying work falls to whoever stays, so freed hours matter most in the months after a resignation.
The scale of the workforce is large. According to the BLS Economics Daily, nursing assistants employed nearly 1.4 million people in May 2024, and nursing care facilities employed about 492,000 of them. Those national totals describe a job that repeats on every shift at every site, so a routine change that saves a few trips per shift is worth testing.
How does the delivery robot ROI math work?
The calculation has three parts. The first is the hours the robot takes over: the number of tray and meal runs per shift, multiplied by the share of those runs the robot realistically handles, multiplied by the time each run takes a person. The second is the value of those hours, priced on the government wage data on this page for waiters and waitresses, because meal and tray running is that kind of work. The third is the fixed robot lease payment, which is set in the quote after the site assessment.
The offset is the value of the hours taken over, and the net return is that offset minus the lease cost across the lease term. The calculator shows a low and a high case because the run counts and the share a robot takes are estimates until measured. The range moves with the site, and it is not a promise.
Linen and supply carrying also returns caregiver time, but the savings range prices only the meal and tray hours. Linen and supply runs appear as benefit in hours, not as savings, which keeps the figure easy to check. Use the same method when you compare sites so the numbers stay comparable.
What changes the number up or down?
The largest driver is the share of runs on fixed routes. A site with a steady stream of tray runs between one kitchen and several wings gives the robot most of its work, while scattered one-off requests save much less. The calculator reflects this through the run share, so a change in routine moves the range more than a small change in headcount.
Building layout comes next. Long straight corridors, elevators the robot can use, and doors that open on a signal or stay open all help. Many manual doors, tight turns and multiple floors cut the share of runs the robot can take without staff help, and each added handoff lowers the return.
Where are robots already running in senior dining?
Adoption is growing among larger operators, but the numbers are older than they look. A LeadingAge LZ 200 survey of the largest not-for-profit providers, using 2022 data, found that 57 percent had implemented robotic process automation and 43 percent had added physical robotics. Treat those figures as a direction, not as today's share.
Operator reports from 2024 and 2025 describe dining robots in senior communities as well. Those are individual sites rather than a national count, so they show that the work is possible, not how common it has become. For your decision, the useful test is whether your own routes match what those sites ran.
Who does each job better, the robot or the person?
The robot and the aide do different jobs well. The robot is steady on the same route at the same pace, and it repeats a run across a shift without slowing. A person is better at anything that needs judgment, touch, or attention to a resident.
The comparison below is direct about where people win. A tray run is easy to automate, but a resident who is not eating, a spill in a doorway or a change in mood is not. The robot's role is to carry, and the person keeps the care.
- Repeated tray runs on one route
Delivery Robot
Same route and same pace, with no breaks across the shift
Staff
Flexible, but slows and gets pulled away on repeat trips
- Helping a resident who needs help eating
Delivery Robot
Cannot do it
Staff
Does it, and notices when something is wrong
- Noticing a change in a resident
Delivery Robot
No awareness of the resident
Staff
Wins here: observes mood, pain and appetite
- Spills and blocked doorways
Delivery Robot
Stops, reroutes or waits, and needs staff to clear it
Staff
Handles it directly
- Elevator and door timing
Delivery Robot
Depends on integration with the building
Staff
Opens the door and rides the elevator
What are the risks to the return, and how do you avoid them?
The first risk is that freed hours go unused. If a robot takes the carry runs but staff still walk the same routes out of habit, the return is close to zero. Write the new routine before go-live, assign the freed time to named care tasks, and track hours in the first months.
The second risk is that the robot changes the route without reducing the physical load of care. Public Citizen's summary of 2016 BLS data reports a total injury rate of 337 per 10,000 nursing assistants, against 100 across all occupations. Most direct care injuries come from lifting and repositioning residents, which a robot does not do. Keep lifting protocols in place and do not treat the robot as an injury control.
The third risk is integration. A robot that cannot use a door or elevator on its route stalls the run, so mapping and integration come before go-live, not after. We map the site, integrate the robot with the building, train staff, provide go-live support and service the unit nationwide. The lease is financed, and the quote follows the assessment.
How long until payback, and how do you get an exact figure?
The path to payback runs in stages, not on a fixed calendar. It starts with a free site assessment, where route lists, floor counts, door and elevator access and run counts are gathered. The lease quote follows that assessment, so the payment reflects the building you actually have, and the savings range is built on your runs rather than on averages.
Next comes deployment and integration: mapping, connecting to doors and elevators where needed, training the staff who load and call the robot, and go-live support while the new routine settles. Payback arrives when the hours the robot takes over, valued on the government wage data on this page, cover the fixed lease payment over the term. Measured hours from the first months replace the estimate.
To get a precise figure, request the free site assessment with your route list and floor count ready. You will receive a lease quote after the assessment, with robot lease financing, and a savings range built on your site. We pick the robot that fits your floor, deploy and integrate it, train your staff and service it nationwide.
Frequently asked questions
Want a delivery robot at your senior living community?
Tell us about your site. We will recommend the robot, quote the lease, and keep it serviced.