
The short answer
Delivery robot ROI for stadiums comes mainly from food and supply runs between loading docks and concession stands on event days, when crews are stretched and the corridors are busiest. The return is a savings range set by how many of those hours the robot realistically takes over, what the lease costs, and how many events the venue hosts. A free site assessment turns that range into a quote for your venue.
Key takeaways
- Stadium return is concentrated on event days, when supply runs and food delivery peak.
- The savings range depends on the share of runs the robot takes, not on the robot alone.
- Route length, event frequency and shift fill rates move the number more than anything else.
- Payback is judged against the lease quote from a site assessment, not a headline figure.
- Starting with one leased unit on the busiest route lets you measure results before expanding.
Run the numbers for your site
Pick your city or state for a real regional number - we use the real BLS wage there. (On the live site this auto-detects from your location.)
What do you want to automate?
The robot walks the repetitive trays; staff stay with guests and tables.
How much return can a stadium expect from a delivery robot?
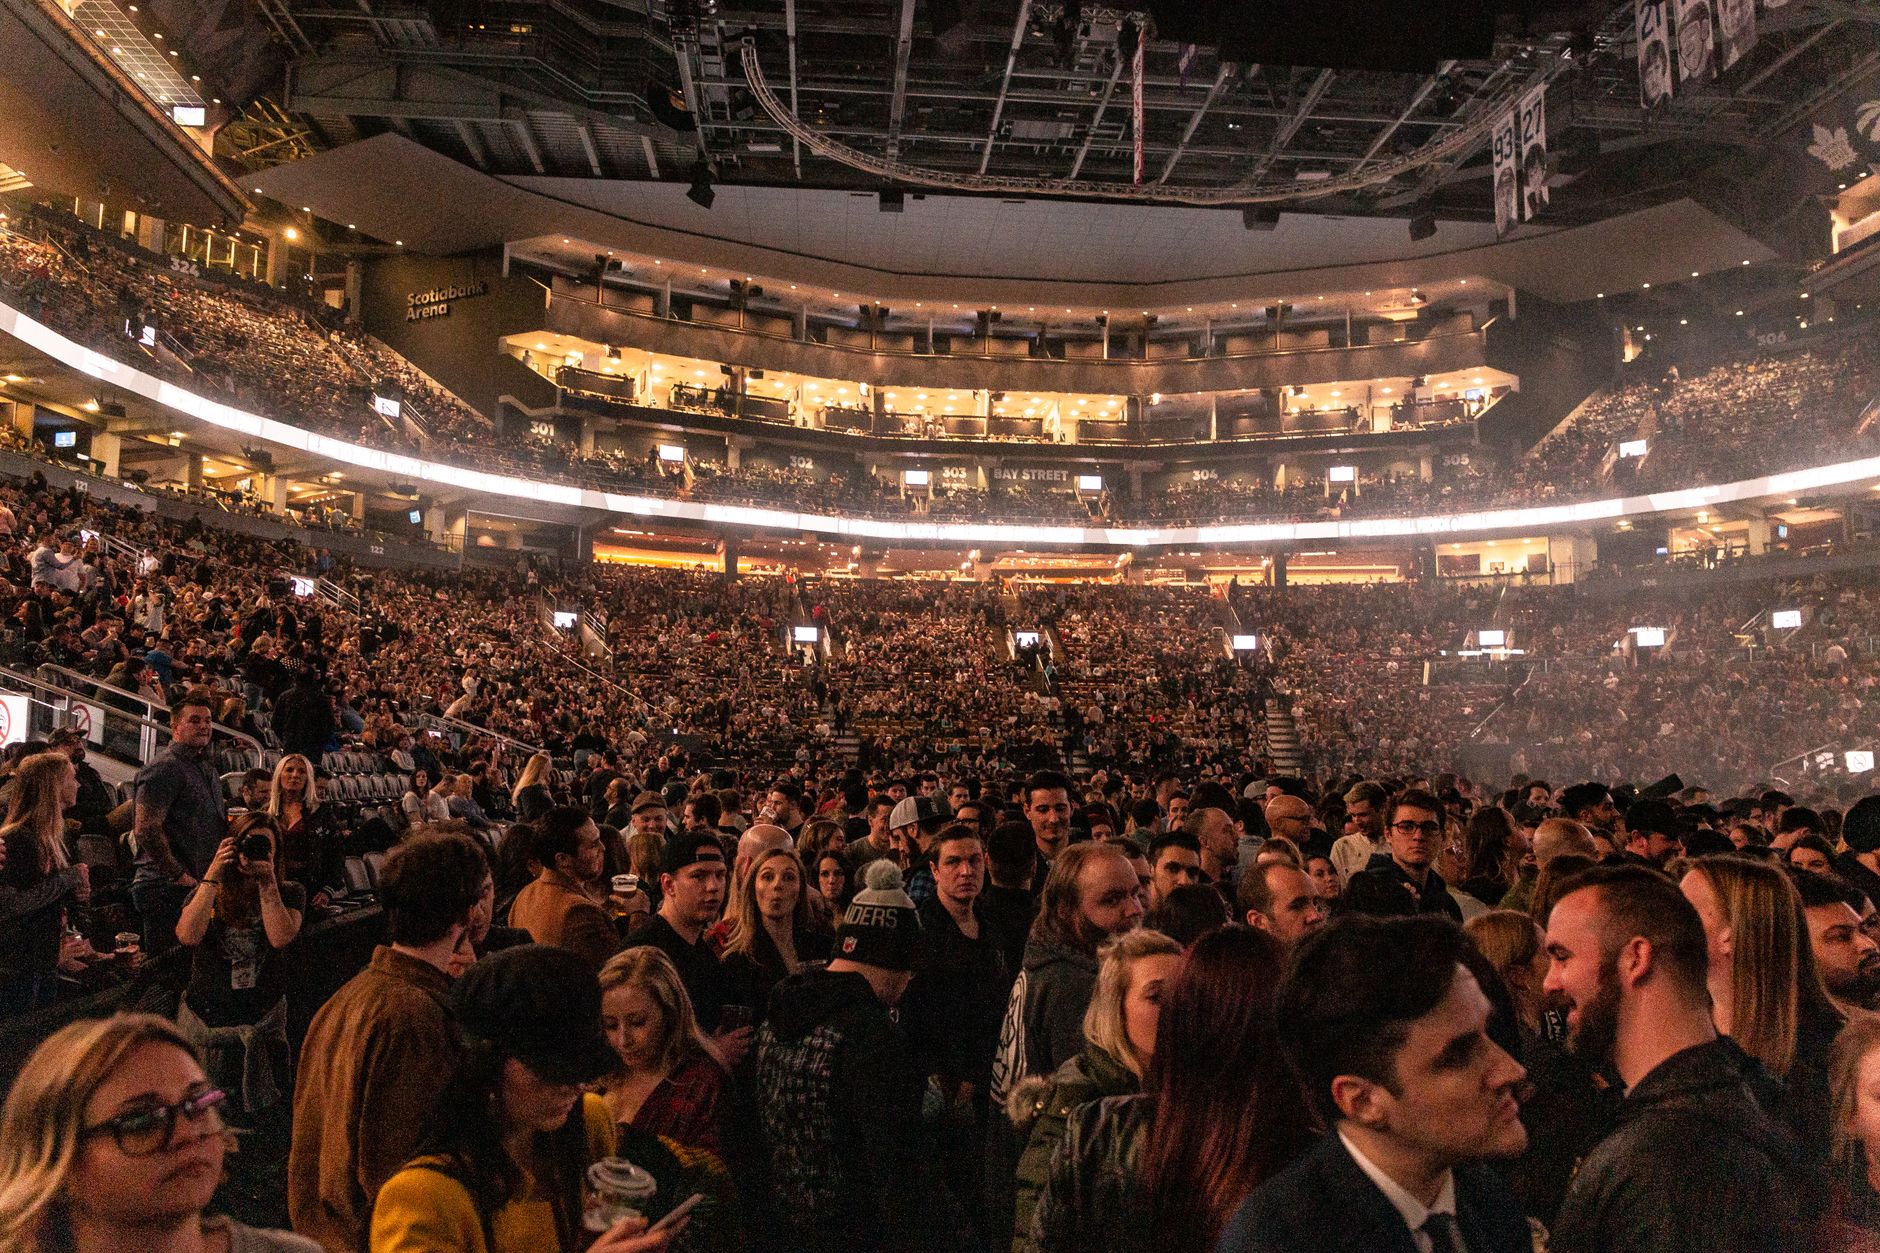
Delivery robot ROI for stadiums is a range, not a single figure. The return comes from the hours of supply and food running a robot takes over between loading docks and concession stands, counted on the days the venue actually hosts events. Those days are unevenly spaced, so the value sits in a small number of high-demand windows rather than across a steady week.
The size of the market helps frame the opportunity. According to a Cal Poly housing office summary, an informal estimate puts major professional stadiums (NFL, MLB, NBA, NHL and MLS) at about 200 to 300 venues, with thousands more if minor league and other venues are counted. A separate count in the same source reports 217 stadiums with 30,000 seats or more, but it uses a higher threshold, so the two should not be compared directly.
Where do supply and food runs happen in a stadium?
The work sits between the dock and the stands. Cases of beverages, condiments, napkins and packaging move from a receiving area through service corridors to the stands, and empty cases and waste move back. On event days those corridors fill with guests, so the runs slow down exactly when demand peaks.
Staffing needs are large for a single night. A CMM bidding guide estimated 61 cleaning staff for a 20,000-attendance game and said twelve workers could clean 125 suites in eight hours. A TempGuru guide, a vendor estimate rather than government data, suggests about 1 staff member per 100 attendees for standard stadium events, about 1 per 40 for full-service events and about 1 per 25 in high-traffic zones.
Median hourly wage, Waiters and Waitresses
$3,798
Monthly cost of one full-time worker, at the median wage plus payroll costs (an estimate, not a quote).
Where does the return come from on event days?
The return comes from three kinds of work: pre-event stocking, in-game food and supply runs, and post-event supply and waste movement. Each has its own timing. Stocking happens before doors open, runs peak during service, and the post-event window is the longest, because the building has to be reset for the next day.
The post-event window is long and labor heavy. According to Janiking, about 120 people worked four to six hours to clean the seating bowl, concourse and locker rooms of a college stadium, and another venue needed a crew of 50 or more for about eight hours. A custodial RFP response for a football stadium set the shift at 8 hours, with cleaning starting right after the event. A university stadium manager has said crews begin restrooms about two hours after the game and work through the night. Cleaning itself is not the robot's work. The robot's share is the supply and waste movement that runs alongside those crews.
How does the savings math work?
The calculator on this page runs four steps. It starts with the hours of waiter and waitress type work in the venue, meaning food and supply running. It then applies the share of those hours a robot realistically takes over, which is less than all of them, because some runs need a person for stairs, heavy loads or crowd moments. It prices those hours using the government wage data on this page for waiters and waitresses, then subtracts the lease and service cost. The result is a band, not a promise.
The share matters more than most first estimates assume. A robot on a long route with many stands takes a larger portion of the work than one on a short, crowded route, and the offset follows that share. Setting the share from a route survey is the most useful part of the assessment, because it turns a general estimate into a number you can check against your own schedule.
- Peak crowd runs
Delivery Robot
follows a planned path and avoids fixed obstacles, but slows in dense crowds
Staff
moves around crowds, changes route on the fly and can open a door or call for help
- Repeated fixed route
Delivery Robot
runs the same path each time without fatigue
Staff
can do it, but the work is tiring over long shifts
- Heavy or bulky loads
Delivery Robot
limited by payload and by stairs or elevator access
Staff
handles heavy, awkward or stacked loads more easily
- Judgment at the stand
Delivery Robot
cannot read a situation or handle a guest complaint
Staff
handles the stand, the guest and the exception
- Hours of availability
Delivery Robot
runs when scheduled, without breaks
Staff
depends on shifts, breaks and attendance, and turnover is a constant cost
What changes the number up or down?
Route length and the number of stops matter most. A long corridor with many stands gives the robot more runs to take. Event frequency matters next, because a venue that hosts events every week spreads the setup cost over far more earned hours than one that hosts a handful of large games each year.
Staffing conditions move the number too. When shifts are hard to fill, the labor offset grows, but so does the risk of an empty shift, so the plan needs a backup for the days the robot is down. Schedule slack matters as well, because the last night of an event often runs late, and a fixed route has to be built with that overrun in mind.
What are the risks to the return, and how do you avoid them?
The first risk is underuse. A robot sized for a full season but idle through many events will not return what the calculator projected. Avoid this by setting the event calendar and route survey before signing, and by starting with one leased unit on the busiest route.
The second risk is safety around people. The BLS industry profile for amusement, gambling and recreation reports a total recordable case rate of 3.3 per 100 full-time workers. That is an industry figure, not a robot figure, but it shows why crowd-facing corridors need routing rules and staff who know the robot's path. Use marked lanes, clear route rules and a short staff briefing before each event.
The third risk is a gap in coverage. Ask for spare unit coverage and on-site dispatch in writing, and confirm how quickly a unit is replaced if one goes down during a game.
What is a realistic timeline from assessment to payback?
The timeline runs in phases rather than fixed dates. The first phase is the site assessment and mapping, followed by a lease quote with service. The second phase is route setup, integration and staff training, which should be finished before the first event the robot will serve. The third phase is go-live on a single route, measured across several events before any expansion.
Payback depends on event count and route use. A venue with a dense calendar sees the return build faster than one with occasional events. Judge the first season on measured runs and labor hours, then decide whether to add units. Expansion decisions are far easier once the route data is in hand.
How do I get a precise figure from a free site assessment?
Gather the basics before the visit. Bring the event calendar with typical attendance by game, floor plans marking docks, stands and elevators, the number of staff who run supplies today, and any corridor restrictions. These inputs let the assessment set the robot share and the savings range for your venue.
The assessment maps the corridors, times representative runs and sets the robot share for each route. Service Robot Co. then selects the robot for the site, quotes a lease through financing with service, and handles deployment, integration, staff training and nationwide service. The payment appears in that quote, not on this page. The savings range shown here can then be rerun with your numbers.
What happens to the staff on event days?
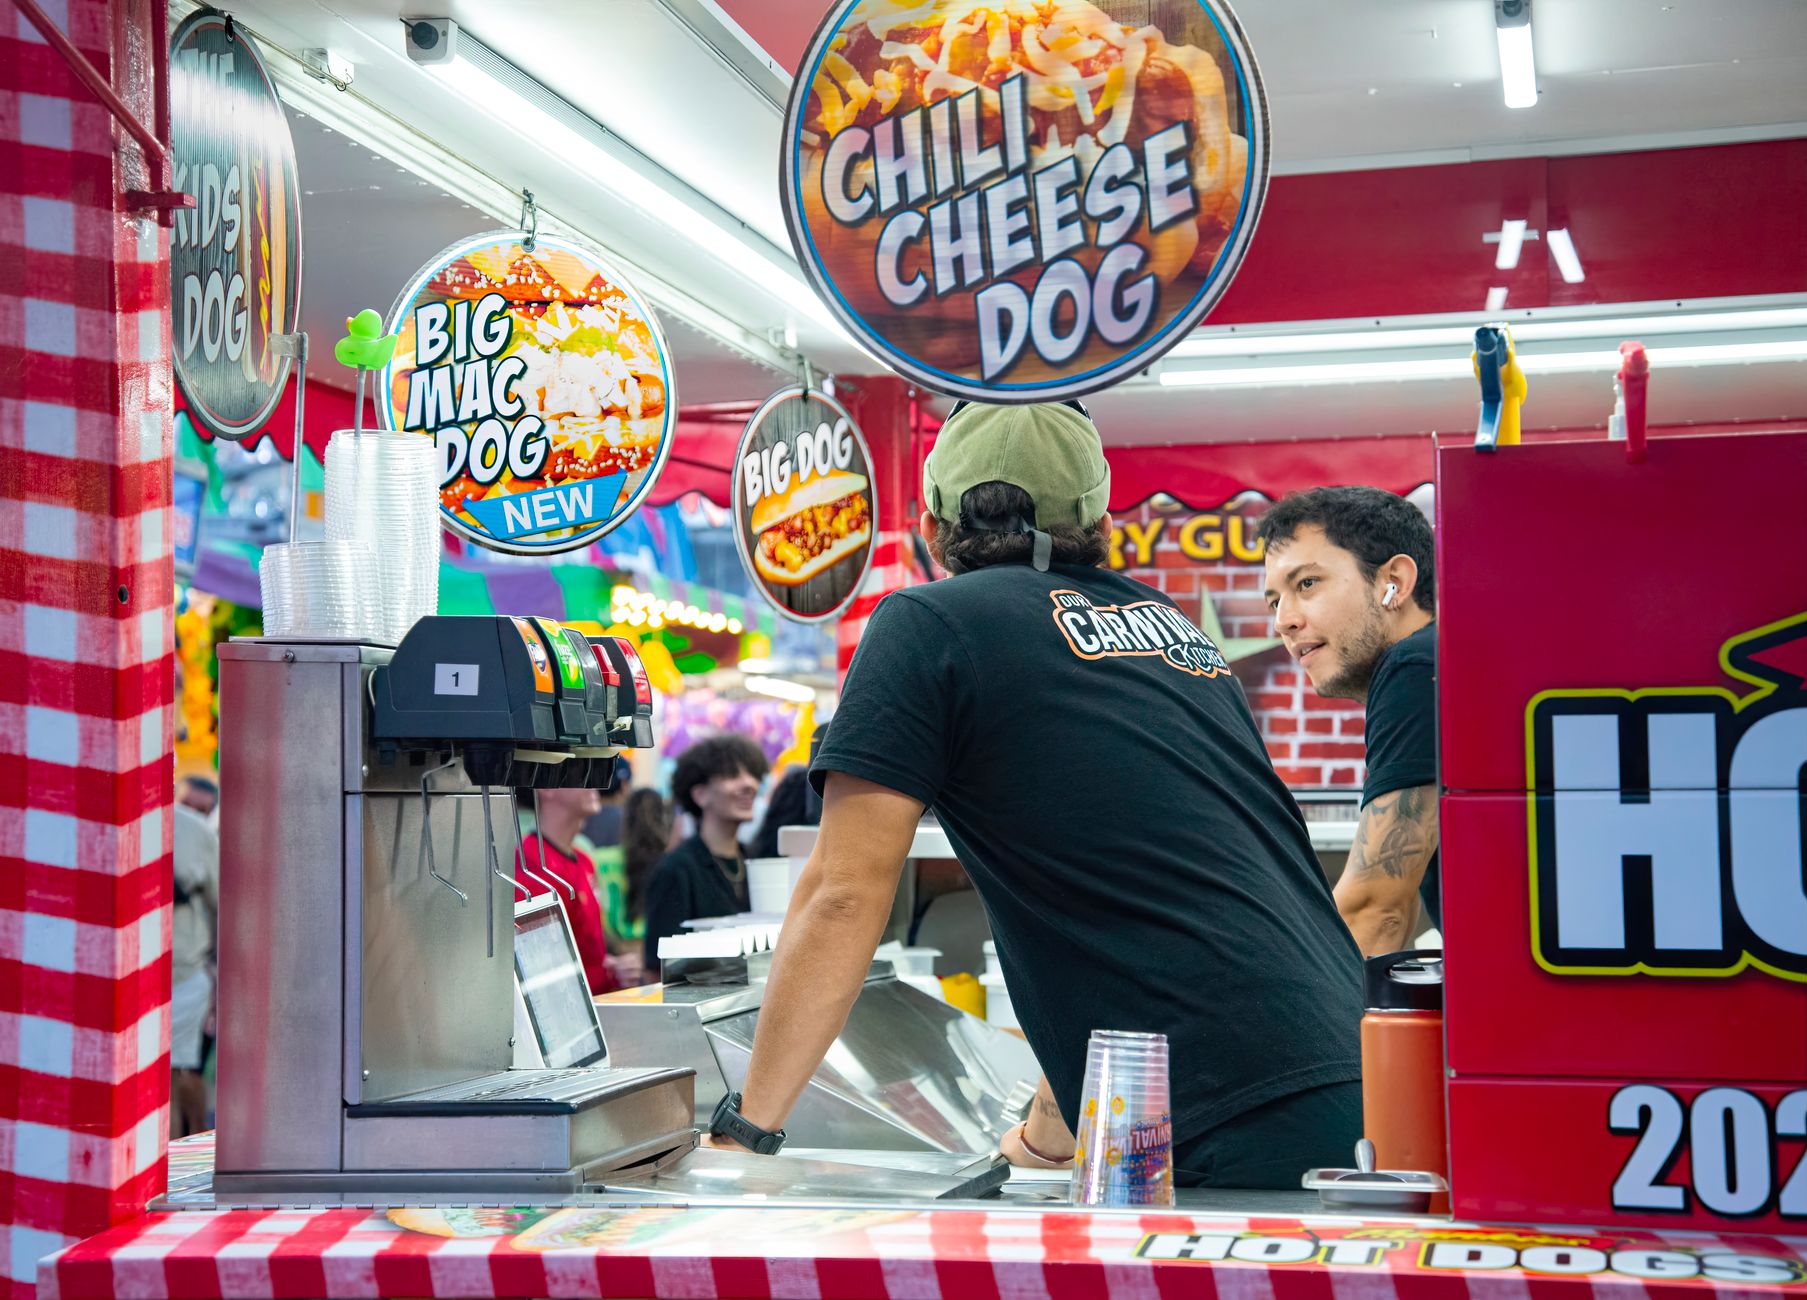
The robot takes supply and food running off the crew's plates. Staff keep the work that depends on judgment and contact, including stand service, guest questions, cleanup and exceptions. A vendor estimate puts stadium staffing at 50 to 200 or more workers per game, so the robot is one tool within a large operation, not a replacement for the team.
The labor market for this kind of work is large and slowly shrinking. The BLS Occupational Outlook Handbook reports 2,329,700 waiter and waitress jobs in 2024 and projects employment to decline 1 percent from 2024 to 2034. That outlook is national rather than stadium specific, so the labor offset should be judged on the venue's own shift fill rate.
Frequently asked questions
Want a delivery robot at your stadium?
Tell us about your site. We will recommend the robot, quote the lease, and keep it serviced.
Sources
- US Bureau of Labor Statistics, Occupational Employment and Wage Statistics (OEWS May 2024)
- Cal Poly Grand Avenue Housing: how many stadiums are in the US
- Brilliant Maps: largest stadium by capacity in each US state
- TempGuru: how to staff a stadium
- CMM: bidding on stadiums and sports venues
- Janiking: stadium cleaning crews
- Stadium custodial RFP responses to questions
- BLS Occupational Outlook Handbook: waiters and waitresses
- BLS: nonfatal injuries and illnesses by industry