
The short answer
Drone ROI for hydroelectric dams comes mainly from fewer hours of crew time on hazardous walk-downs of dam faces, spillways and penstocks, plus faster engineering review of imagery. The savings are a range that depends on how many of those hours the drone realistically takes over on your site, and the calculator on this page shows that range. A lease quote follows a free site assessment, which replaces the range with figures from your own inspection log.
Key takeaways
- Dams are a large, spread-out asset: the Federal Energy Regulatory Commission oversees over 2,500 dams used for hydropower.
- The return comes from hazardous walk-down hours the drone takes over, not from cutting the team.
- Penstocks and spillways are the strongest candidates, but their time savings must be measured on your own structure.
- Savings are a range that moves with inspection frequency, access difficulty and how much of each task the drone takes.
- A free site assessment turns the range into a lease quote built on your numbers.
Run the numbers for your site
Pick your city or state for a real regional number - we use the real BLS wage there. (On the live site this auto-detects from your location.)
What do you want to automate?
The unit runs the repetitive patrol and watch; guards handle the judgment calls.
What is drone ROI for hydroelectric dams?
Drone ROI for hydroelectric dams is the return an owner or operator gets when aerial and penstock imagery takes over part of the hands-on checks on a dam, its spillways and its water conveyance. The scale of the setting is large. According to the Federal Energy Regulatory Commission's Division of Dam Safety and Inspections, FERC oversees over 1,650 licensed and exempt hydropower projects, including over 2,500 dams. The Government Accountability Office makes a similar point in GAO-19-19, stating that FERC oversees over 2,500 dams used for hydropower.
The people doing the work are fewer than they used to be. The Bureau of Labor Statistics reports that hydroelectric employment fell from 69,346 in 2001 to 5,821 in 2014, and that the decline accounted for more than half of the job losses in electric power generation over that period. A smaller bench often means that each remaining operator carries more of the inspection calendar. That pressure is where drone imagery starts to earn its place, because it moves some of the work off the crew and onto a schedule the team can plan.
A useful return case starts from the hours the site already spends on foot, rope or lift access. The rest of this page explains how to measure those hours, how the calculator turns them into a savings range, and what to check before a lease is signed.
Where on a dam does a drone save the most time?
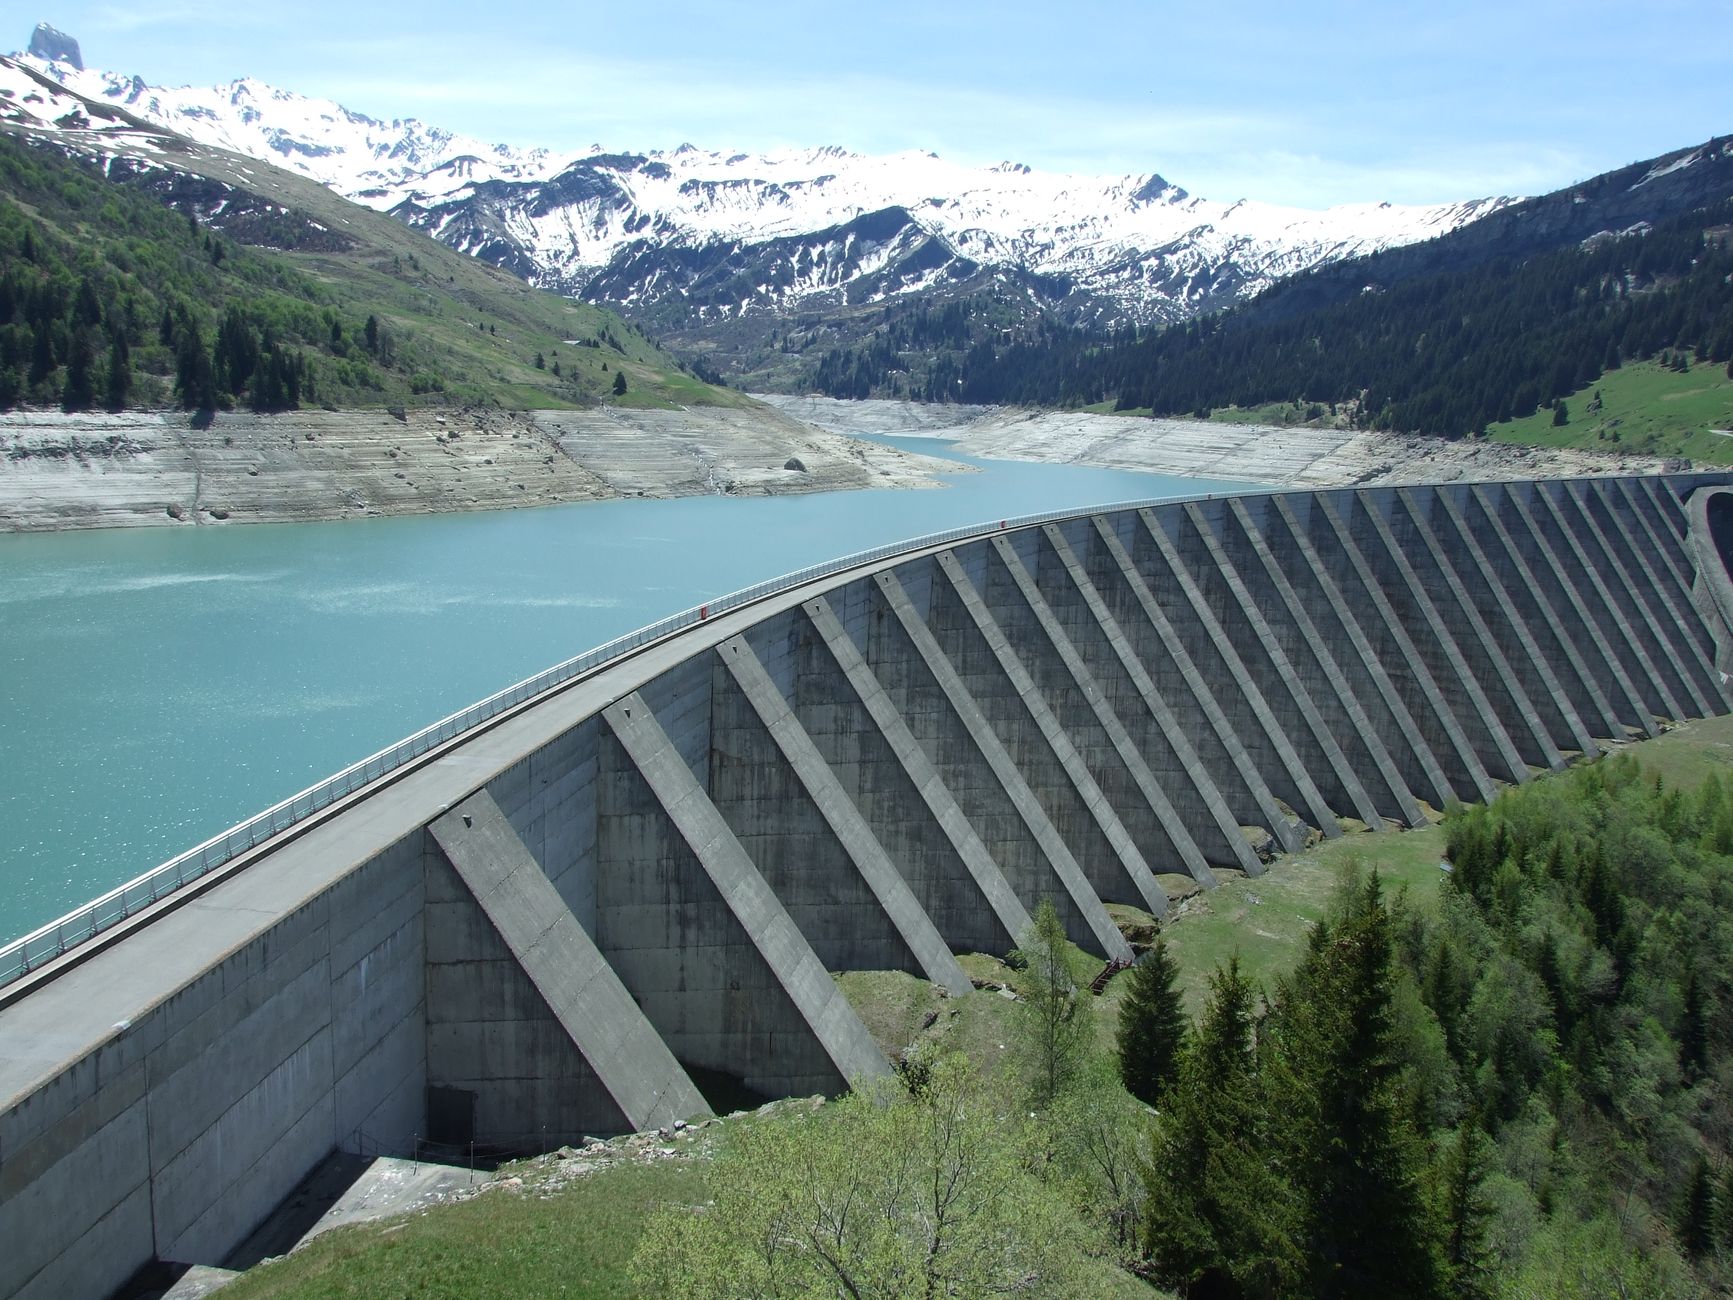
Dams concentrate hazardous inspection work in a few places: the concrete face and crest, the spillway gates and chute, the intake structure, the abutments where the dam meets the valley walls, the downstream toe, and the penstock that carries water to the turbines. Most of these need rope or lift access on the face, or a crew moving through confined and wet spaces. Those are the locations where walk-downs use the most crew hours and carry the most exposure.
Penstocks are a strong candidate for a drone. The ASCE Infrastructure Report Card describes a penstock inspection drone that flies into the pipe semi-autonomously and captures video. According to that description, the approach avoids dewatering the penstock and avoids placing scaffolding in dark, slippery conditions. The description is qualitative and gives no time figure, so the hours saved on your penstock still have to be measured on your own structure.
The face and spillway are different. Imagery of the concrete face lets engineers review cracks, seepage stains and surface deterioration from the office, while a crew may only check the same areas once per cycle. The gates and chute are often inspected from a platform or a crane, so the drone's value there is mostly in reducing access work and speeding up the review. The map below shows the six zones where drone capture typically applies.
Median hourly wage, Security Guards
$4,317
Monthly cost of one full-time worker, at the median wage plus payroll costs (an estimate, not a quote).
How does the drone ROI math work?
The return is built from three parts. The first is crew hours that move from walk-downs and access work to flight and capture. The second is engineer hours that move from site visits to office review of imagery. The third is the lease cost of the aircraft, its service and its training. Savings come from the first two, minus the third. A simple version is hours avoided each cycle, multiplied by the share of each task the drone realistically takes over, multiplied by the hourly value of that work, then minus the lease cost for the same period.
The labor side is priced on the security guard type of work. On a dam, the hours that a drone can take off the operators' plates are mostly visual checks and perimeter watch across the grounds, the kind of work the security guard job covers. The drone takes that work off operators' plates, and the government wage data on this page sets the hourly value for it. Where the people who mainly work the dam are operators or engineers, we do not price their time. The calculator counts only the security guard type of work the drone takes over, which keeps the figure tied to one published wage.
The share matters more than most buyers expect. A drone rarely takes over a whole walk-down. It usually captures the imagery and the access-heavy views, while a person still performs any check that the dam safety program requires in person. The share is set during the assessment for each task, and the savings range on this page is a range, not a promise. Change the share and the range moves, which is why the assessment measures it rather than assuming it.
How much time does a dam inspection really take?
The honest answer is that the research behind this page found no government or trade association figure for hours saved on dam inspections. Vendor material gives direction without a measured basis. A drone vendor's dam wall and spillway page says automated programs can cut survey time from tens of hours to a fraction of that, but it gives no measured figure to check against.
A reseller blog on penstock inspection reports that a European hydro operator reduced penstock inspection time by 80 percent, and it describes the change as 12 days cut to 2 days. The source does not confirm how that figure was measured, so treat it as a hypothesis to test rather than a planning number. Those two figures also describe the same change in different terms, which is a reason to ask for the baseline behind any vendor claim.
The most useful step is a short pilot. Log the crew hours for one walk-down on one structure, including access setup, the inspection itself and the write-up. Then fly the same structure with the drone, log the review time, and compare the two. That single comparison produces the measured hours that the calculator needs, and it is more reliable than any published percentage.
How many people staff a dam inspection?

Government data counts the hydroelectric industry, not the crew on a single dam. The Bureau of Labor Statistics May 2020 estimate for hydroelectric power generation under NAICS 221111 shows total employment of 6,060. Power plant operators, distributors and dispatchers were the largest occupation, at 2,040 workers, with a relative standard error of 22.4 percent for that occupation. The May 2023 estimate for the same industry shows total employment of 7,930, so the industry count rose between those two estimates.
Those counts describe the whole industry, not how many people stand on a dam during an inspection. The research found no published per-site headcount for dam inspections. For planning, this page uses two people as the typical number doing this kind of work at one site, with one of them possibly acting as the flight operator. The assessment replaces that assumption with your actual roster and shift pattern.
The labor side of the math follows the same rule as before. The hours the drone takes over are priced on the security guard type of work, using the government wage data on this page. The people who mainly run the dam keep their roles, and the drone removes the access-heavy and repetitive checks that would otherwise take their time.
What changes the drone ROI up or down?
Three things move the number most: how many structures you inspect each cycle, how hard each walk-down is to reach, and how often the cycle repeats. A dam with several spillway gates and a long penstock has more hours to take over than a small dam with an easy face. Frequency multiplies everything, so a program that repeats the same walk-downs often gains more from each flight than one that inspects rarely.
Two things pull the number down. Imagery that engineers cannot use slows review, and slow review erodes the saving because the office hours grow. Weather and high water also cut the number of usable flight days, which stretches the cycle. Both problems can be fixed, but only if they are checked before the lease starts, which is why the checklist below is worth working through with your engineer.
The checklist below lists the factors to confirm before the assessment, with the reason each one changes the figure.
What are the risks to the return and how do I avoid them?
The biggest risk is counting hours that still happen. Dam safety programs may require some checks in person, so the return should include only the hours the drone actually takes over. Confirm with your dam safety engineer which items stay on foot before the first flight, and build the baseline on that list.
The second risk is weak imagery. Set capture standards before the pilot, including the views each engineer needs and the level of detail required to judge cracks, seepage and corrosion. Review the first set of images with the engineer who signs off the inspection, and adjust the flight plan before the routine is locked in.
The third risk is treating a vendor percentage as a fact about your dam. The penstock and survey figures in the research come from vendor material with unconfirmed bases. Measure your own baseline on one structure before using any range in a budget. Airspace rules and site access permissions also need to be cleared before a flight, and the assessment covers those questions.
How long until a drone pays back on a dam?
A typical path runs in stages. The free site assessment maps the structures, the access points and the current walk-down log. A pilot follows on one structure, usually the one with the highest access hours, and it runs through at least one full inspection cycle so the crew hours can be compared with the baseline. Only after that does the full schedule go live. Each stage produces a number the next stage depends on.
Payback depends on the baseline you measure and the lease quote that follows the assessment. The first cycle includes setup, crew training and the imagery standards, so the early months may show the smallest saving. The return usually becomes clearer once the routine is stable and the review workflow runs without rework. No payback month can be stated before the assessment, because the structure count and cycle length drive it.
The pilot should also test the handoff. Confirm who receives the imagery, how long review takes, and what happens when a flight is cancelled by weather. Those steps decide whether the saving holds across a full year.
How do I get an exact figure from a free site assessment?
The free site assessment produces the figure this page can only approximate. Bring the dam inventory, the current inspection schedule, the crew hours logged for each walk-down, the access constraints and the review workflow for imagery. From those inputs, the assessment maps the structures, identifies which checks the drone can take over and sets the share and hours for each task.
The lease quote follows the assessment. It is a fixed lease payment set for your site, and it can include service, training and nationwide support for the aircraft. Lease financing programs are available, and the quote shows the terms in full before any commitment. The savings range on this page updates with your numbers, so you can run it against the quote before deciding.
Preparing the inputs in advance shortens the assessment. The list below covers what to gather.
- The current inspection schedule for each structure, with the cycle length
- Crew hours logged for the last few walk-downs, split into access, inspection and write-up
- Access constraints for each zone, including rope, lift, confined space and water-level limits
- The review workflow for imagery, including who signs off and how long review takes today
Frequently asked questions
Want a drone at your hydroelectric dam?
Tell us about your site. We will recommend the robot, quote the lease, and keep it serviced.
Sources
- US Bureau of Labor Statistics, Occupational Employment and Wage Statistics (OEWS May 2024)
- Federal Energy Regulatory Commission, Division of Dam Safety and Inspections (via Hydro Leader)
- GAO-19-19, Government Accountability Office
- Bureau of Labor Statistics, Economics Daily: employment in electric power generation
- Bureau of Labor Statistics OEWS, NAICS 221111, May 2020
- Bureau of Labor Statistics OEWS, NAICS 221111, May 2023
- ASCE Infrastructure Report Card, penstock drone inspection
- Drone vendor dam wall and spillway inspection page (vendor-reported)
- Reseller blog on penstock inspection time reduction (vendor-reported)