
The short answer
Drone ROI for orchards comes mostly from catching disease and irrigation faults across acres before they spread, and from scouting blocks in a fraction of the time walking crews need. The realistic savings range depends on acreage, how often blocks need checking, how many flight days wind allows, and how many flagged areas a crew must still confirm on the ground. A free site assessment turns those inputs into a lease quote and a savings range for your orchard.
Key takeaways
- Early catches of disease and irrigation faults are where the return starts, not in mapping alone.
- Fixed-wing drones map 200 to 1,000 acres per hour before processing and ground checks, according to a UF/IFAS field trial update.
- Wind is the top concern farmers reported in the 2025 Iowa poll, so plan usable flight days, not the calendar.
- The savings range is priced on the government wage data for security guards, so only watch-and-check hours count.
- A lease quote comes after a free site assessment that sets acreage, flight days and the ground check rule.
Run the numbers for your site
Pick your city or state for a real regional number - we use the real BLS wage there. (On the live site this auto-detects from your location.)
What do you want to automate?
The unit runs the repetitive patrol and watch; guards handle the judgment calls.
What is drone ROI for orchards?
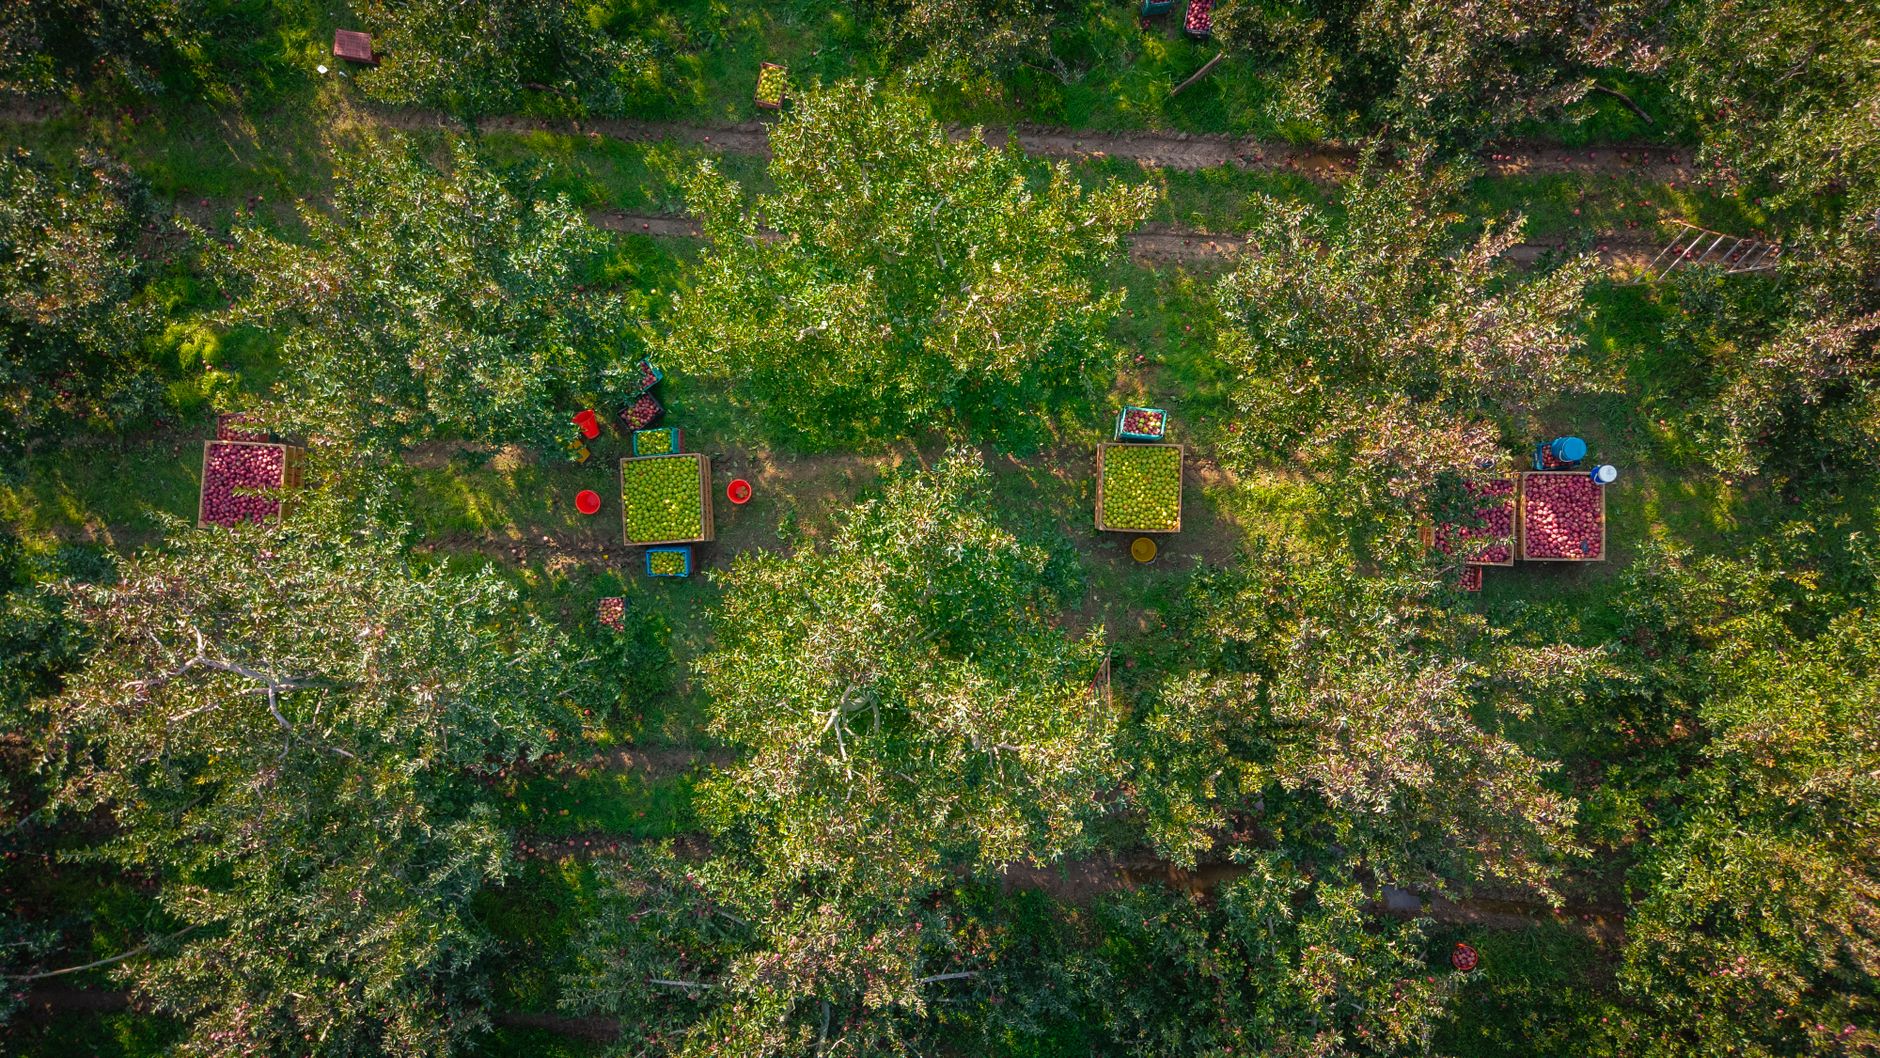
Drone ROI for orchards is the return a grower gets from aerial scouting, measured against the cost of leasing the aircraft and running the program. On a tree crop the payoff is less about pretty maps and more about timing. A problem found in one block this week is cheaper to treat than the same problem found after it has moved across the farm.
Walking crews see one block at a time, so a fast-moving disease or a failed irrigation zone can run ahead of them. Aerial imagery over tree rows lets a grower scout large acreage faster, which matters when a missed problem can cost a season's fruit.
This page explains where the return comes from, how the math is built, what moves it up or down, and how to get a precise figure. It names the source of every number and says where the research did not produce one.
Where does the return come from in an orchard?
Most of the return sits in two places. The first is catching disease early enough to treat a block rather than a whole farm. The second is catching irrigation faults before trees show stress. Aerial imagery can show patterns across the canopy that a crew reaches only by walking that row, and a flagged area sends the crew to the right spot first.
Disease detection from the air is still maturing, so a grower should prove it on their own blocks before counting it in the return. Irrigation work is steadier. A pass over a block can show uneven canopy color that points to a valve, emitter or pressure problem, and the saving is the water and fruit kept, plus the technician time not spent guessing which zone to check first.
The labor picture makes the timing more urgent. According to federal employment figures reported by VisaVerge, agricultural employment fell about 7% from March to July 2025, roughly 155,000 jobs, and growers reported leaving fruit on trees because of shortages. Fewer hands means fewer block walks, which raises the cost of a missed problem.
Median hourly wage, Security Guards
$4,317
Monthly cost of one full-time worker, at the median wage plus payroll costs (an estimate, not a quote).
How big is the scouting job on a real orchard?
Acreage sets the size of the job. In Yakima County, Washington, apples were among the top crops at 53,703 acres, according to a March 2024 report in The Columbian, and Grant County reported 61,627 apple acres. A single operation can spread blocks across several parcels, so a full walk becomes a multi-day route rather than a morning.
The best published timing benchmark comes from University of Florida IFAS work on citrus. Manual tree counts were estimated at two to four weeks for 1,000 acres. A disease or irrigation scout is not a tree count, so treat that figure as a sense of scale, not a quote for your blocks. Citrus Industry magazine's 2020 report on the same work says drone-based tree inventory brought at least a 50% saving in data collection cost and a 90% saving in data collection time, per UF/IFAS.
Flight speed is the other half of the picture. A quadcopter mapped an 11-acre grove section in a little under half an hour on two batteries, and fixed-wing drones map 200 to 1,000 acres per hour, according to a UF/IFAS field trial update. Those are mapping rates. They leave out image processing and the ground checks that confirm what the aircraft saw.
- Coverage speed
Drone
Fixed-wing aircraft map 200 to 1,000 acres per hour before processing, per UF/IFAS trials
Staff
Covers rows at walking pace, with speed set by block size, terrain and crew count
- Close inspection
Drone
Shows patterns across the canopy, not the lesion, insect or root up close
Staff
Examines leaves, trunks, roots and insects directly
- Wind and weather
Drone
Wind grounds flights, the top farmer concern in the 2025 Iowa poll
Staff
Keeps working on windy days when a flight cannot
- Repeat visits
Drone
Reflies the same blocks on a fixed schedule
Staff
Needs the crew scheduled back into each block
- Judgment
Drone
Flags areas but cannot decide the cause or the treatment
Staff
Decides cause and action with block history in mind
- Labor pressure
Drone
Covers acreage while the crew is short
Staff
Still needed to confirm flags and make every decision
How does the savings math work?
The math has four inputs. The first is the hours of watch-and-check work the aircraft takes over from the crew each season. The second is the share of that work a drone realistically handles, because flights cannot cover every block on every day. The third is the lease cost, which is quoted after a site assessment. The fourth is the value of faults caught early, in fruit kept and water saved. The savings range is the spread between a conservative and a fuller version of those inputs.
On the labor side, the savings figures are priced on the government wage data for security guards, shown on this page. That is a deliberate choice. The work a drone takes over is closer to patrol and observation than to pruning, thinning or harvest, so only watch-and-check hours count toward the offset, and hands-on orchard tasks stay out of the math. The headcount on this page is a planning assumption, since the research did not produce a verified figure for scouting crew size.
The lease is a fixed payment set by the aircraft, the term and the financing, with maintenance included in the program. Nothing on this page is a promise. Divide the lease across the season, net the hours offset against it, add the value of faults caught early, and the result is a range to test in a pilot.
What changes the number up or down?
Wind is the first limiter. In the 2025 Iowa Farm and Rural Life Poll from Iowa State University Extension, 22% of farmers reported using a drone or drone service provider, and flying in wind was the top concern reported. That is a state poll, not a national figure, but the constraint carries over to any open orchard. A block with fewer usable flight days earns less per season than the same block on a calm site.
Acreage per block and check frequency shift the number most. Frequent checks through bloom, fruit set and irrigation season add flights, and each flight pays only if its findings lead to action. Confirmation on the ground matters just as much. A map that flags stress but cannot be checked quickly hands the crew work without a clear decision.
Irrigation layout also moves it. Blocks with clear zone maps let a finding point to a specific valve or emitter, which shortens the fix. Blocks without zone maps need more confirmation walks, and that work eats into the offset.
What are the risks to the return, and how do you avoid them?
The first risk is a flag that turns out to be nothing. Canopy color varies for reasons unrelated to disease or water, so every flagged area needs a ground check before a spray or an irrigation change. Set a rule for which findings trigger a walk, and log which ones were confirmed. That log is the clearest proof the program is working.
The second risk is treating the drone as a replacement for crew judgment. Aerial imagery sees patterns across rows. A person sees the lesion, the insect or the root problem, and knows the history of the block. A program that cuts walking but keeps the same crew on the same trees will not shorten the time to a decision.
The third risk is safety, and it belongs in the math. The Bureau of Labor Statistics crop production profile reports a total recordable case rate of 4.1 per 100 full-time workers, with the year not stated on the page. A 2024 American Journal of Industrial Medicine article, carried on CDC Stacks, cites BLS data putting agriculture fourth-highest among major sectors for nonfatal rates in 2022, at 4.1 per 100 full-time equivalent workers. Less time walking rows may reduce exposure, but it does not remove the need for flight training, battery handling and crew briefings on the new work.
How fast does an orchard drone program pay back?
A realistic path runs in phases. The first is a site assessment that maps blocks, reads the flight window against local wind and sets the ground check rule. The second is a pilot across a few blocks for one season. The third is full rollout once the flag-to-confirm rate is known. Payback depends on how much of the season is covered and how quickly findings reach a decision, so the pilot sets the timeline more than the aircraft does.
Do not expect a full-season payback from the first flights. The early weeks go to setting routes, learning which days the wind allows, and training the people who read the imagery. Payback arrives once a catch saves a block that would otherwise have been lost, or once the hours offset covers the lease. The research did not produce a verified payback period for orchards, so this page gives none.
How do you get a precise figure for your orchard?
Service Robot Co. starts with a free site assessment. We pick the aircraft that fits your blocks, lease it through financing, deploy and integrate it, train your staff and service it nationwide. The assessment gathers acreage by block, the flight days lost to wind in a typical season, the ground check rule and the crew hours spent on watch-and-check work.
From those inputs comes the lease quote, with maintenance included, and a savings range rebuilt for your orchard rather than borrowed from an average. Ask for the flight-day assumption, the confirmation rate and the hours offset in writing. Then check each one against your own records from last season.
How solid are the figures behind this page?
Most of the orchard-specific research is still early. The UF/IFAS timing and cost estimates come from citrus, not apples, pears or stone fruit. The Iowa poll is state data. The mapping rates come from field trial updates, not from production scouting on a working farm. The research did not find a study that compares walking scouting hours per acre with drone scouting hours on an orchard.
Use these figures as benchmarks to test in a pilot, and give the lease quote the weight it earns after the assessment. Where a number was not published or not verified in the research, this page leaves it out.
Frequently asked questions
Want a drone at your orchard?
Tell us about your site. We will recommend the robot, quote the lease, and keep it serviced.
Sources
- US Bureau of Labor Statistics, Occupational Employment and Wage Statistics (OEWS May 2024)
- Farm Progress, 2025 Iowa Farm and Rural Life Poll
- Bureau of Labor Statistics, crop production injury profile
- University of Florida IFAS, AE575
- Citrus Industry magazine, high-tech scouting report
- UF/IFAS, high-throughput citrus drone field trials update
- VisaVerge, federal farm employment figures
- The Columbian, Yakima County farm acreage
- CDC Stacks, American Journal of Industrial Medicine 2024 article