Key takeaways
- Compare floor care only with peers of the same site type.
- Record shift length, zone count and foot traffic before you compare output.
- Spec-sheet coverage figures are ceilings, so time a real run on your floor.
- Crew benchmark ranges are vendor-reported, so confirm them before you cite them.
- A benchmark gap is a shortfall in hours inside your window, not a verdict on your crew.
Can a peer site show whether your floors keep pace?
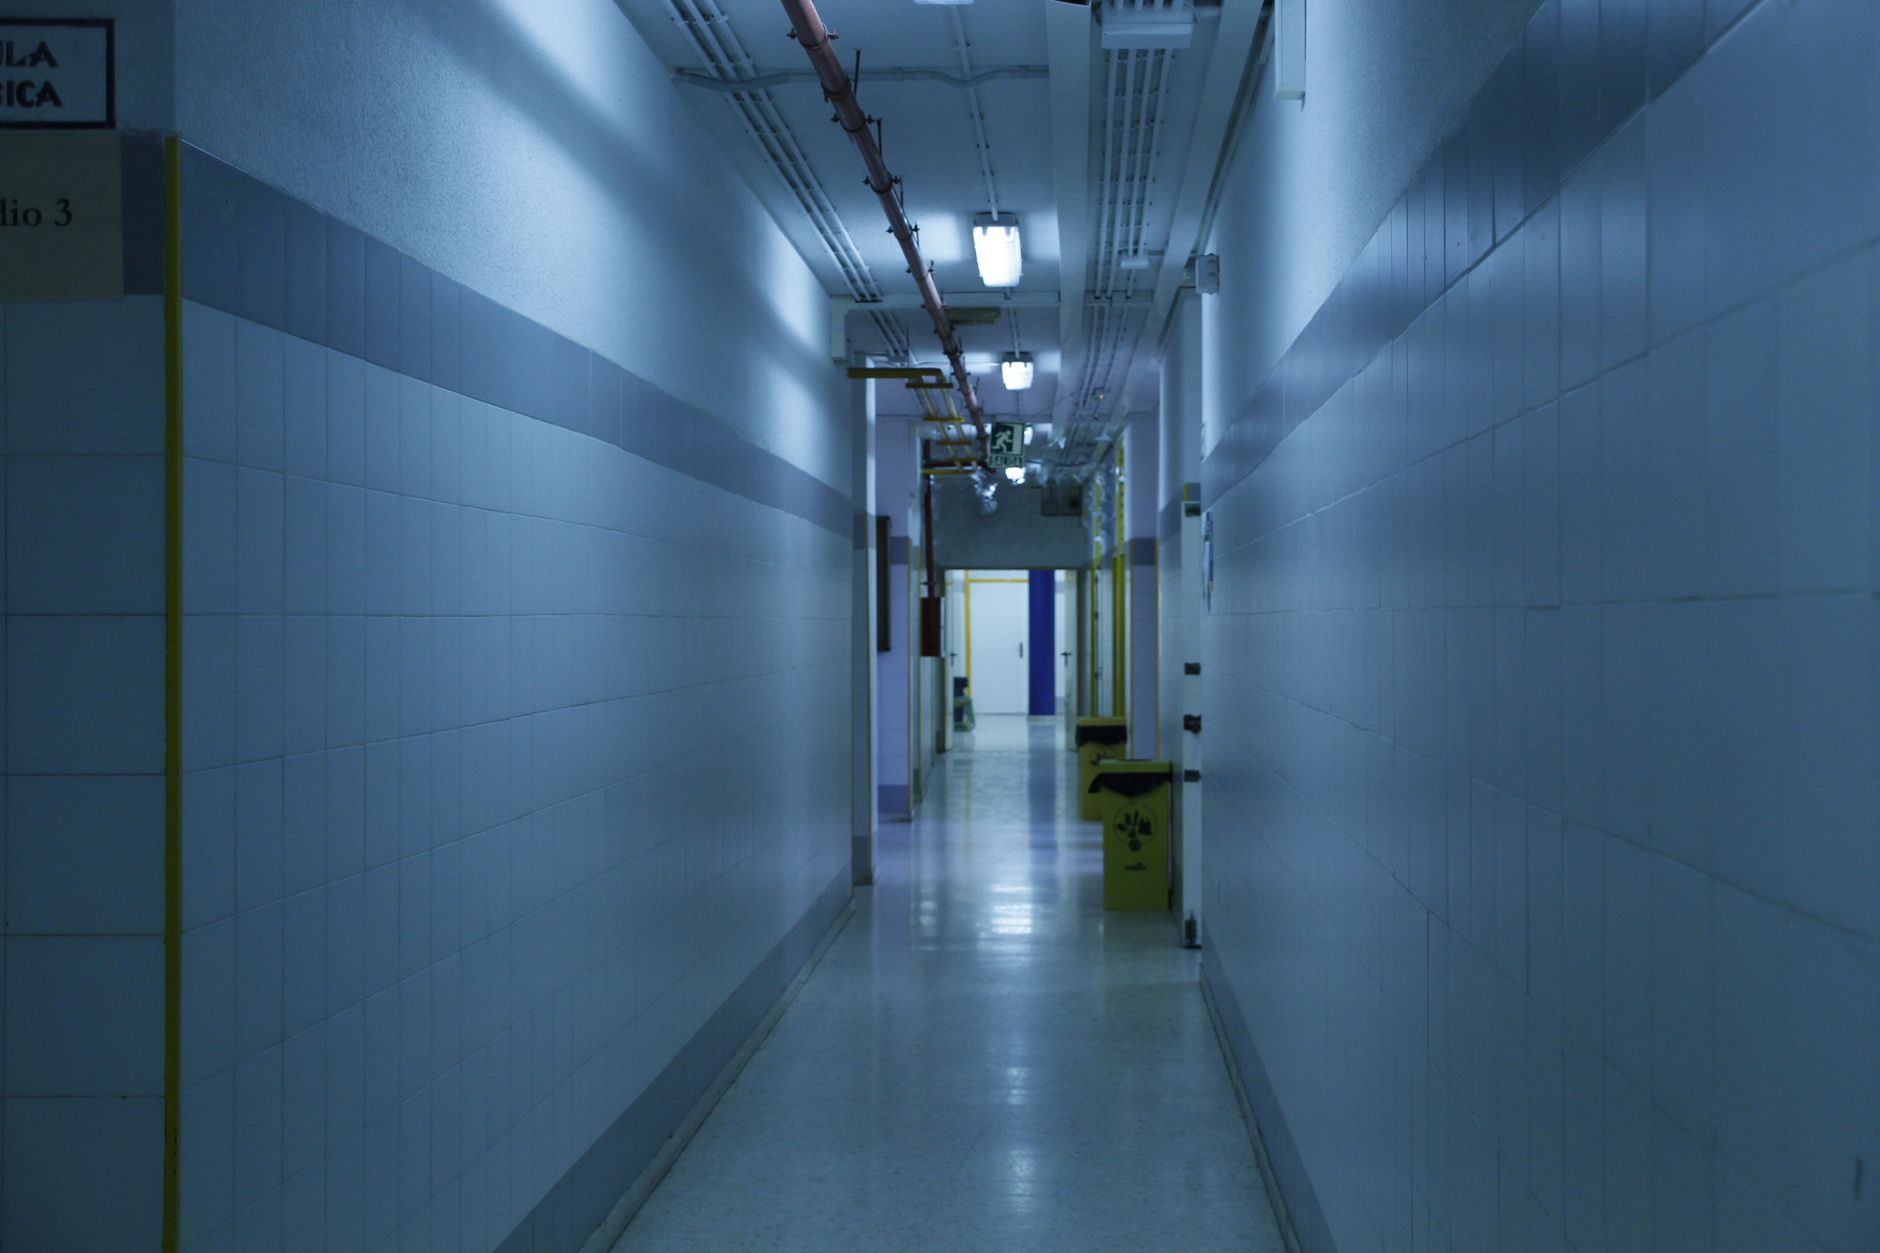
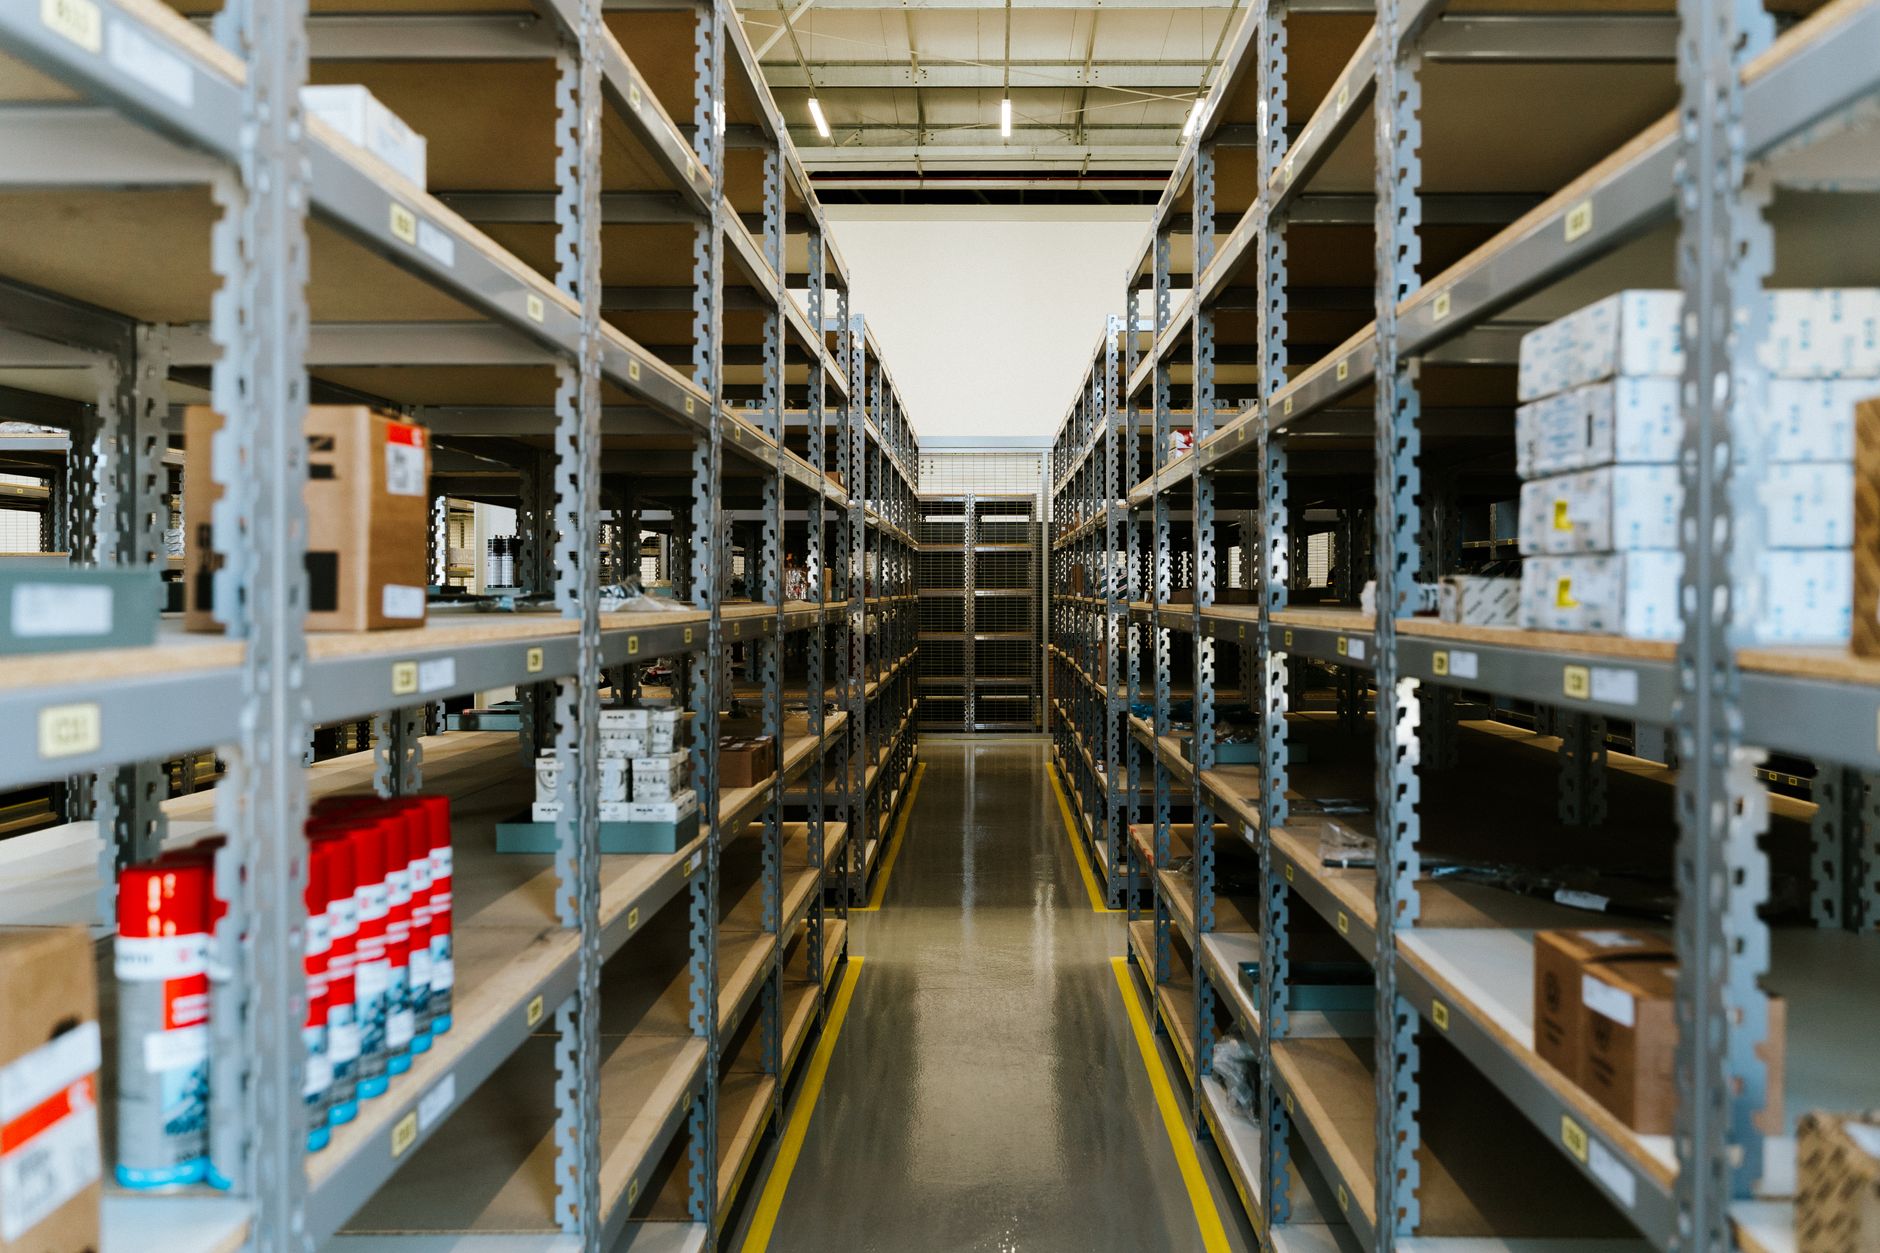
Yes, but only against peers that run the same kind of building. A hospital corridor, a furniture showroom and a cold-storage warehouse carry different soil, different foot traffic and different operating hours, so a head-to-head comparison across them tells a manager very little. Inside a matched group, three numbers do most of the work: shift length, zone count and foot traffic.
Shift length is the clock window the floor has to fit inside. Zone count is how many separately mapped areas the building splits into. Foot traffic sets how often each zone needs a pass. Put those three side by side with a peer and you can see whether your routine has the hours and coverage to keep up, or whether the gap is hiding in plain sight.
Benchmarks from vendors and cleaning guides work as ranges, not verdicts. Use them to set expectations, then check them against your crew logs before you change a schedule or a budget line.
Why does site type decide whether a comparison holds?
Peer means a site of the same type, with similar hours, similar floor finishes and a footprint in roughly the same band. Two buildings of identical square footage can need very different routines. A medical office runs slower than a standard office because disinfection steps take time. One cleaning guide that cites ISSA-style production rates puts medical and dental offices at 1,500 to 2,500 sq ft per hour, against 3,000 to 4,000 for standard offices. Setting those two figures side by side as if they described the same work would mislead you.
Keep the comparison narrow. If a peer runs a short overnight window while you run a long one, or a peer has one open lobby where you have four separated wings, the raw output numbers stop meaning what they appear to mean.
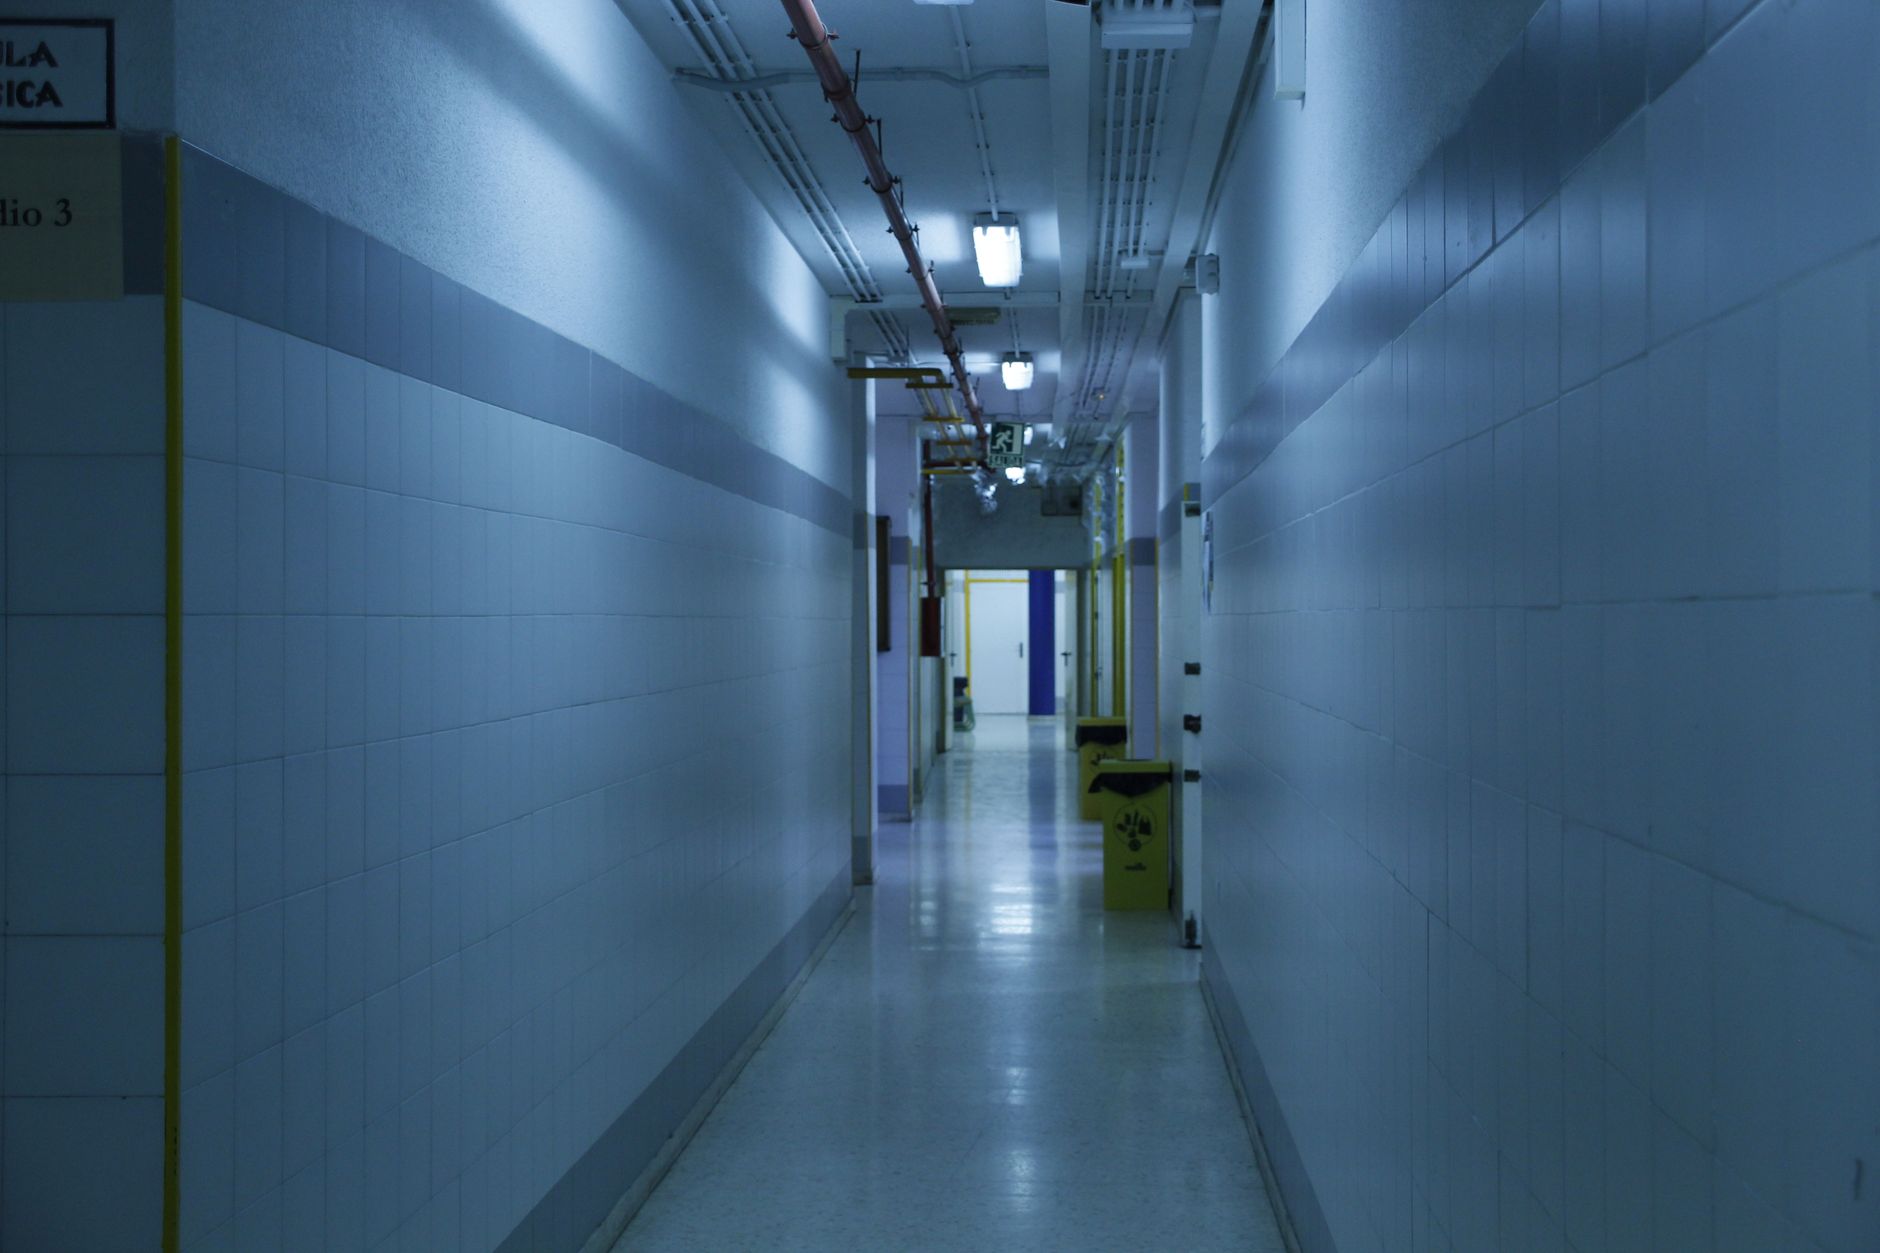
Which three measures should you record first?
Log these before you compare output. Each one answers a different question about the floor.
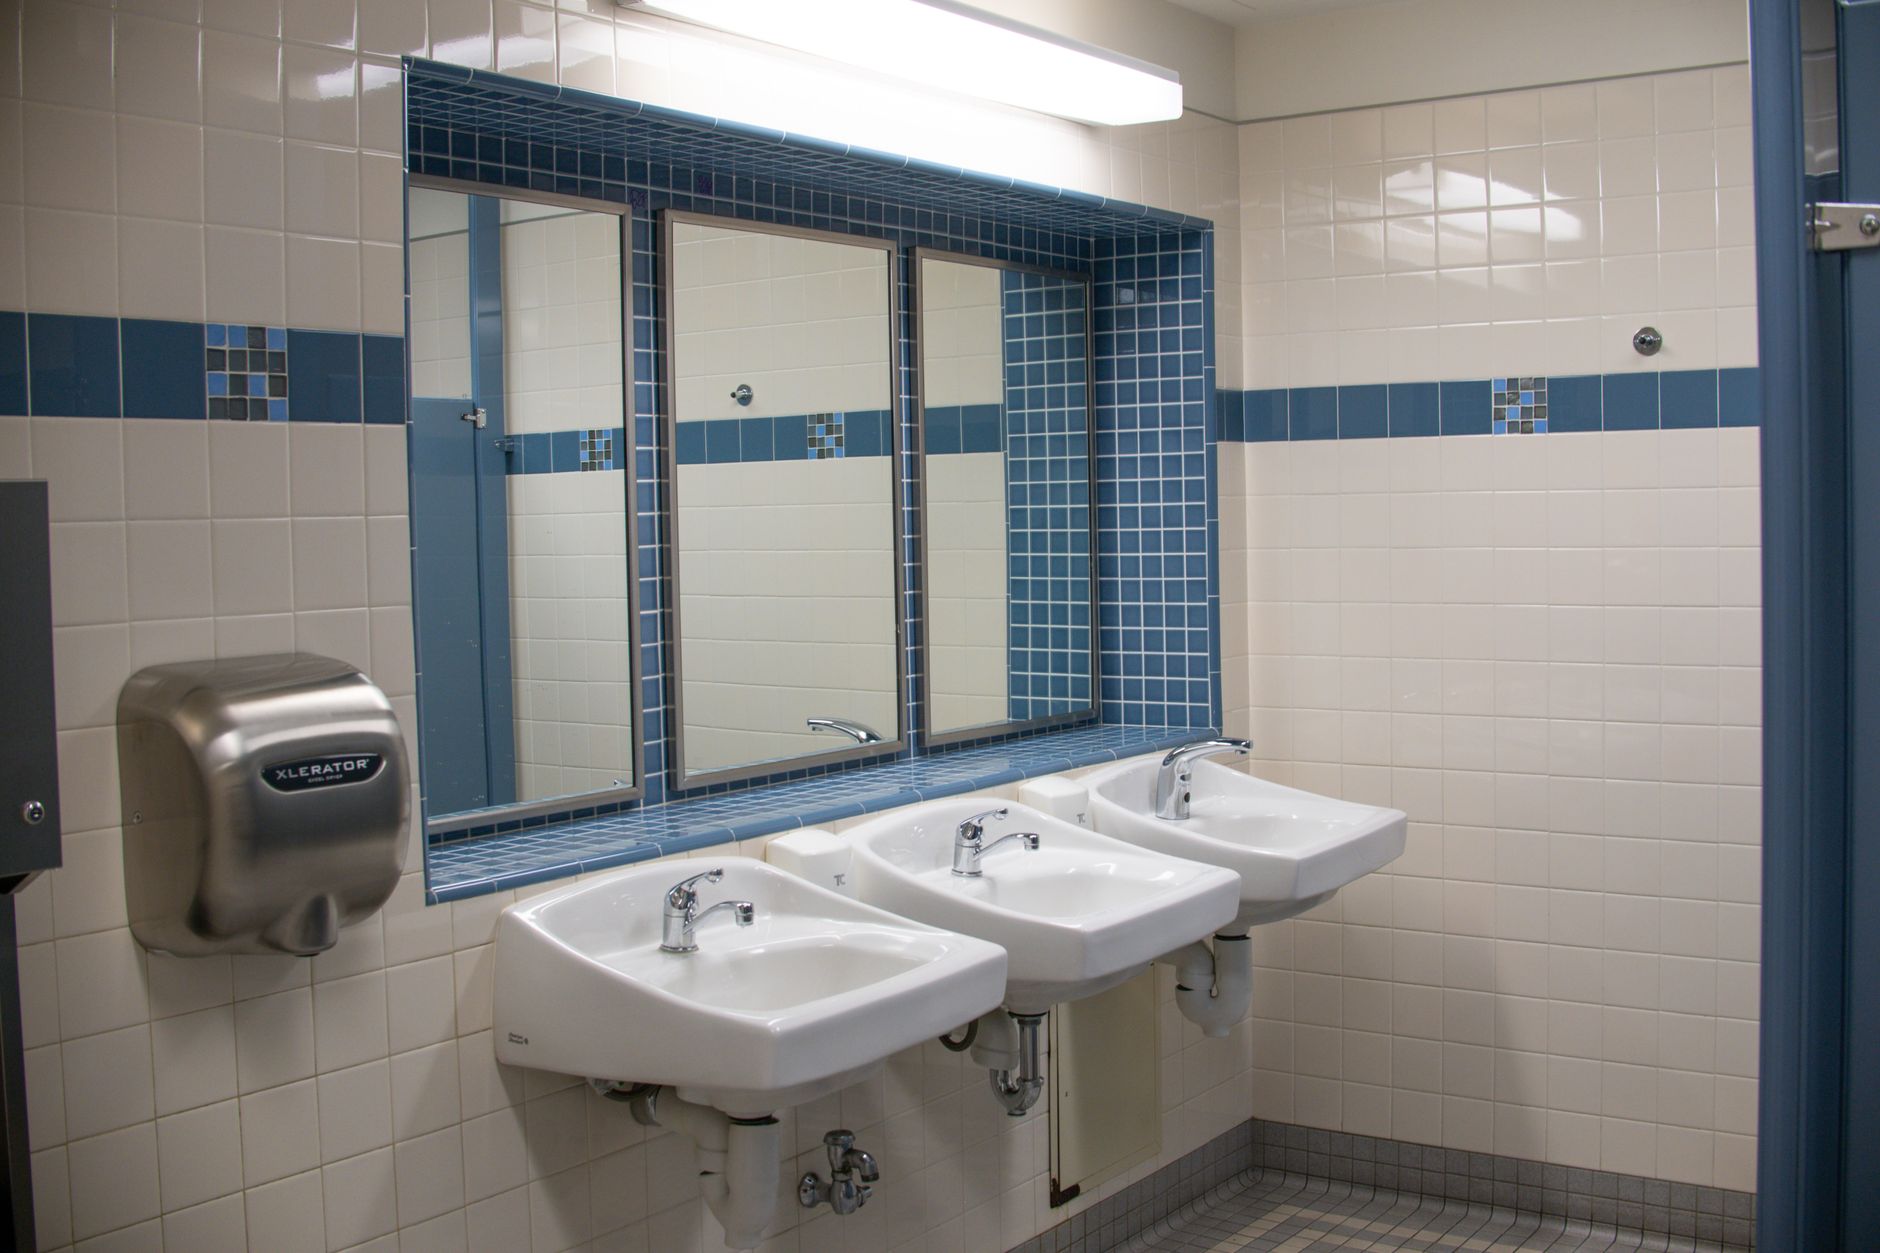
Restrooms need their own line. One vendor reports that restrooms are the most labor-intensive element per square foot and that fixture count matters more than area, so a zone list that ignores fixtures will understate the work.
- Shift length: the hours between the last occupant leaving a zone and the first customer or staff member arriving. Every pass must fit inside this window.
- Zone count: the number of separately mapped areas, counting aisles, corridors, lobbies and restrooms as distinct zones rather than one large floor.
- Foot traffic: a daily count or careful estimate of people and carts crossing each zone. Heavy traffic means more passes and more soil between them.
How much floor can a machine cover in one shift?
Spec sheets give a ceiling, not a schedule. As checked in early November 2026, Equipworld lists Tennant's T380AMR with a theoretical maximum of 33,440 sq ft per hour in manual mode and an estimated autonomous runtime of up to 4 hours on flooded lead-acid or up to 5 hours on high-capacity lithium-ion. Navia lists its Scrubber 85 at a rated 57,000 sq ft per hour with a battery of up to 6.5 hours per run, and its Scrubber 60 at 28,000 sq ft per hour with 3 to 6 hours depending on configuration. Caddy lists a maximum of 28,000 sq ft per hour for its robotic scrubber.
Read those as full-speed figures. Turns, obstacles and charging all pull real output down, and the same model can show different numbers across listings. Pull the official spec sheet and time a real run on your floor. Then compare that measured coverage with the window from your shift length measure, not with the brochure figure.
What do crew benchmarks look like, and how far can you trust them?
A commercial-buildings vendor reports 4,500 to 6,000 sq ft per hour per worker for large Class A and B offices. A guide citing ISSA-style production rates gives damp mopping at 2,500 to 4,000 sq ft per hour and standard offices at 3,000 to 4,000. Both sources are vendor-reported, not independent studies, so treat them as bounds.
The same commercial-buildings vendor puts facility-side labor at 85 to 90 percent of janitorial cost, which is why scheduling matters as much as speed. Confirm the ISSA time standards directly before you cite them to a board, because the guide that quotes them says those standards should be checked at the source.
Is the robot market moving through your peer group?
According to the IFR's 2026 Service Robots release, global professional service robot sales rose 24% in 2025 to almost 250,000 units. Professional cleaning robots ranked third, with floor cleaning as the main application. That shows the category is growing worldwide. It does not show how many of your peers run floor robots, so read it as direction, not a census.
The IFR also states that its service robot figures come from a sample of 238 suppliers and are not projected to the whole industry. Use the trend to frame the conversation with leadership, and let local peer data drive the decision.
How do you turn a peer comparison into a gap?
Start by logging one week of crew output by zone, with start and stop times. Divide each zone's square footage by its productive hours, then set that figure beside the matching range for your building type. Where your rate falls below the range, the shortfall appears as extra hours you need inside the window.
Add traffic next. A busy zone may need two passes where a quiet one needs one, so the hours gap grows wherever foot traffic is heaviest. A gap is a question to answer, not a verdict. It might close with a schedule change, a second crew on one zone, or a machine on the zone that stalls most often.
Where does a robot lease fit once the gap is clear?
Service Robot Co. is a full-service commercial robot integrator, and we are OEM-neutral. When a gap points to a machine, we choose from across manufacturers rather than from one catalog. We then handle the lease, deployment, integration, training and service through a nationwide US engineer network, so a facility works with one partner and one number for the whole lifecycle.
Our process starts with a site assessment and mapping, and the fixed lease quote follows that assessment. The figures therefore reflect your zones, your window and your traffic. Leasing a single unit for the zone that misses its window is a sensible way to test the benchmark on your floor before you change anything else.
Frequently asked questions
Want a robot working for you?
Tell us the job and the site. We will recommend the robot, quote the lease, and keep it serviced.
Sources
- IFR: Service Robots see global growth boom (2026 release)
- IFR World Robotics 2025 Executive Summary: Service Robots
- Equipworld: Tennant T380AMR model specifications
- Navia Robotics: Scrubber 85
- Navia Robotics: Scrubber 60
- Caddy Robotics: robotic scrubber
- Vantain Insights: Commercial cleaning rates
- SweepOps: ISSA cleaning times guide