Key takeaways
- The 63 percent and 17 percent figures are association reported national averages, not course data.
- Confirm a survey figure against the primary report before a board sees it.
- Cite older survey numbers with the survey year, the publisher, the secondary source and the date you checked.
- USGA Green Section articles explain labor pressure; they do not measure your crew hours.
- Your own paid hours by task, tracked over two seasons, are the baseline that describes your course.
What do the GCSAA and USGA labor figures actually show?
Two numbers dominate golf labor conversations right now. The first is 63 percent. According to a regional newsletter summary of GCSAA's 2022 labor survey, 63 percent of superintendents rated the labor market bad or very bad. The second is 17 percent. According to USGA Green Section Record, citing GCSAA's 2024 Maintenance Budget Survey, average labor expenditures across the country rose 17 percent from 2022 to 2024.
Both figures are association reported national measures. One records how superintendents feel about the market, and the other records how budgets moved on average. Neither tells you how many hours your crew worked last August, or what your fairways demanded from the mower seat.
Treat them as context for a board conversation, not as a forecast of your own payroll.
Where the 63 percent figure comes from, and what was not checked
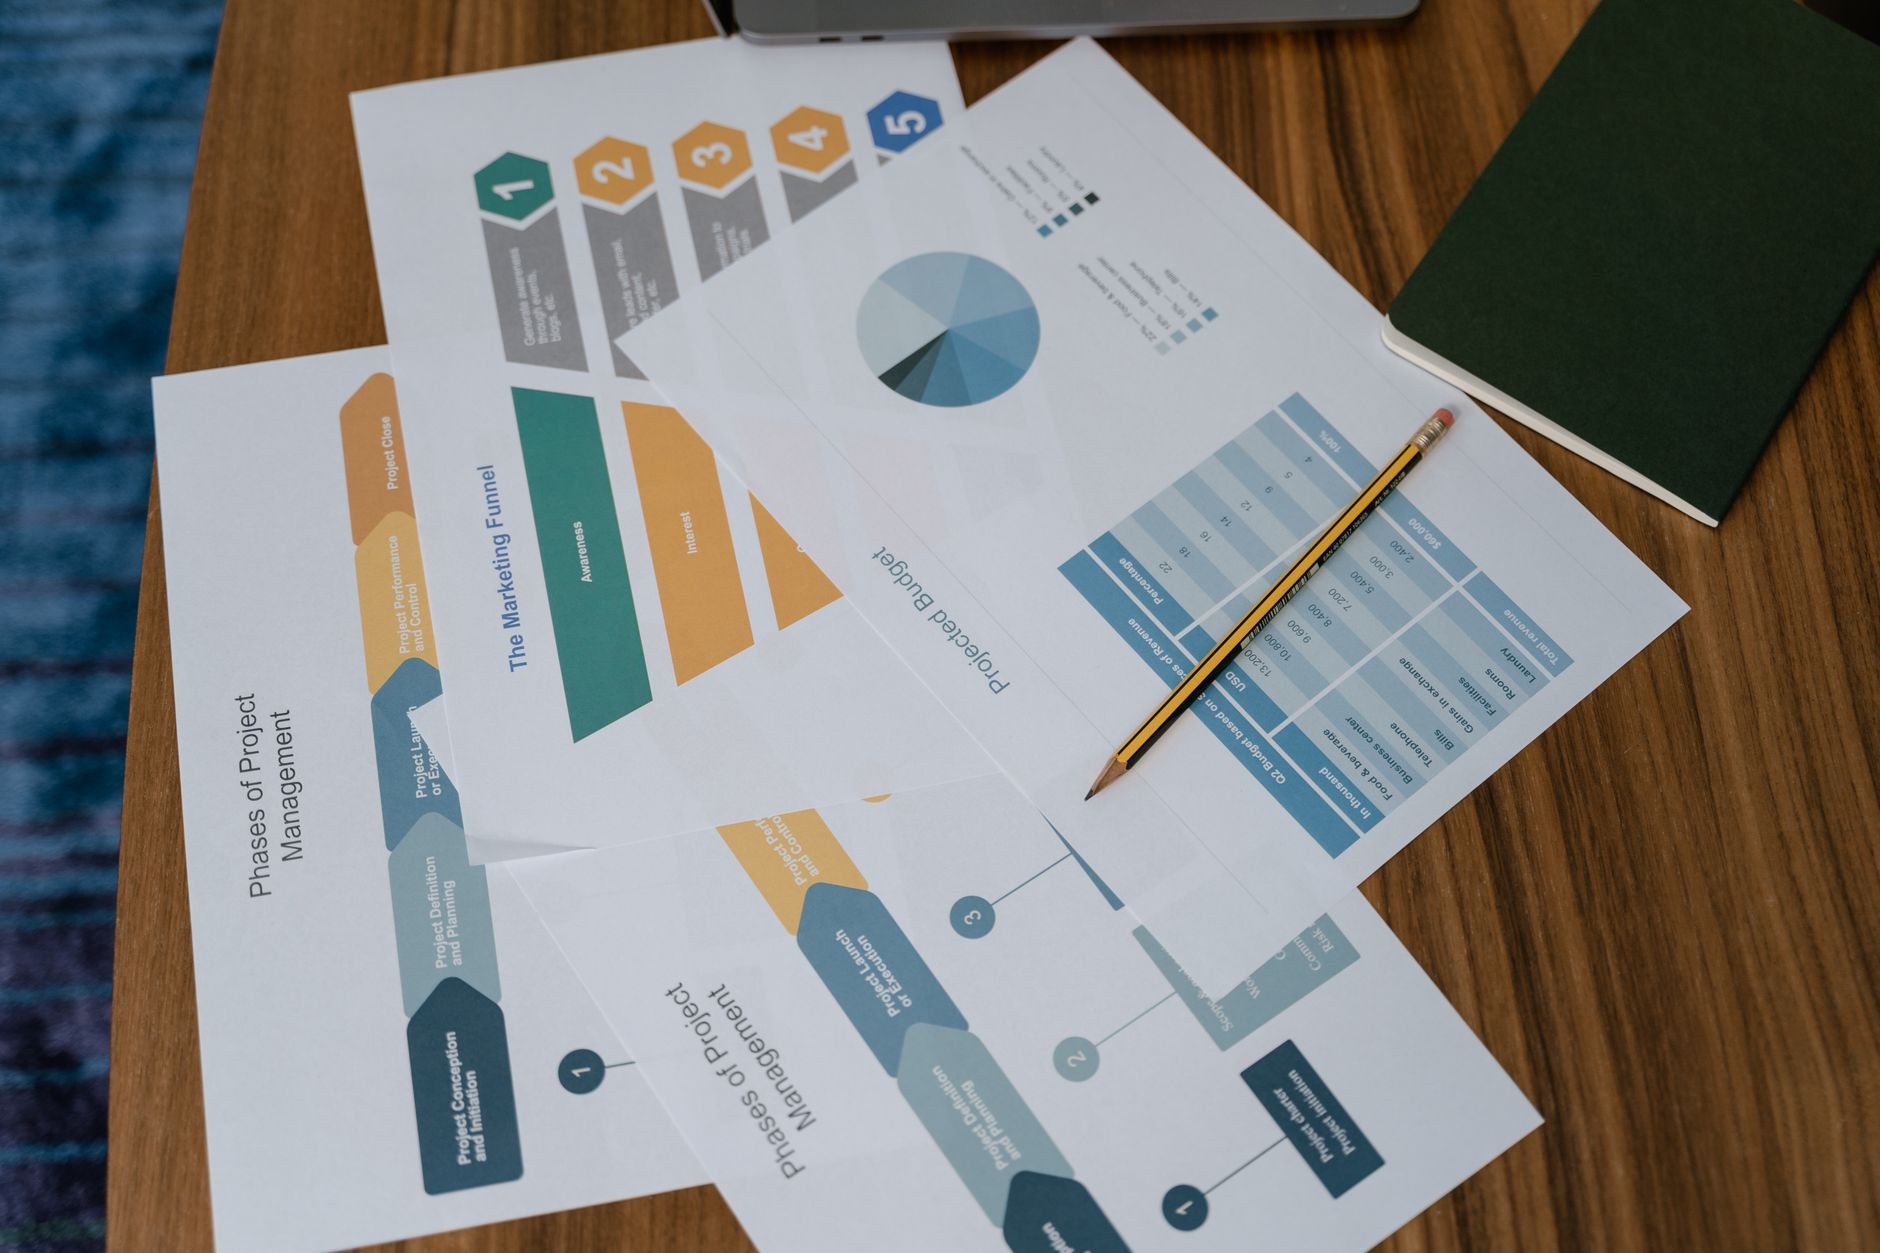
The 63 percent number reached this review through a secondary summary, not the GCSAA report itself. The same summary said 9 percent rated the market good or very good and 28 percent chose neither. It also cited 45 percent for 2016 and 19 percent for 2012, and it said the 2022 result matched the 2019 survey.
The primary report was not opened here. The GCSAA operations surveys page lists its budget and labor reports, and that is where to confirm the survey year, sample and exact wording before the figure is quoted as a finding of the 2022 survey.
What can a national spending increase tell a single course?
A 17 percent rise in average labor spending shows direction. It is an average across many courses, public and private, large and small, so it blends very different staffing models into one line. It does not say whether the increase came from more hours, higher hourly rates, or a shift between seasonal and full time staff, and that breakdown was not verified for this review.
The percentage also depends on its starting value, which the summary used here does not give. A 17 percent change should never be turned into a dollar estimate for your course. Doing so skips every step that actually sets your labor cost.
Because the figure is association reported, it reflects what members chose to report through the survey. That makes it a reasonable description of the market and a weak forecast of next spring's wage line at your club.
What do USGA Green Section articles add to the numbers?
USGA Green Section writing supplies reasons more than measurements. One Green Section article reporting on a 2021 survey said superintendents ranked finding and retaining labor as their top two challenges, with lack of qualified or skilled labor at the top. The survey figures behind that ranking were not checked against the original, so cite the ranking as USGA reported it and avoid presenting it as a measured percentage.
Other Green Section pieces argue that hourly golf maintenance pay compares poorly with industries competing for the same workers. They also describe responses courses have tried: a smaller, better paid crew on flexible schedules, temporary labor for projects and washout repairs, and a one year maintenance apprenticeship in Moore County, North Carolina, run with Sandhills Community College. Those are practices to evaluate against your own records, not outcomes to copy.
How should older survey figures be cited?
A dated citation tells the reader what was measured, by whom, and when. Name the publisher, the survey and its year, and the secondary source you read it through. Then add the date you checked it, because association pages and member reports get revised.
For example: GCSAA's 2022 labor survey, as summarized in a regional newsletter, reported 63 percent of superintendents rated the labor market bad or very bad. That wording tells a board how much weight the number can carry, and it keeps a summary from being mistaken for the report.
Never chain an older survey into a forecast without saying so. A 2022 figure describes 2022, however tidily it fits the present.
How do you replace survey averages with your own crew hours?
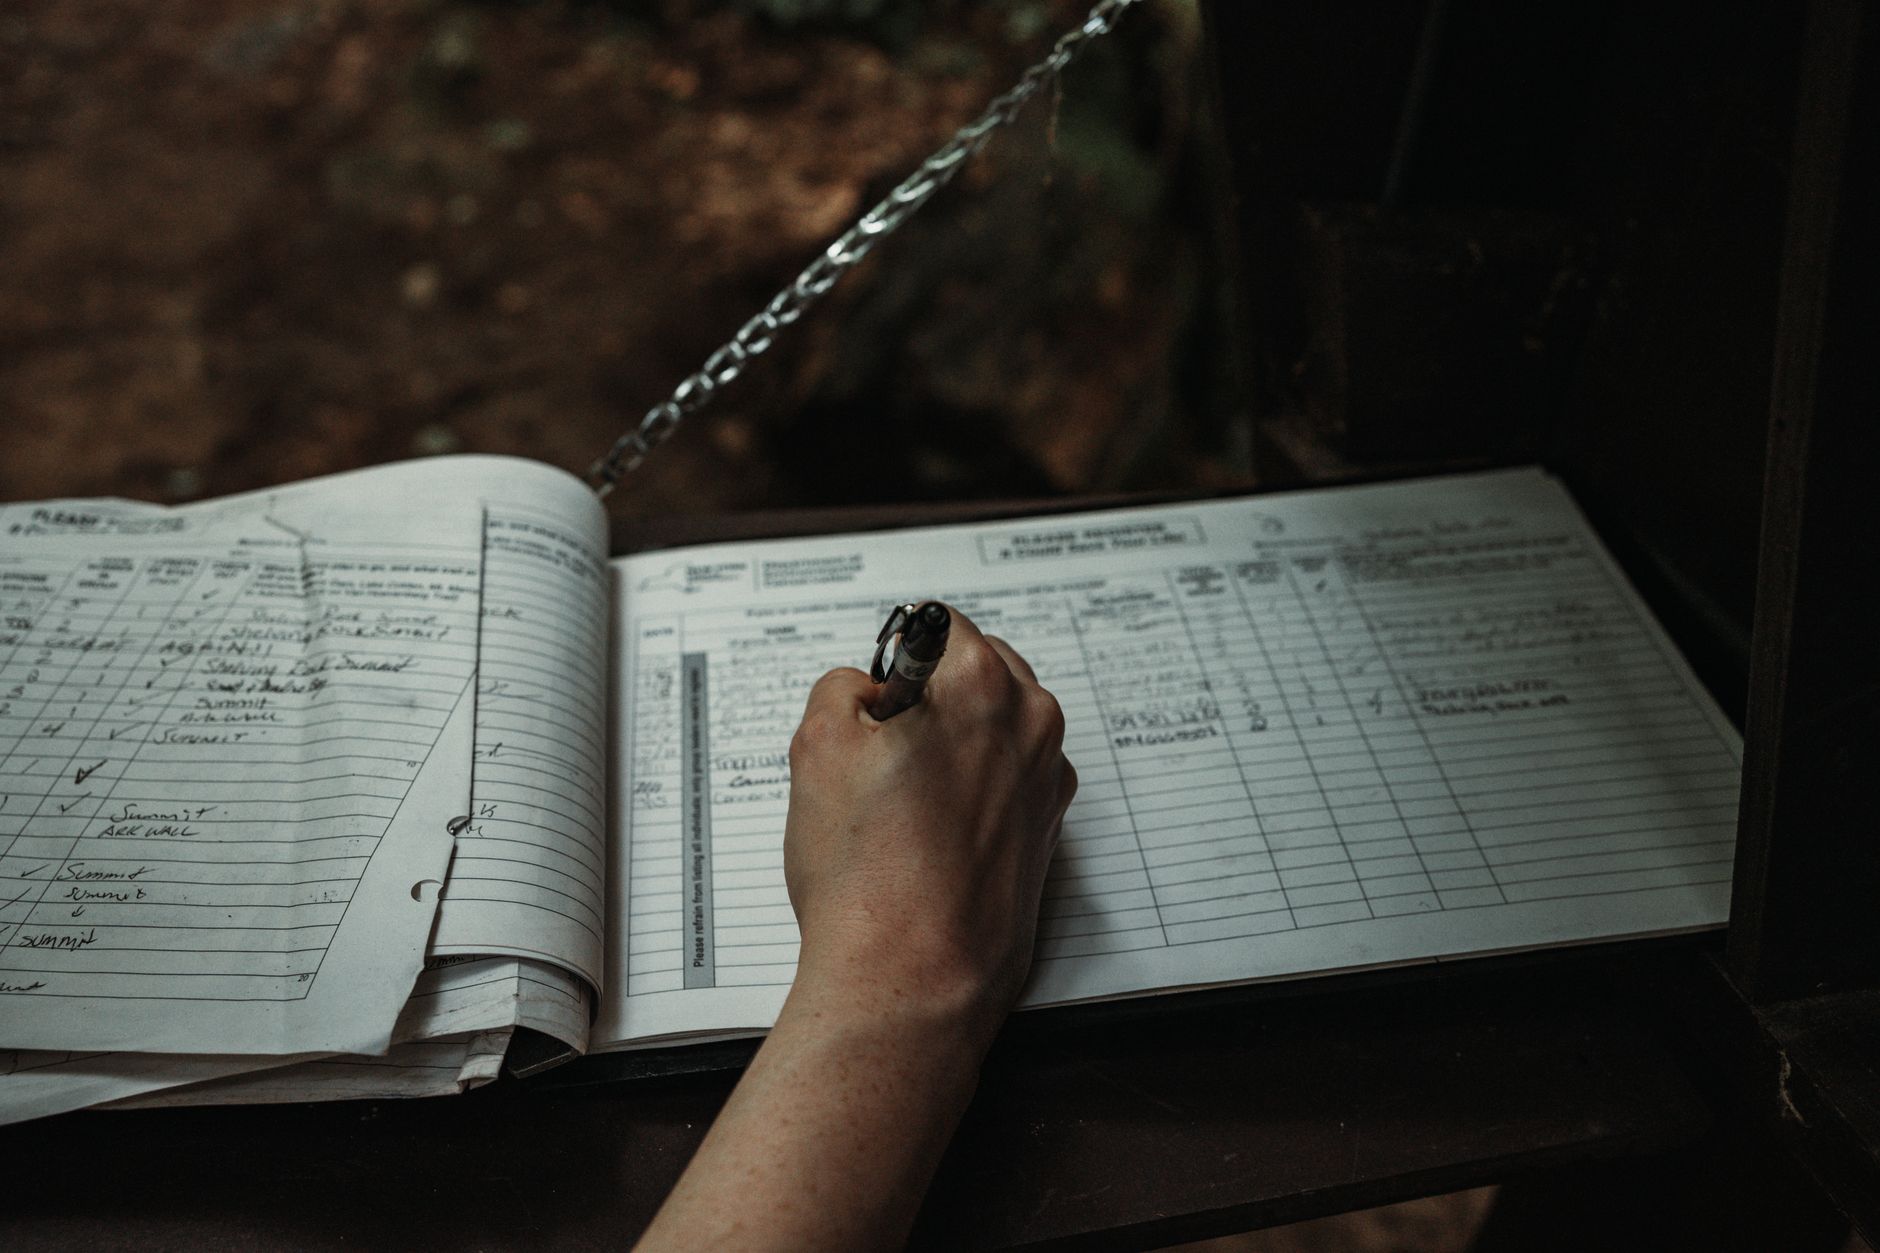
Survey averages stop being necessary once you have one season of your own records. Start with paid hours by task rather than total payroll, because a fairway mowing hour and a bunker raking hour carry different equipment, wear and supervision.
Run the same method each season. A single year can mislead, because weather, aerification and tournament weeks move hours around. Once two comparable seasons exist, the trend belongs to your course, and the survey becomes background reading.
- Pull paid hours by task code for the last full season, not an estimate built from the schedule.
- Split mowing into fairway, rough, edge and cart path work so the largest block of hours is visible.
- Record overtime, call outs and open seats by week, so the short staffed weeks sit beside the hours they affected.
- Divide hours by holes, acres or cuts so a nine hole course and an eighteen hole course can be read side by side.
Where does a robot mower lease fit once the hours are counted?
Measured hours turn a leasing question into a testable one. Service Robot Co. is OEM neutral. We match the robot to the task, lease it through financing on a three year lease, then deploy, integrate and service it under our RoboCare service plan, backed by regional service engineers in every state we service.
Our offer runs on one fixed lease payment, quoted after a site assessment of your grounds. That means the number going to committee comes from your turf and not from a national average. A course with measured seat hours can test which fairway passes a robot would take, then check how many hours remain for greens, bunkers and the work only people can do.
Frequently asked questions
Want a robot working for you?
Tell us the job and the site. We will recommend the robot, quote the lease, and keep it serviced.
Sources
- GCSAA-linked regional newsletter summary of the 2022 labor survey
- GCSAA operations surveys and reports
- USGA Green Section Record: Investing in staff is critical for success
- USGA Green Section Record: How are golf courses adjusting to a challenging labor market
- USGA Green Section Record: The wage issue in golf course maintenance
- USGA Green Section Record: Labor suggestions
- USGA Southeast Region: Labor issues