
a large full-service restaurant in Beijing with roughly one thousand square meters of floor space and ninety-nine tables
How a Beijing Restaurant Logged 280 Weekday Tray Deliveries With Robots
Restaurant case study: delivery robots logged about 280 weekday tray runs and roughly 390 on peak days across ninety-nine tables at a large Beijing dining room.
- 280
- Weekday trays
- 390
- Peak-day trays
- 99
- Tables served
- 800 m²
- Dining area
Based on a documented real-world deployment. Figures are from public reporting; the organization is not named.

Ninety-nine tables, limited runners
The dining room spread ninety-nine tables across about eight hundred square meters of seating inside a one-thousand-square-meter footprint. Peak covers stacked tray runs faster than a small server team could cycle without guests waiting on hot dishes.
Managers wanted delivery capacity that matched weekday rhythm and holiday spikes without hiring a dedicated runner for every shift. They also needed operating charts finance could read when deciding whether to add another unit.
- Weekday and holiday covers followed different tray curves.
- Long interior walks separated kitchen pass from distant tables.
- Leadership wanted daily tray counts instead of guesswork from covers alone.
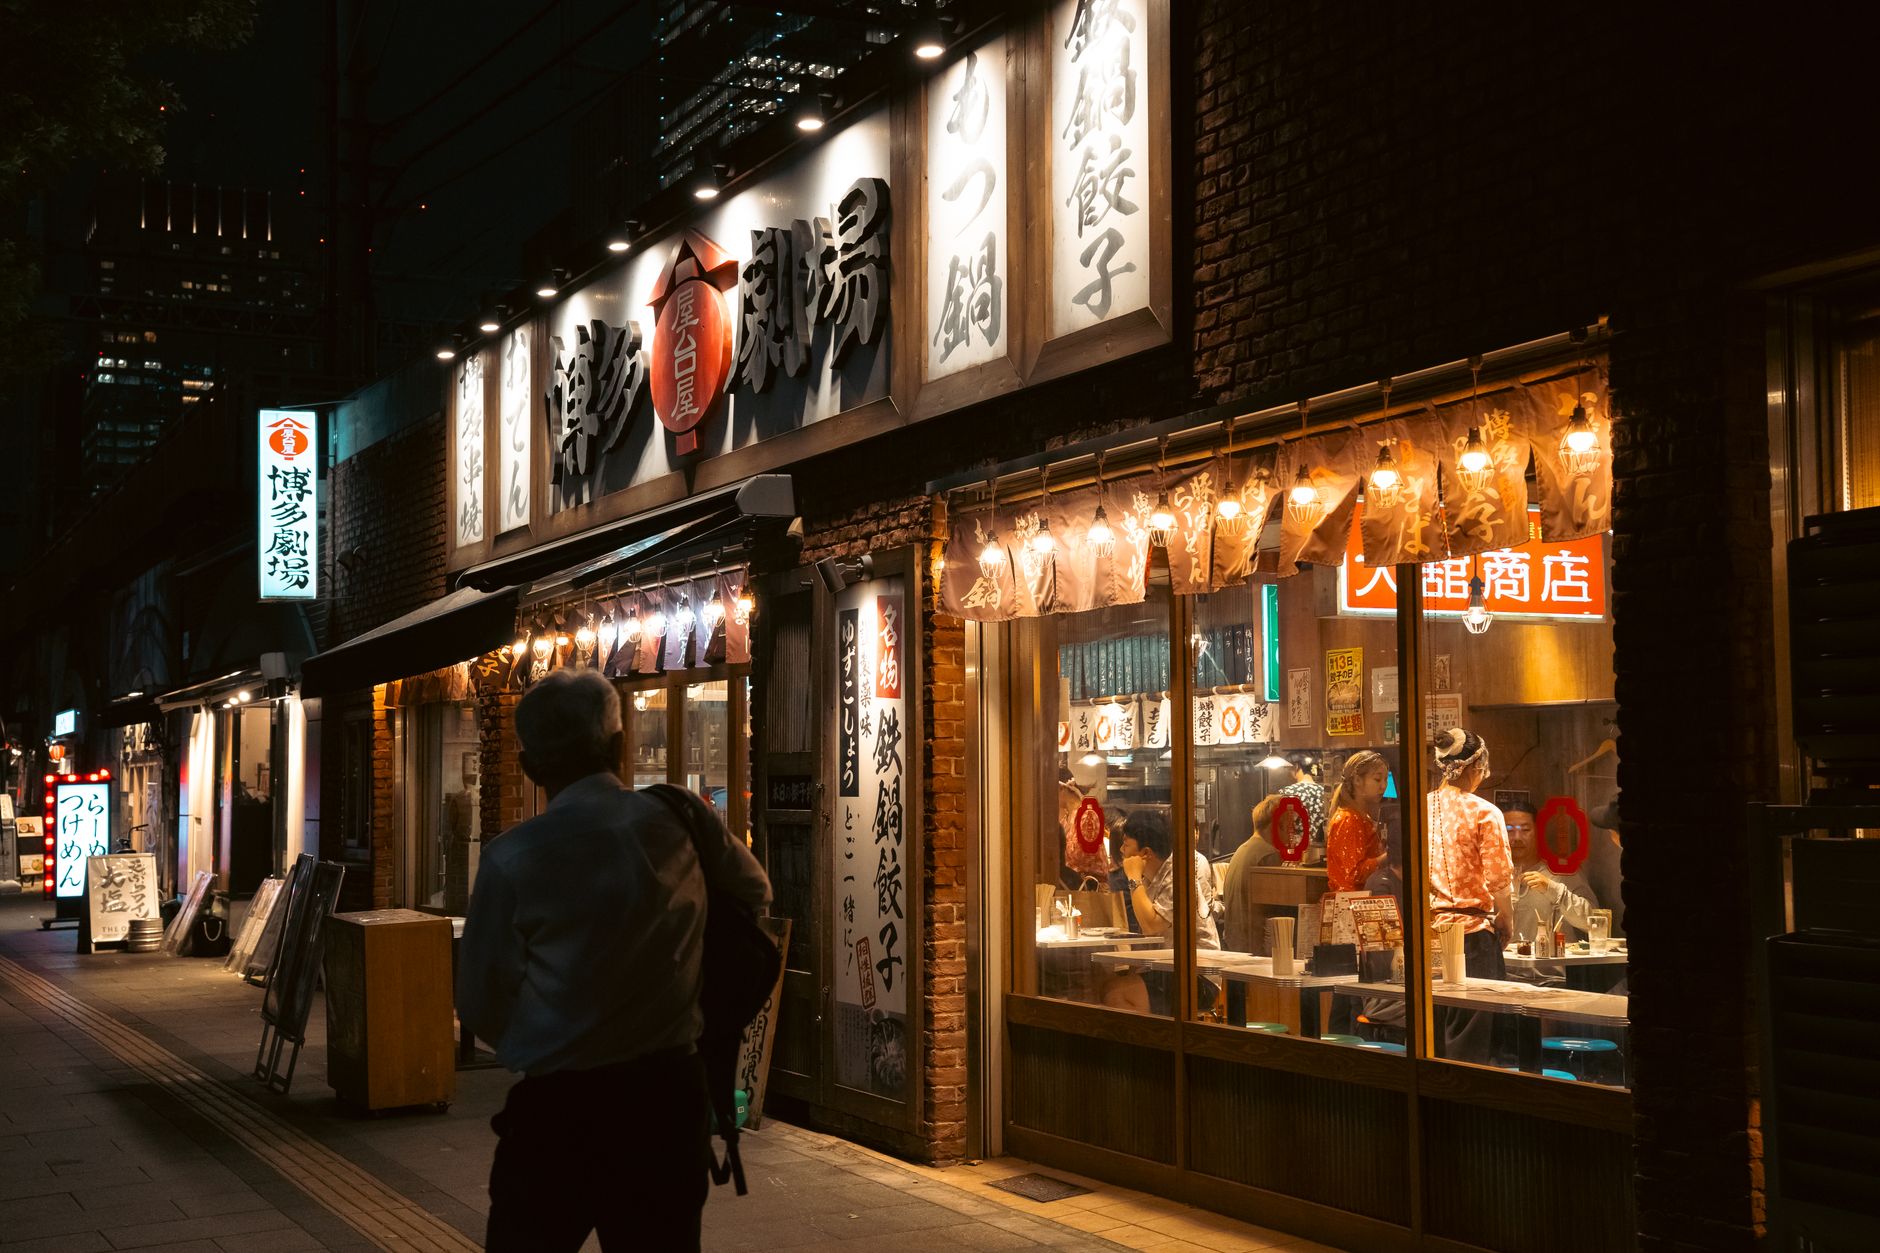
Mapped loops on a wide floor plan
The operator introduced delivery robots on mapped aisles so trays could move while hosts handled greetings, refills, and allergy questions. Installation completed in about two days according to the published deployment materials, which let the team train handoffs before the next holiday rush.
Shift leads reviewed hourly tray curves to see when robots carried peak load versus when human runners still made sense for exceptions. That split kept the fleet working as part of daily performance instead of a demo that faded after launch week.
- Delivery robots mapped across the eight-hundred-square-meter dining area.
- Roughly two-day installation before live peak service.
- Tray curves reviewed by shift against weekday and holiday patterns.
- Kitchen pass handoffs trained before scaling nightly covers.
Reported weekday and peak tray counts
The public deployment charts report about two hundred eighty tray deliveries on weekdays at this Beijing site. The same materials show peak days reaching roughly three hundred ninety tray runs when covers climb on weekends and holidays.
Those counts sit alongside ninety-nine tables in the documented layout, which helps operators see how much delivery volume a wide dining room generates before adding units. The figures come from the published case, not a guarantee every US restaurant will match them on week one.
What US operators can borrow
This is a documented Beijing deployment, not a Service Robot Co. customer story. It still shows how tray curves differ between weekdays and peak days when ninety-nine tables share one floor.
Service Robot Co. helps US restaurants compare runner counts, financing paths, and rollout phasing against wide dining footprints. We select OEM-neutral hardware, deploy and train on your aisles, and keep units running through RoboCare after routes are live.