
a restaurant and bar venue running long service hours with high table-turn pressure
How a Restaurant and Bar Lifted Table Service to 120 Turns per Day With Robots
Restaurant and bar case study: robots lifted table services above 120 per day per table versus 70-plus manually, with turnaround efficiency rising from 45% to 80%.
- 120+
- Robot turns
- 70+
- Manual turns
- 80%
- Efficiency
- 24/7
- Coverage
Based on a documented real-world deployment. Figures are from public reporting; the organization is not named.
Turns capped by runner hours
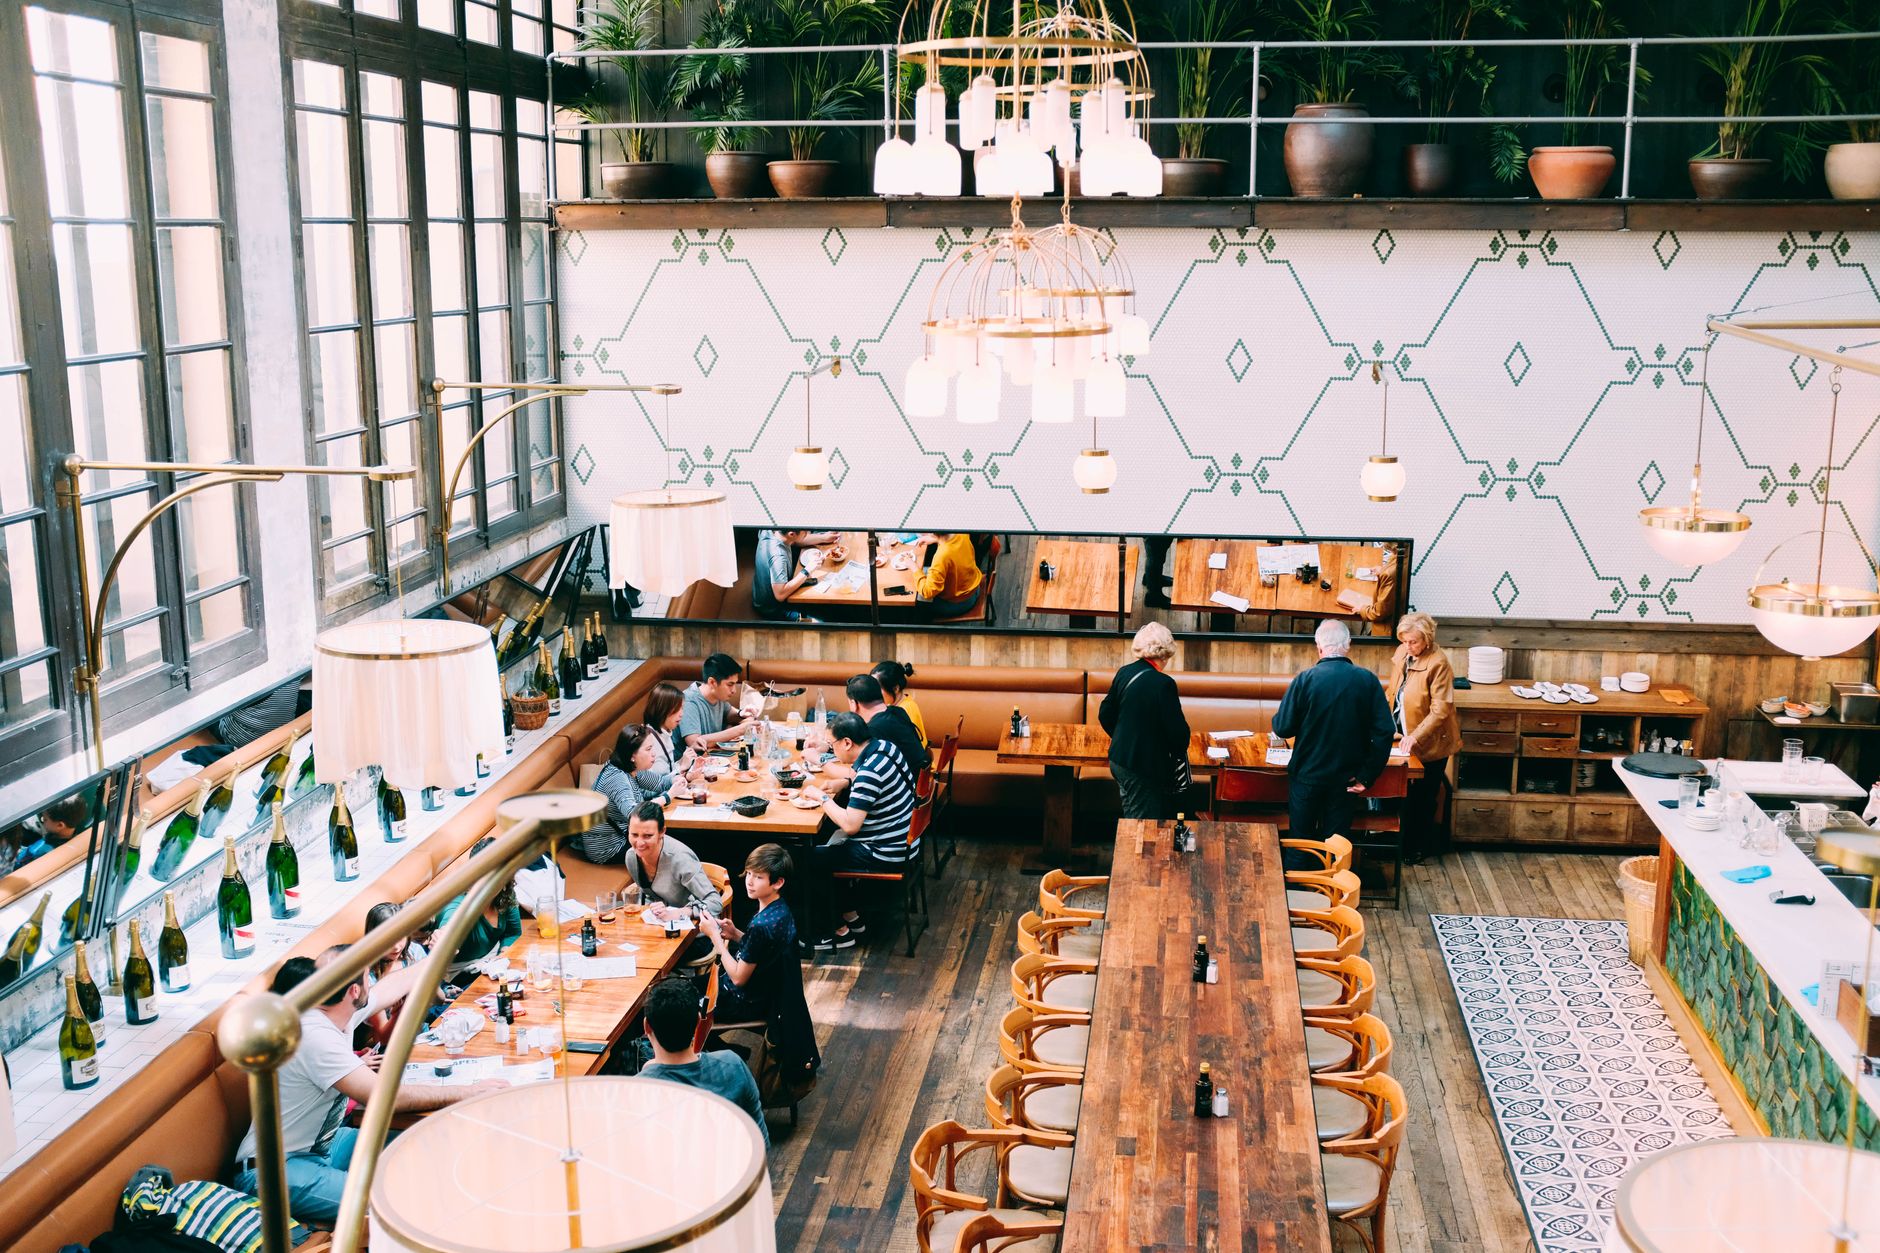
The venue mixed dining and bar service across long evenings when every table turn depended on staff walking plates and glassware on tight loops. Manual operations ran about eight hours a day while table services struggled to stay above seventy-plus per table daily.
Managers wanted higher throughput without adding another runner for every peak hour. They also needed comparison charts that tied turnaround efficiency to labor and robot cost per table.
- Manual shifts covered about eight hours of service daily.
- Table services stalled above seventy-plus per table per day.
- Turnaround efficiency sat near forty-five percent in the manual model.
Robots on extended loops
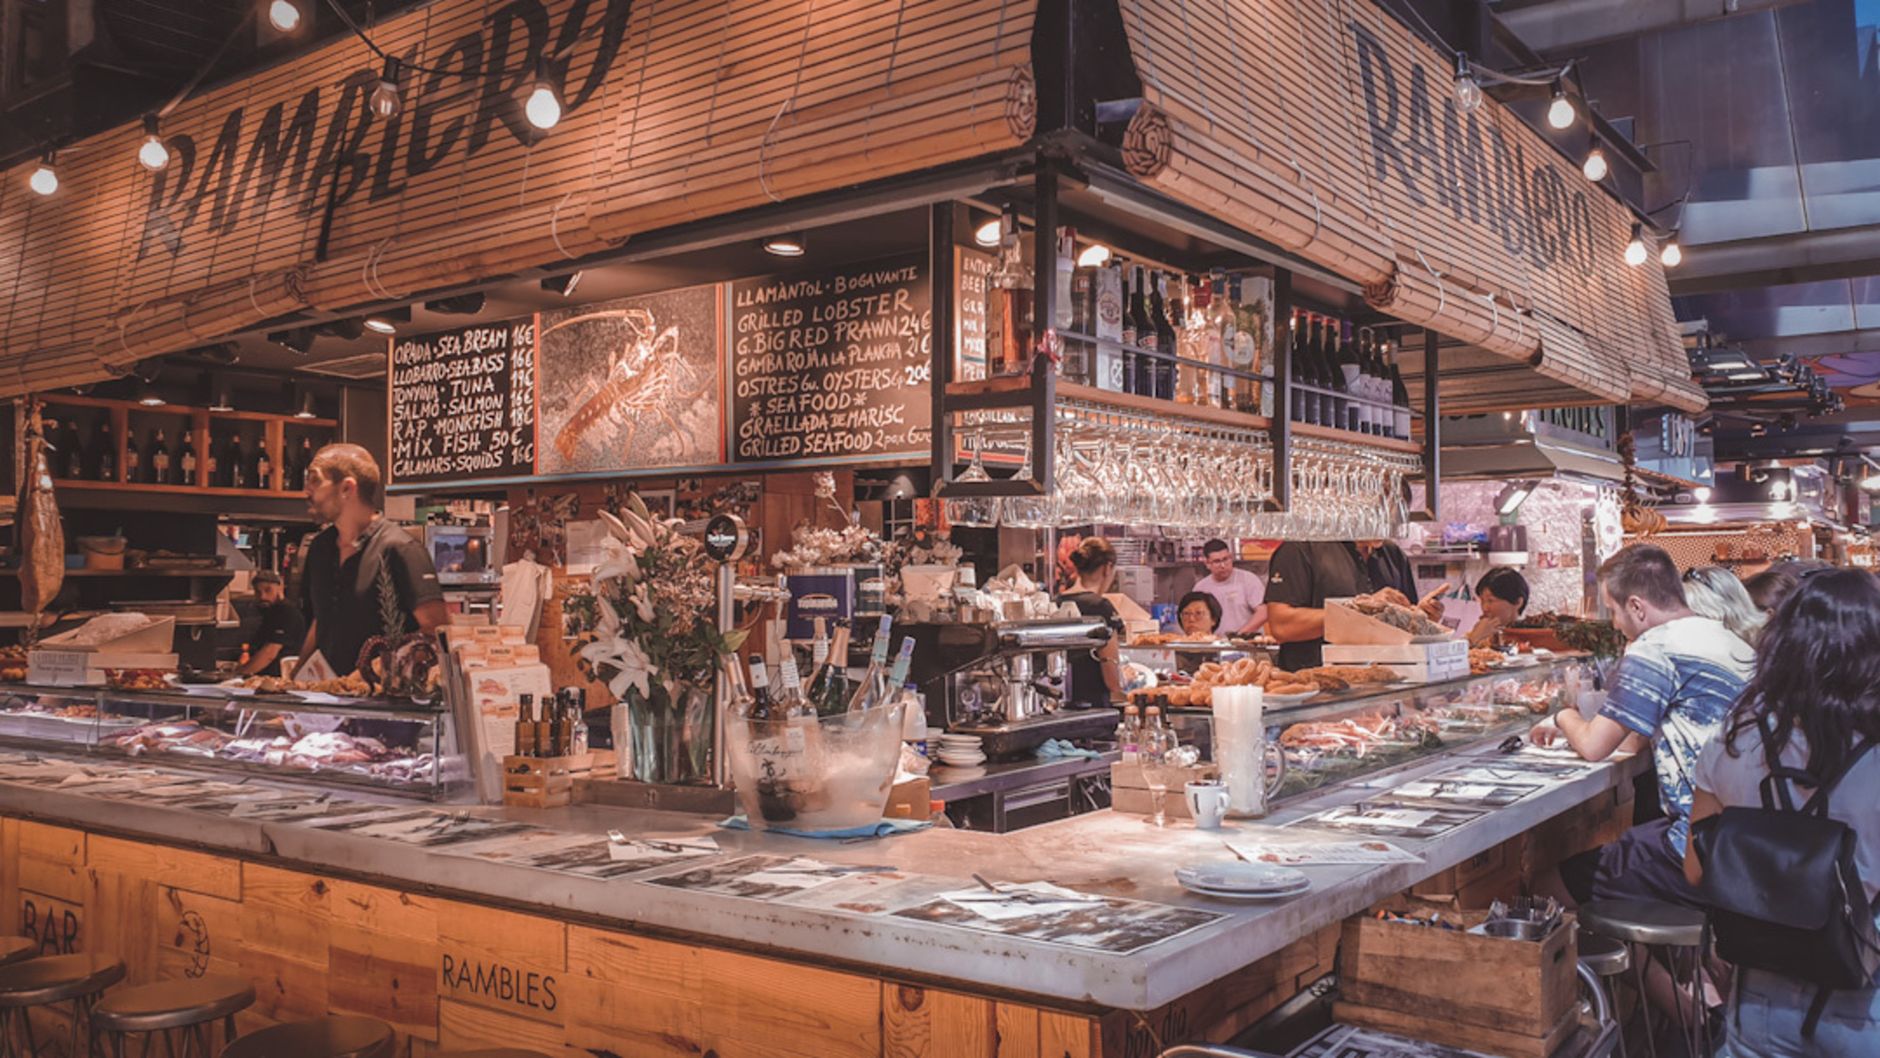
Leadership added delivery robots on mapped paths so runners could keep plates and drinks moving while hosts stayed on guest-facing work. The robot model in the public comparison extended effective operating coverage toward twenty-four-hour availability instead of a single eight-hour manual window.
Finance reviewed per-table monthly cost lines alongside turnaround charts so leaders could see when robot-assisted service raised table counts without matching manual wage assumptions.
- Delivery robots mapped through dining and bar aisles.
- Operating window extended toward around-the-clock coverage.
- Weekly turnaround charts compared manual and robot weeks.
- Per-table cost assumptions tracked in the same case tables.
Reported turns and efficiency
Published buffet-industry charts show robot-assisted service lifting table counts above one hundred twenty per day per table versus seventy-plus under the manual model. Dining turnaround time efficiency in the same materials rises from about forty-five percent to about eighty percent.
Cost tables in the source compare roughly 905.20 dollars per table-month in the manual wage scenario to about 275.25 dollars per table-month in the robot scenario using the documented assumptions. Treat every figure as reported case math, not a US guarantee.
What US operators can borrow
This is a documented restaurant and bar deployment, not a Service Robot Co. customer story. It still links table-turn counts and turnaround efficiency to extended robot coverage rather than longer runner shifts alone.
Service Robot Co. helps US restaurants and bars compare runner counts, financing paths, and rollout phasing against high-turn floor plans. We select OEM-neutral hardware, deploy and train on your aisles, and keep units running through RoboCare after routes are live.