
The short answer
Autonomous forklift ROI for beverage distributors comes mostly from night pallet moves between receiving, storage and dock staging, where a robot can take the repeat trips that loaders and forklift drivers make on the same routes. The savings range depends on the share of that laborers and freight, stock, and material movers, hand work the robot realistically takes, the labor hours it offsets, and the fixed lease payment. Savings are estimates, not promises, and the exact lease quote comes after a free site assessment.
Key takeaways
- Night pallet moves on repeatable routes hold most of the return.
- The savings range depends on the share of work a robot realistically takes, not on its rated speed.
- Route repeatability, shared traffic and layout change the number more than most other factors.
- Injury and staffing data support automating repeat moves, but they do not guarantee a result.
- The exact figure comes from a free site assessment, and the lease quote follows it.
Run the numbers for your site
Pick your city or state for a real regional number - we use the real BLS wage there. (On the live site this auto-detects from your location.)
What do you want to automate?
The robot takes the repetitive cart and pallet moves off the heaviest motion.
What is the autonomous forklift ROI for beverage distributors?
Autonomous forklift ROI for beverage distributors is the return from moving palletized cases with a robot in place of a person for the hours that the move would otherwise take. In a beverage warehouse that work bunches up at night, when cases of beer, wine and spirits go from receiving to storage and then to staging lanes for morning trucks. The return shows up as labor hours freed from repeat moves, shorter waits at the dock, and a steadier flow of pallets into staging.
Start with scale, because it sets how much of this work exists across the industry. The Census Bureau's County Business Patterns table for beer, wine and distilled beverage wholesalers gives the official count of firms and establishments. We did not verify a current figure in this research, so pull it from that table before you use it internally. The same caveat applies to throughput. We found no published benchmark for cases or pallets moved per hour in beverage distribution, so the hour figures for your building should come from measurement.
Where does the return come from in a beverage distribution center?
The clearest return sits on the night shift. Job postings from beverage distributors describe night work that runs until the orders are complete. One Connecticut third-shift posting lists 10 pm to 6 am Monday to Thursday, and another night posting describes loading cases of beer for an eight-plus hour shift with reaching above shoulder height. The moves a robot can take are the repeat trips: receiving to storage, storage to a staging lane, and staging to a dock door.
Driver wait time is the second source. When a load is staged late, the truck waits and the driver waits with it. A robot that moves pallets on a set schedule can keep staging lanes filled ahead of the trucks, so part of the return appears as shorter dock time rather than only as labor. A typical night crew at one site is about six people. We estimated that from how the postings describe a supervisor plus several loaders and forklift operators, so confirm your own count before using it.

Median hourly wage, Laborers and Freight, Stock, and Material Movers, Hand
$4,380
Monthly cost of one full-time worker, at the median wage plus payroll costs (an estimate, not a quote).
How is the savings range calculated for a beverage warehouse?
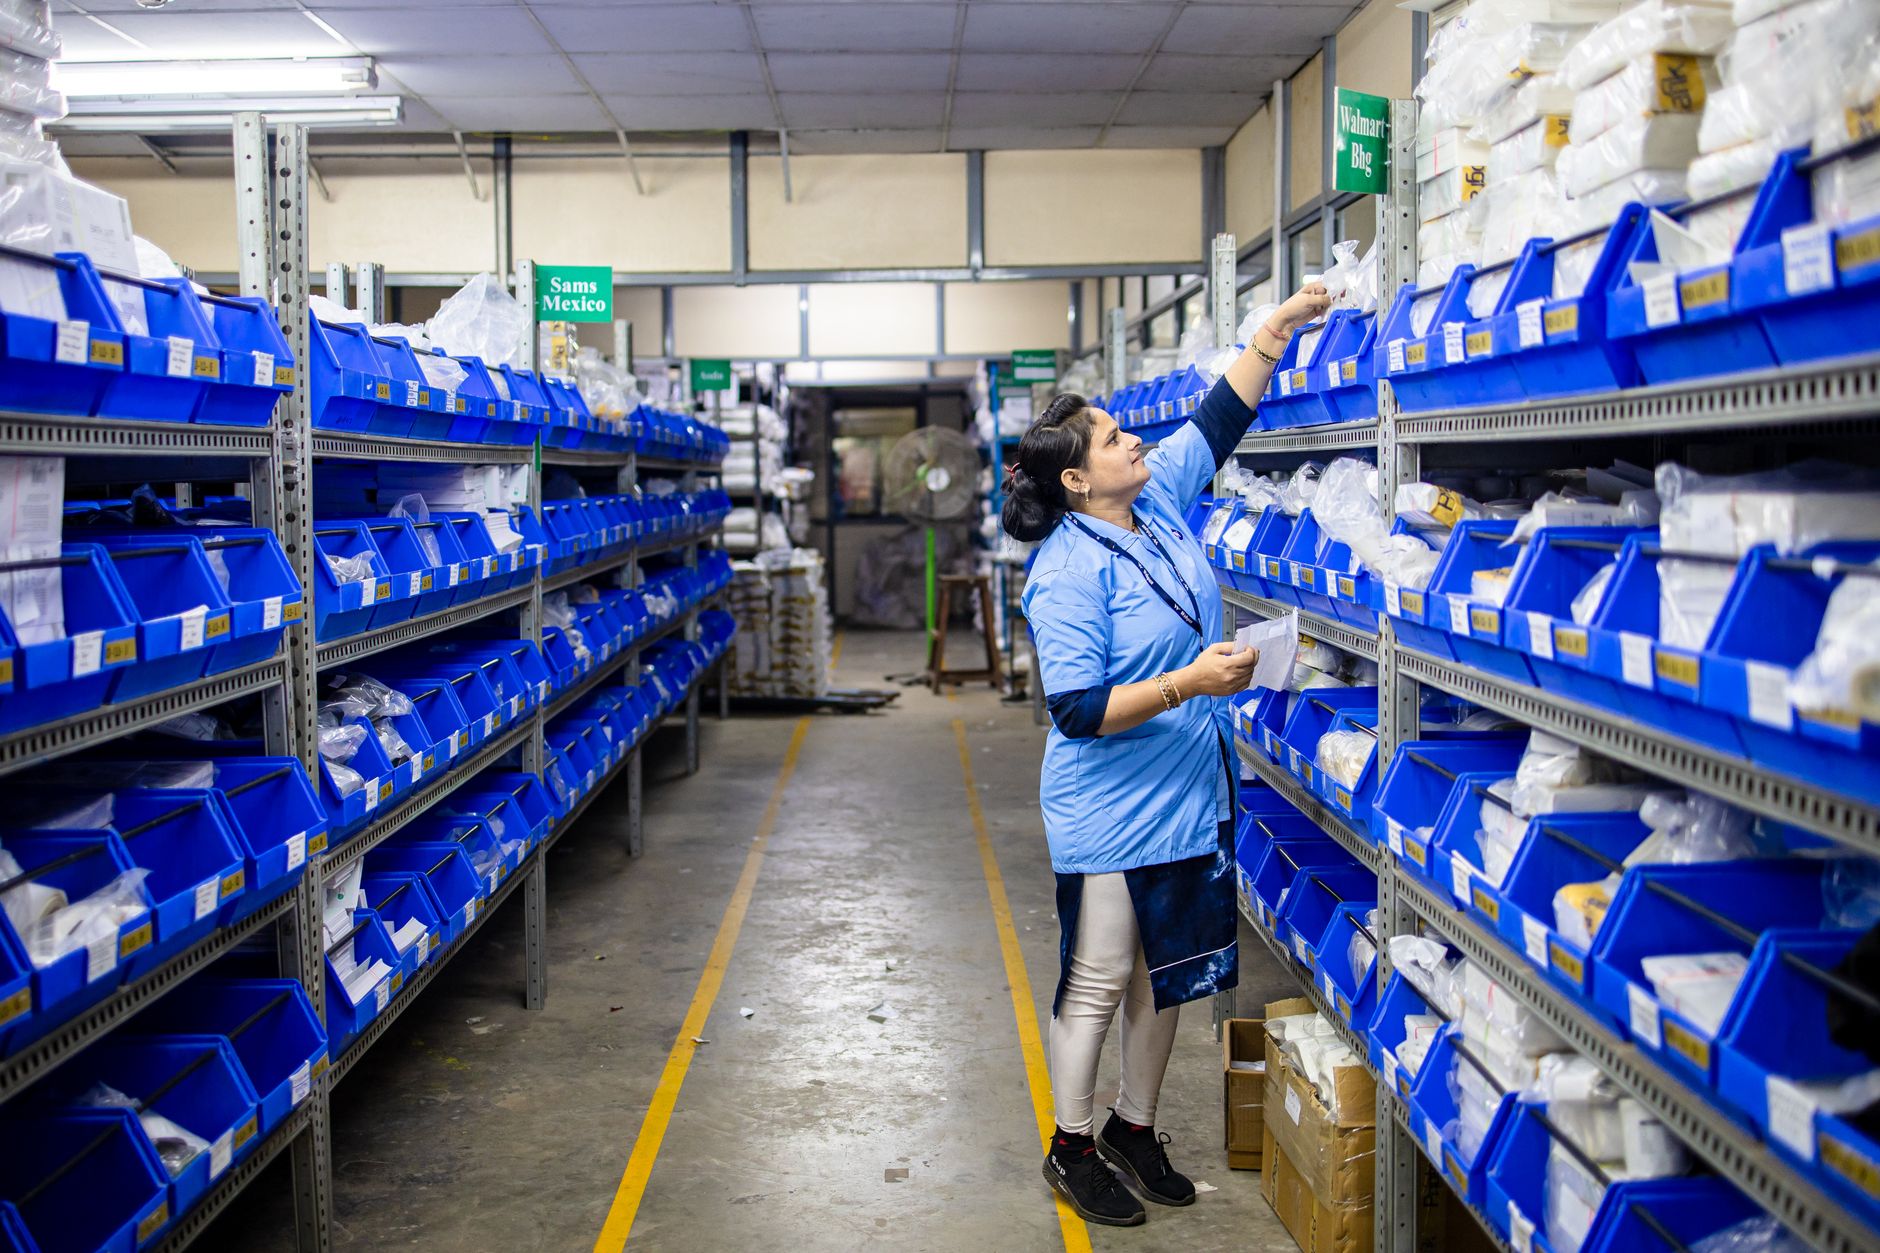
The math has three parts. First, the hours of laborers and freight, stock, and material movers, hand work that the robot takes over each week, measured on your routes. Second, the local wage for this job, which the government wage data on this page supplies and which puts a value on each hour. Third, the fixed lease payment for the robot and its service, set against those savings. The range is the spread between a conservative share and an optimistic share of the hours the robot can realistically take.
In plain terms, weekly savings equal the hours offset times the wage, minus the lease cost and the time a person spends on exceptions. The result is a range because the share of work a robot takes is not known until it runs on your floor. The wage data sets the value of an hour. It does not decide how many hours change, and that depends on route work. This is why the assessment maps the building before anyone quotes a range.
- Night coverage
Autonomous Forklift
Runs the same route through the night once it is set up
Staff
Needs a shift schedule, breaks and time off
- Consistency of repeat moves
Autonomous Forklift
Follows the same path and speed on every trip
Staff
Pace varies with fatigue and workload across the shift
- Exceptions and damage
Autonomous Forklift
Stops and calls for help, and cannot judge the damage
Staff
Judges a damaged pallet and decides what to do on the spot
- Changes to layout or case mix
Autonomous Forklift
Needs remapping and route updates before it runs well again
Staff
Adapts during the same shift without a software change
- Reaching, stacking and label checks
Autonomous Forklift
Not a fit for this work
Staff
Does this work as the job requires
What changes the number up or down?
Four things move the range most. One is how repeatable the moves are. Another is how much pedestrian and forklift traffic shares the aisles. A third is how far apart receiving, storage and staging sit. The last is the size and shape of the night crew. A tight, repeatable route with short distances gives the robot more hours to take. A busy shared aisle, or a layout that changes every week, takes hours away.
The checklist below lists what to confirm before anyone signs off. Each item is measured in the site assessment, so the number you see reflects your building and not an industry average.
What are the risks to the return and how do you avoid them?
The main risk is a robot that spends more time waiting than moving: a blocked aisle, a dock door left open, a pallet that is not square, or a route changed without remapping. Each of these cuts the hours it takes. Avoid them by mapping the floor before deployment, agreeing on one set of staging rules with the night supervisor, and keeping a spare unit available so one stoppage does not idle the shift.
Staffing is the second risk. Hand laborers and material movers held about 6,950,000 jobs in 2024, and the Bureau of Labor Statistics projects 4 percent growth for that group from 2024 to 2034. The labor pool is large, but warehouse crews still turn over, and each new hire needs training on exception handling and staging rules. Assume that training recurs in the staffing plan. Train the night crew before go-live and keep one trained supervisor on every shift so a departure does not stall the route.
Does automating pallet moves reduce forklift injuries?
Forklifts are a serious hazard in warehouses. The Bureau of Labor Statistics fact sheet on forklift fatalities reports 614 forklift-related worker deaths from 2011 to 2017. In 2017 alone, forklifts were involved in 9,050 nonfatal injuries or illnesses with days away from work. The same fact sheet reports that pedestrian injuries had the longest median recovery, at 20 days.
Those figures explain why route control matters. A robot that runs the same path on the same schedule takes some forklift trips out of aisles where people walk. It does not make the building safe on its own. Pedestrian separation, marked lanes, and clear rules for entering a robot route still have to be designed and enforced. Treat any injury benefit as a reason to plan the layout carefully, not as a number to add to the savings.
How common is automation for pallet moves in warehouses?
Adoption is growing but uneven. A 2025 warehouse robotics adoption article reports that 41 percent of respondents now use shuttle systems and/or mobile robotic storage and retrieval systems. That study reports sample sizes inconsistently, so read the figure as directional. A 2026 warehouse automation article puts autonomous mobile robots and automated guided vehicles in roughly 10 to 15 percent of facilities.
Most facilities have not yet put these robots on the floor, so a beverage distributor would not be following a crowd. It also means the first deployment should be a pilot on one route with a clear measure, before any wider rollout. A wider rollout is much easier to justify once the first route shows the hours it takes.
What is a realistic timeline from assessment to payback?
The timeline runs in phases. The free site assessment comes first, with mapping of routes, dock doors, staging and traffic. Next comes the quote, the financing setup, and a route plan that states which work the robot takes. Then deployment and integration, go-live support, and training for the night crew. Payback follows steady operation, so it starts once the first routes run without repeated stoppages.
A pilot-first approach keeps risk low. Start with one leased unit on the highest-volume night route, measure the hours it takes against the assessment, then decide whether to add units. Phased deployment avoids shutting down the night shift and lets the crew adjust staging rules before the robot covers more of the building.
How do I get a precise figure from a free site assessment?
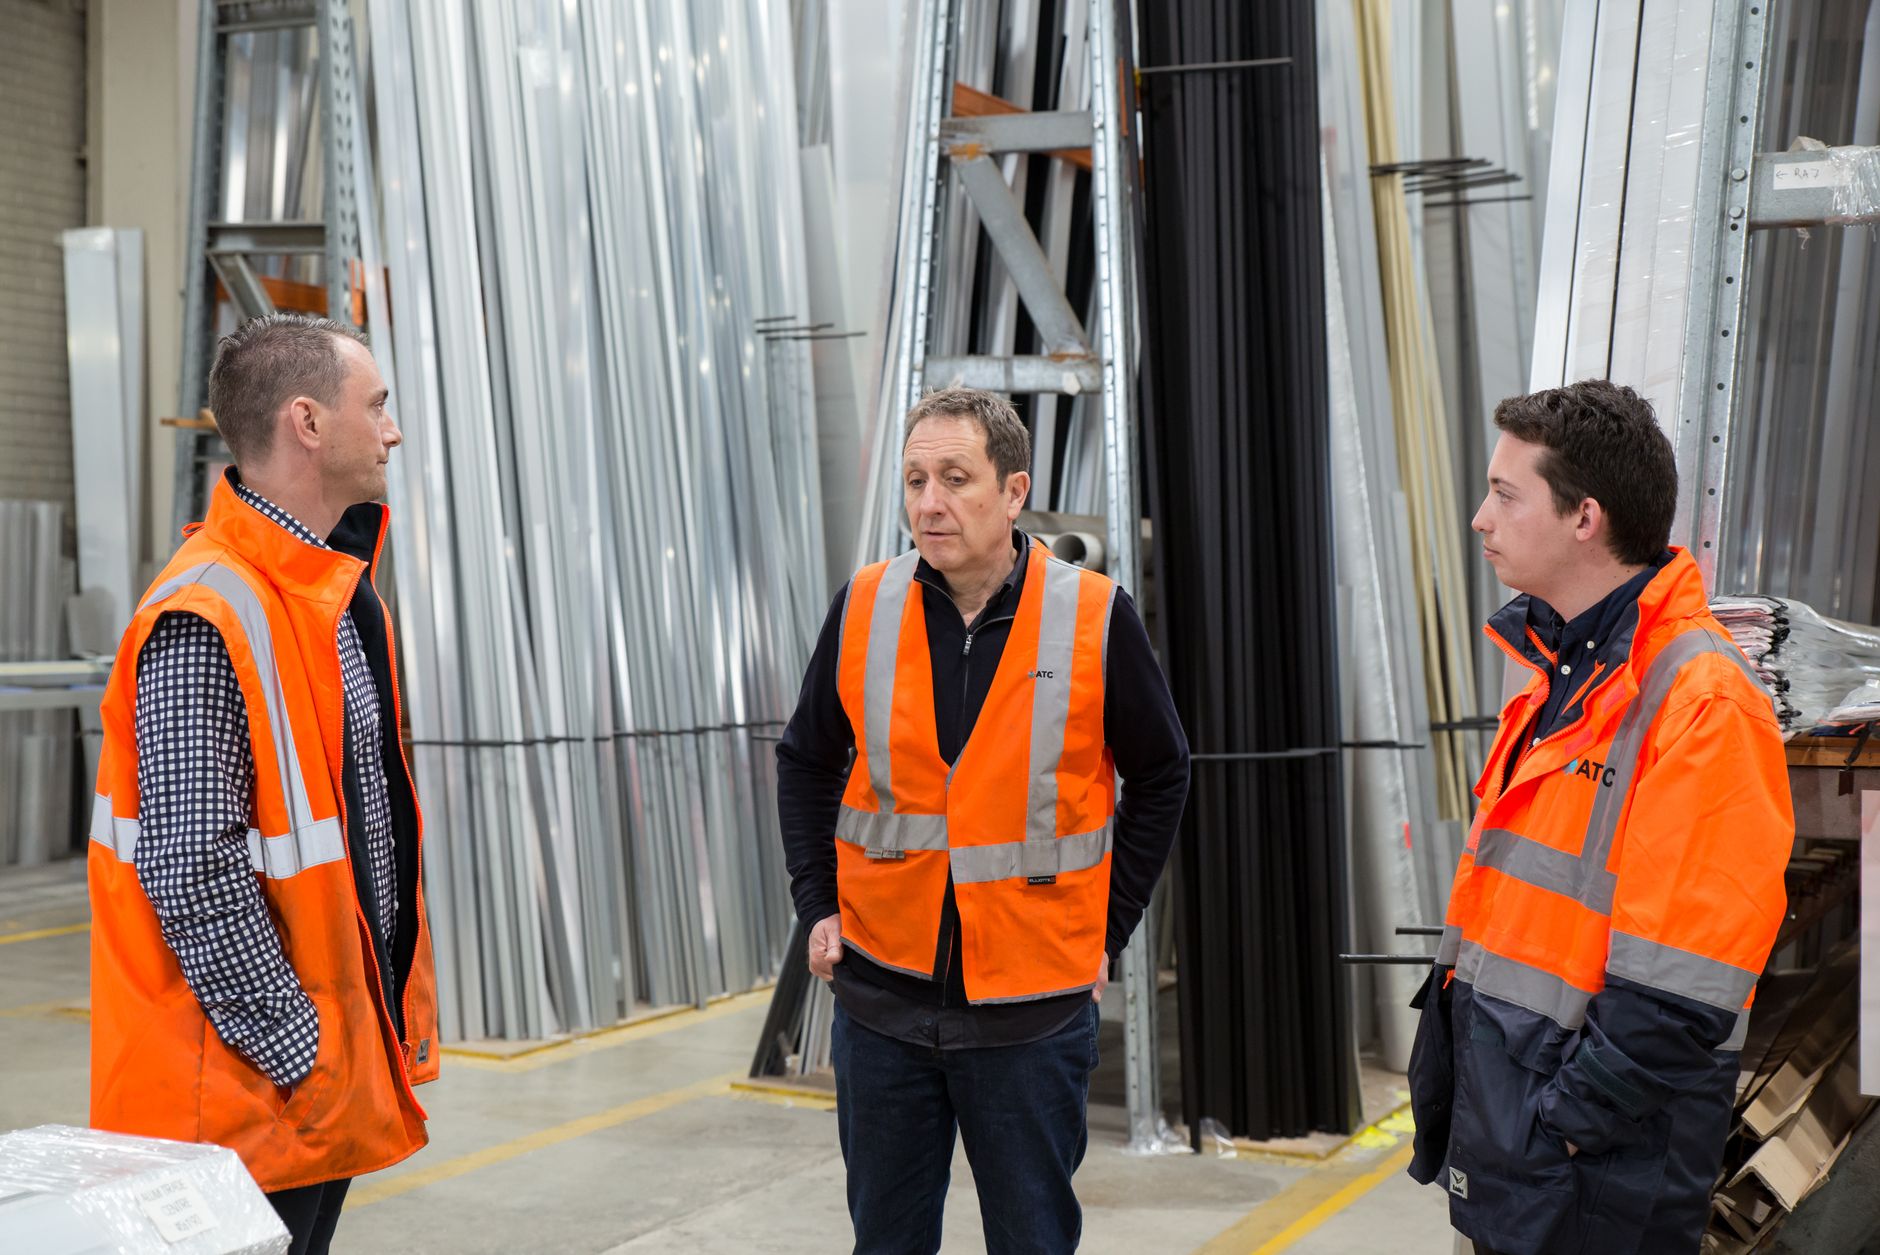
A precise figure comes from measurement. We map receiving, storage and staging, time the existing night moves, count dock doors and check traffic patterns. From that we pick the right robot for the site, lease it through financing, and quote a fixed lease payment with the service plan shown. The quote is not given before the assessment because any number before it would be a guess.
Ask for the hours the robot is expected to take, the share of work it covers, and how the lease payment and service are set out. We deploy, integrate, train and service the robot nationwide, with on-site dispatch and remote triage, so one partner handles the full lifecycle. Check each assumption in the range against your own night shift data before you decide.
Frequently asked questions
Want an autonomous forklift at your beverage distributor?
Tell us about your site. We will recommend the robot, quote the lease, and keep it serviced.
Sources
- US Bureau of Labor Statistics, Occupational Employment and Wage Statistics (OEWS May 2024)
- Bureau of Labor Statistics, Occupational Outlook Handbook: Hand Laborers and Material Movers
- Bureau of Labor Statistics, fatal occupational injuries involving forklifts, 2017 fact sheet
- 2025 warehouse robotics adoption article
- 2026 warehouse automation article