
The short answer
The autonomous forklift ROI for cannabis distributors comes from the labor hours spent on repeat pallet moves, fewer handling errors on high-value tracked inventory, and the lease cost measured against both over the lease term. The savings range depends on how much of that moving a robot realistically takes, how many shifts it runs, and how the site records transfers. A free site assessment turns that range into a precise figure and a lease quote.
Key takeaways
- Returns come from repeat pallet moves the robot takes over, not from replacing the whole team.
- The labor side is valued on the local wage for Laborers and Freight, Stock, and Material Movers, Hand.
- Tracked, high-value inventory makes each handling error costly, which adds upside to the return.
- The share of moves a robot actually takes is the input that moves the savings range the most.
- A precise figure comes from a free site assessment, followed by a lease quote.
Run the numbers for your site
Pick your city or state for a real regional number - we use the real BLS wage there. (On the live site this auto-detects from your location.)
What do you want to automate?
The robot takes the repetitive cart and pallet moves off the heaviest motion.
What is the autonomous forklift ROI for cannabis distributors?
The autonomous forklift ROI for cannabis distributors is the value of the repeat pallet moves a driverless truck takes over, set against what those hours cost and what the lease costs over its term. Much of a distributor floor is that kind of work: receiving, putaway, restocking and staging the same product lanes again and again. The question that decides the return is how much of that work a robot can take on at your site, and what that work is worth.
This page covers where the return comes from, how the savings range is built, what moves it up or down, the risks to the return, and a realistic timeline. Every range here is a range, not a promise. The figures that matter for your building come from the site assessment, not from a general guide.
Where does the return come from in a cannabis distribution center?
The return comes from three places. The first is labor hours spent on repeat moves between the receiving dock, climate-controlled storage and outbound staging. The second is fewer handling errors on inventory that is high in value and tracked package by package. The third is steadier throughput, because a robot runs the same route and stop points each shift instead of varying with who is working.
The labor side is valued on the local wage for Laborers and Freight, Stock, and Material Movers, Hand, which is the government wage data shown beside this page. Only the hours of that kind of work the robot takes over count toward the return. Supervisor time, inventory control and compliance review stay where they are today, so they are not counted as savings.
The error side is harder to pin down. Each avoided miscount can mean a recount, a delayed transfer or a manifest correction, and those costs vary from site to site. We include error savings in the range only when your own records show these events happen often enough to matter. Until then, treat them as upside.
- Labor hours on repeat dock, storage and staging moves
- Fewer handling errors on tracked, high-value product
- Steadier throughput that does not depend on one person's shift
Median hourly wage, Laborers and Freight, Stock, and Material Movers, Hand
$4,380
Monthly cost of one full-time worker, at the median wage plus payroll costs (an estimate, not a quote).
How does the savings math work?
The basic math has three parts. First, the hours of pallet moving the robot takes over in a week, valued at the local wage for that work. Second, the value of recovered time from fewer handling errors, where your records support it. Third, the lease cost over the term, quoted after the assessment. The savings range is the first two parts less the third, shown as a low case and a high case.
The most important input is the share of the work a robot realistically takes. A robot does not take every move. Full repeat routes between fixed points are the easiest to hand over, while irregular, damaged or mixed loads usually stay with staff. The low case assumes a smaller share, and the high case assumes a larger share the site has shown it can support.
Compare the range against the manual baseline as it runs today, not against an ideal. If staff already run a route with idle time between moves, the offset is smaller than a simple pallet count suggests. Ask the assessment to time the existing route before you accept any range, including the one we provide.
How many people and hours does this work take?
Laborers and Freight, Stock, and Material Movers, Hand is a large occupation. According to the Bureau of Labor Statistics Occupational Outlook Handbook, the broader hand laborers and material movers group had about 7.0 million jobs in 2024, with a 4% outlook from 2024 to 2034, as fast as average. O*NET, drawing on BLS projections, puts the narrower Laborers and Freight, Stock, and Material Movers, Hand group at 2,988,900 jobs in 2024, rising to a projected 3,033,100 in 2034, with about 384,300 openings a year.
Turnover matters because a site that keeps replacing people keeps paying to hire and train them. According to the BLS Job Openings and Labor Turnover Survey, the 2025 annual average was 7.1 million job openings, down 571,000 from 2024. The openings rate was 4.3% in 2025 against 4.6% in 2024, and the hires rate was 3.3% against 3.4%. These figures cover all industries, so they describe the background labor market rather than cannabis specifically.
We found no formal survey of headcount at a single cannabis distributor. A California distributor case study, written by a vendor with a commercial interest, estimates 10 to 30 employees per distributor. Treat that as a rough starting point. The number that drives your return is how many staff move pallets across a shift, and the site assessment measures that directly.
The retail side of the market is larger. According to a trade publication reporting a vendor-reported cannabis industry count, nearly 15,000 dispensaries and retail outlets operated in the US in early 2025. Those outlets are customers of distributors rather than distributors themselves, so the count describes demand for the product that moves through your building.
Why do handling errors cost more with tracked inventory?
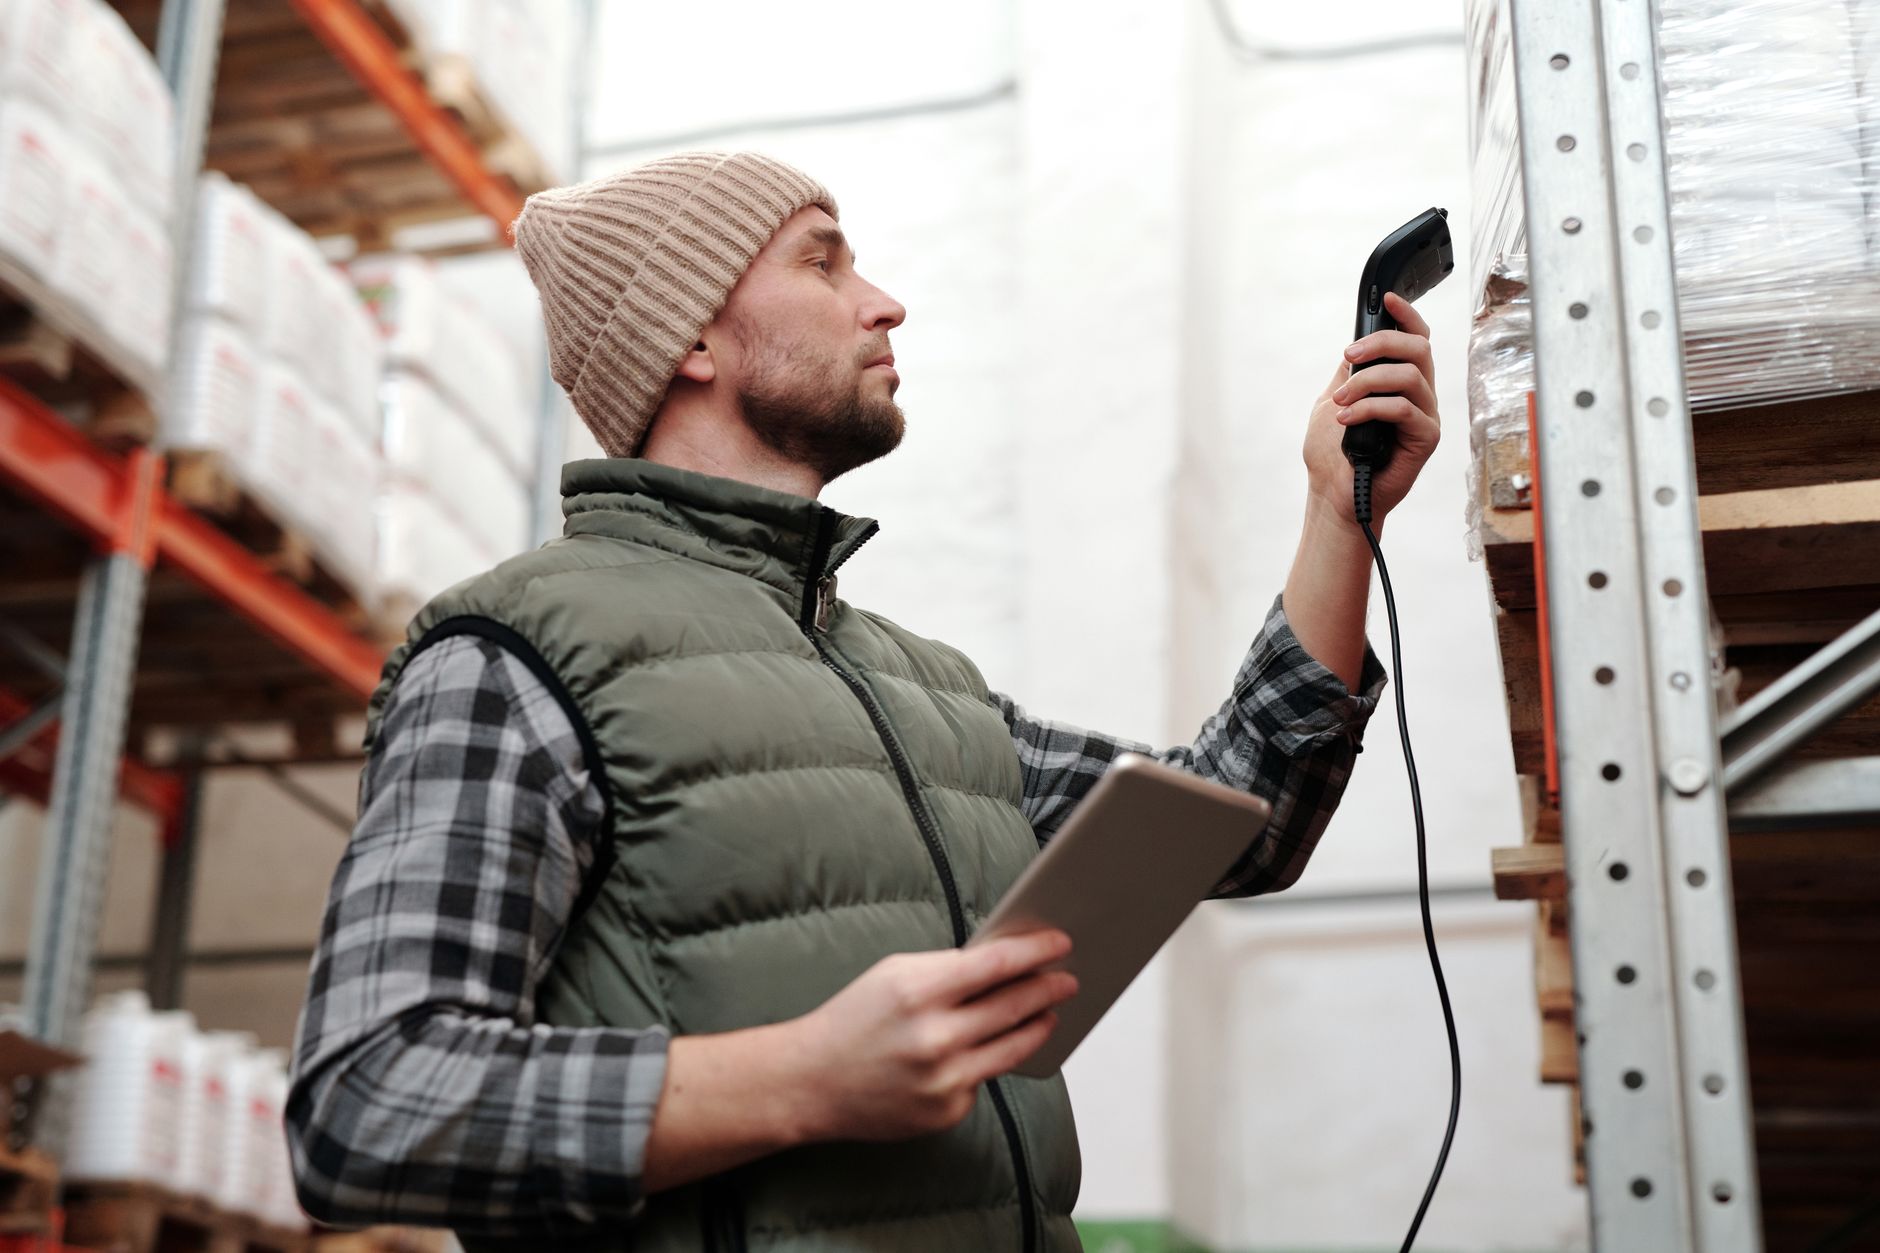
Cannabis product moves under a state track-and-trace system. Product must be in a container with an assigned package tag before it is transported, and each transfer has to match the manifest. When the wrong package appears on a manifest or the quantity is off, the discrepancy must be reconciled before the record is clean.
A Minnesota transfer best practices bulletin lists common receiving errors, including an incorrect package on the manifest and a wrong quantity. Other state bulletins warn that sale edits can become unavailable once a package has been transferred out. A Nevada bulletin asks facilities to verify and validate incoming and outgoing inventory within 24 hours before confirming receipt. An error found after product leaves the building costs more to correct than one caught at the dock.
Consistency is the benefit here. A robot runs the same route and stop points each time, so variation in how moves are executed falls. It does not replace verification. Staff still check counts and manifests at receiving, and the return shows up as fewer exceptions to fix after transfer, not as the removal of the check.
What changes the number up or down?
Volume and route length matter most. Many repeat moves per shift on a long, fixed route raise the value of the robot's share. Short, irregular moves with frequent stops lower it, because the robot spends more of its time waiting or handing work back to staff.
The building matters too. Cold or humid storage rooms need a unit rated for those conditions, and floor condition, racking layout and aisle width shape the site map and how much of the route the robot can run. State rules also change the integration work, since manifest fields and transfer types vary by state.
Finally, the number depends on how shifts are staffed. Extra shifts raise the return only when someone is in place to handle exceptions. Without that coverage, the robot's share falls during the hours nobody is there to clear its handoffs.
What are the risks to the return and how do you avoid them?
Forklift injuries are a serious concern in any warehouse. A safety industry summary of forklift accident statistics, which cites OSHA figures, reports about 97,000 forklift injuries a year in US workplaces, of which about 35,000 were serious and about 62,000 non-serious. For 2020, the same summary attributes 78 work-related deaths and 7,290 nonfatal days-away injuries to forklifts. Those 2020 figures are several years old, so check the latest OSHA releases before relying on them.
The main risks to the return are low use, slow integration and staff who work around the robot instead of with it. Low use usually means routes that are too short or too irregular. Avoid it by starting with one unit, measuring its share of the work for a set period, and training staff on exception handling before scaling up.
Plan for downtime as well. A robot out of service removes the offset for every hour it is down. Service coverage therefore matters as much as the initial setup, and it should be written into the agreement.
What is a realistic timeline from assessment to payback?
The timeline starts with a site assessment, which maps routes, storage conditions and the transfer workflow. A lease quote follows once the range is set. Integration and deployment come next, then staff training and go-live support. Our deployment team handles the integration work so your staff can keep running the floor during setup.
Payback depends on the savings range and the lease cost over the term. Mapping and integration complexity set the start date, so the assessment gives a timeline built on your site rather than a generic one. A phased start is often the safer path: the first unit proves its share of the work before a second unit is added. We do not promise a payback date.
Expect an early period where the hours are not yet fully reduced. Staff are learning the exception process, and routes may need small changes after the first weeks of live operation. Build that period into planning so early numbers are not read as the final result.
How do you get a precise figure from a free site assessment?
We pick the right robot for the site, lease it through financing, deploy and integrate it, train the staff and service it nationwide. The assessment is free, and it is the step that turns the savings range on this page into a figure for your building.
Bring the daily count of repeat moves, the distances between dock, storage and staging, the number of shifts, staff time on those moves today, the transfer workflow, and the storage conditions. Also share the local wage you use for this work. The assessment then returns a lease quote and a narrower savings range built on your numbers.
Ask for the quote with its terms in writing: the lease term, what service is covered, how faults are triaged, whether a backup unit is available, and what counts as downtime. Those terms set how much of the savings range you can count on, so review them as closely as the headline figures.

Frequently asked questions
Want an autonomous forklift at your cannabis distributor?
Tell us about your site. We will recommend the robot, quote the lease, and keep it serviced.
Sources
- US Bureau of Labor Statistics, Occupational Employment and Wage Statistics (OEWS May 2024)
- Bureau of Labor Statistics Occupational Outlook Handbook
- O*NET OnLine occupation trends for SOC 53-7062
- BLS Job Openings and Labor Turnover Survey
- Safety industry forklift accident statistics summary
- Trade publication report on cannabis retail outlet count
- Minnesota transfer best practices bulletin
- Nevada transfer type bulletin
- Vendor case study on California distributor staffing