
The short answer
Autonomous forklift ROI for plumbing supply distributors comes mainly from repeat pallet moves between racking and dock doors that a driver works through on the night shift, where open shifts are hardest to fill. The savings are a range built from the share of that work a robot covers, the labor hours it offsets and a fixed robot lease payment quoted after a free site assessment. The range is an estimate, not a promise, and a phased pilot turns it into a measured figure.
Key takeaways
- The return comes from repeat pallet moves on the night shift, not from cutting a whole crew.
- Savings are a range built from the share of work a robot covers, the hours it offsets and the lease payment.
- Turnover makes night shift hours hard to staff, so model the hours you cannot fill.
- Route planning and dock traffic controls belong in the return from the first day.
- A phased deployment replaces the estimate with a measured figure before you commit more units.
Run the numbers for your site
Pick your city or state for a real regional number - we use the real BLS wage there. (On the live site this auto-detects from your location.)
What do you want to automate?
The robot takes the repetitive cart and pallet moves off the heaviest motion.
Where does the return on an autonomous forklift come from?
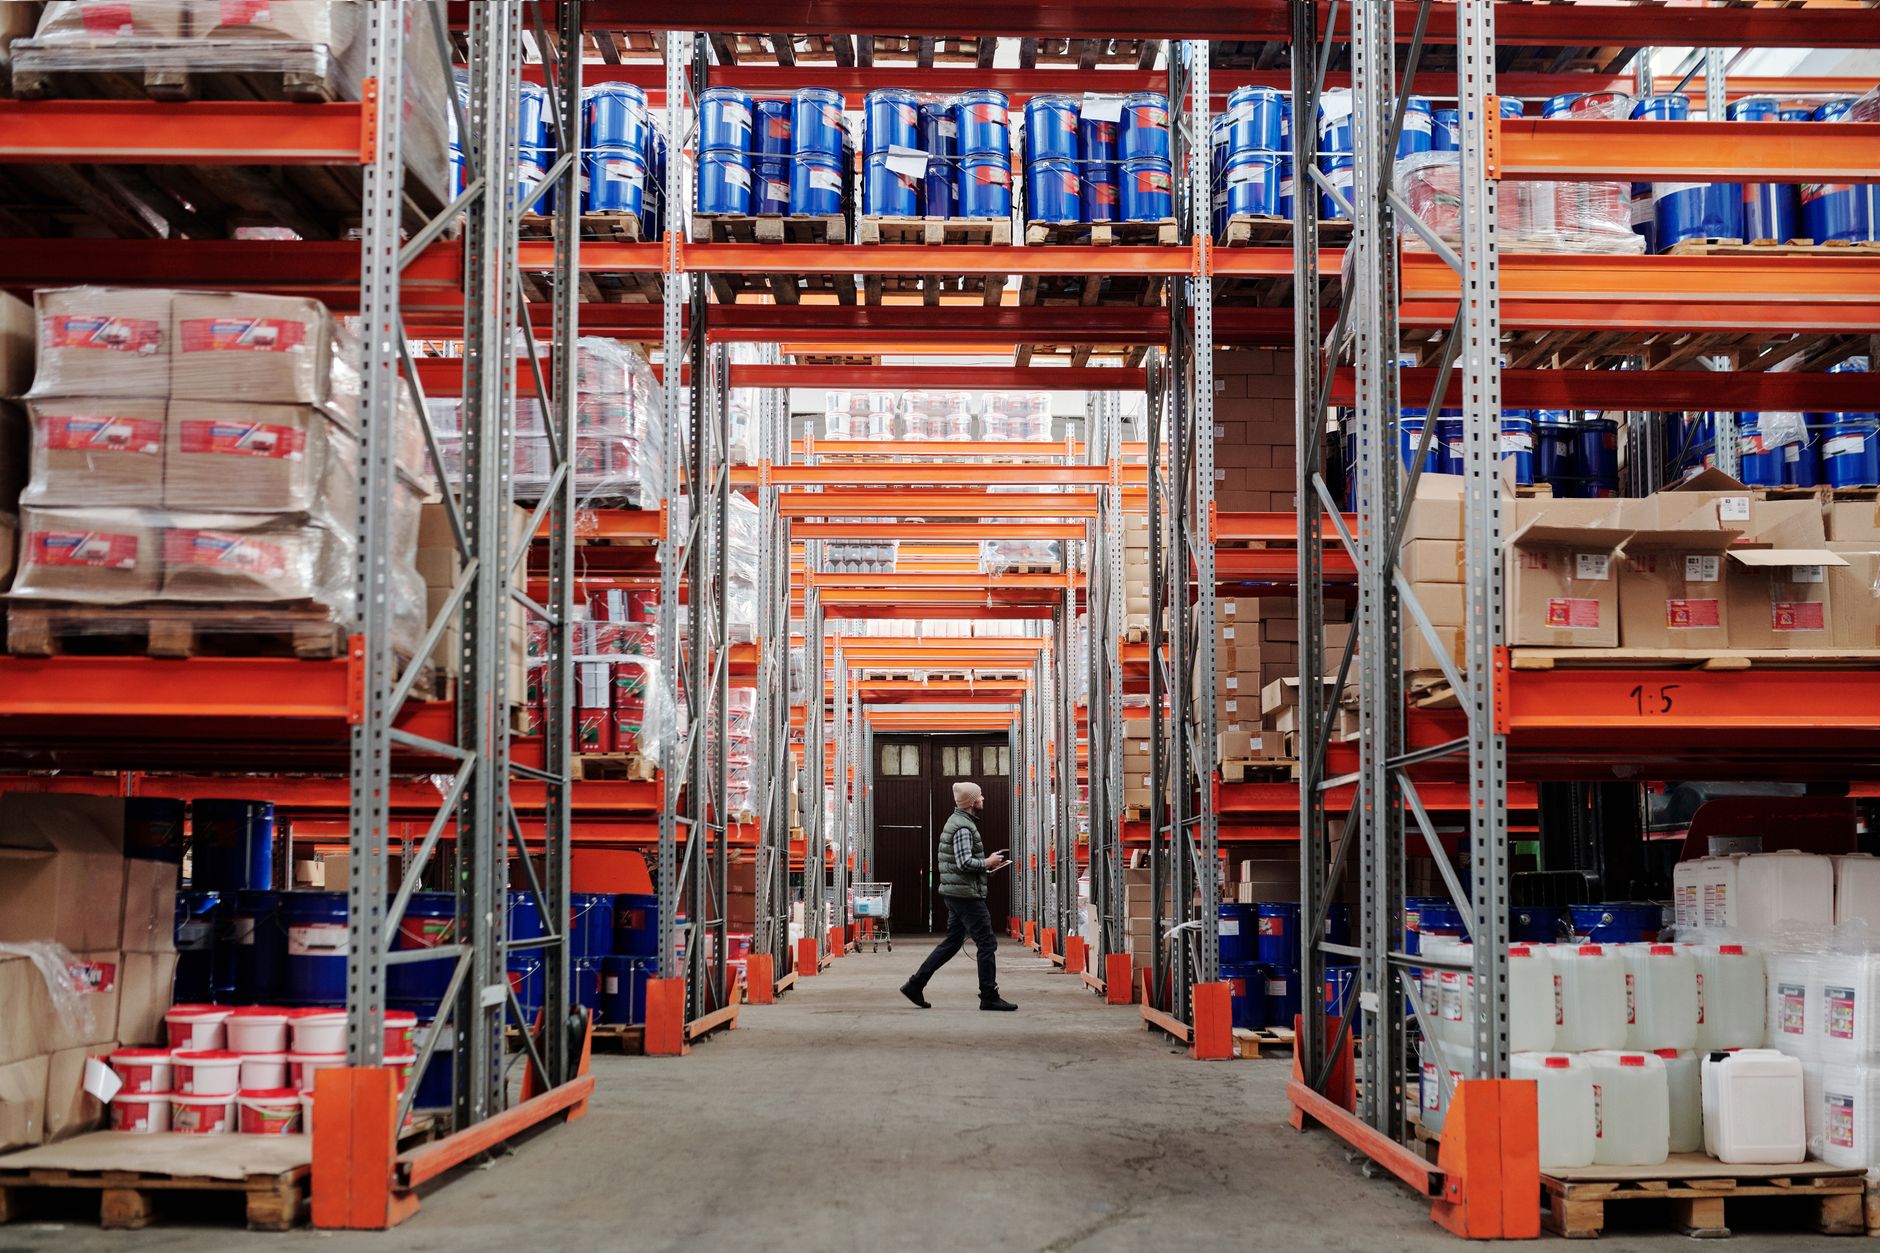
Autonomous forklift ROI for plumbing supply distributors comes from one narrow place: the repeat pallet moves between racking and dock doors that a driver works through on the night shift. A plumbing supply warehouse runs the same aisles and the same loops for hours, and that repetition is what a robot handles well. Most of the return is labor hours offset on the shift that is hardest to staff, not a reduction in the whole team.
The return is a range. It depends on how much of the driver's time is repeat moves, how many of those hours a robot can cover safely, how the fixed lease payment compares with those hours, and how the aisles and dock doors are laid out. We do not promise one figure. We measure these inputs in a free site assessment and then give a lease quote built on them.
Keep the setting in view throughout. This page describes a plumbing and heating equipment wholesaler with racking, a dock and fixed aisles. Your site may differ, so treat the numbers here as planning inputs, not a forecast of your result.
How many plumbing supply distributors are there in the US?
According to an industry aggregator summary of Census County Business Patterns, the NAICS group for plumbing and heating equipment and supplies, hydronics merchant wholesalers, had 6,410 establishments and 84,257 employees in 2023. That works out to about 13 employees per establishment on average, counting all staff, not only the people who drive forklifts. The same summary cites a Small Business Administration size standard of 200 employees for this group, a useful benchmark when you compare your own headcount.
A single warehouse with one dock area and fixed aisles is the easiest layout to measure, because the loop repeats in the same place. Multi-site distributors can run the same model site by site.
We did not find a published count of forklift drivers per plumbing distributor site. Your own shift roster and pick records will give a better number than any national average, and the site assessment starts there.
Median hourly wage, Laborers and Freight, Stock, and Material Movers, Hand
$4,380
Monthly cost of one full-time worker, at the median wage plus payroll costs (an estimate, not a quote).
Why is night shift forklift labor hard to keep?
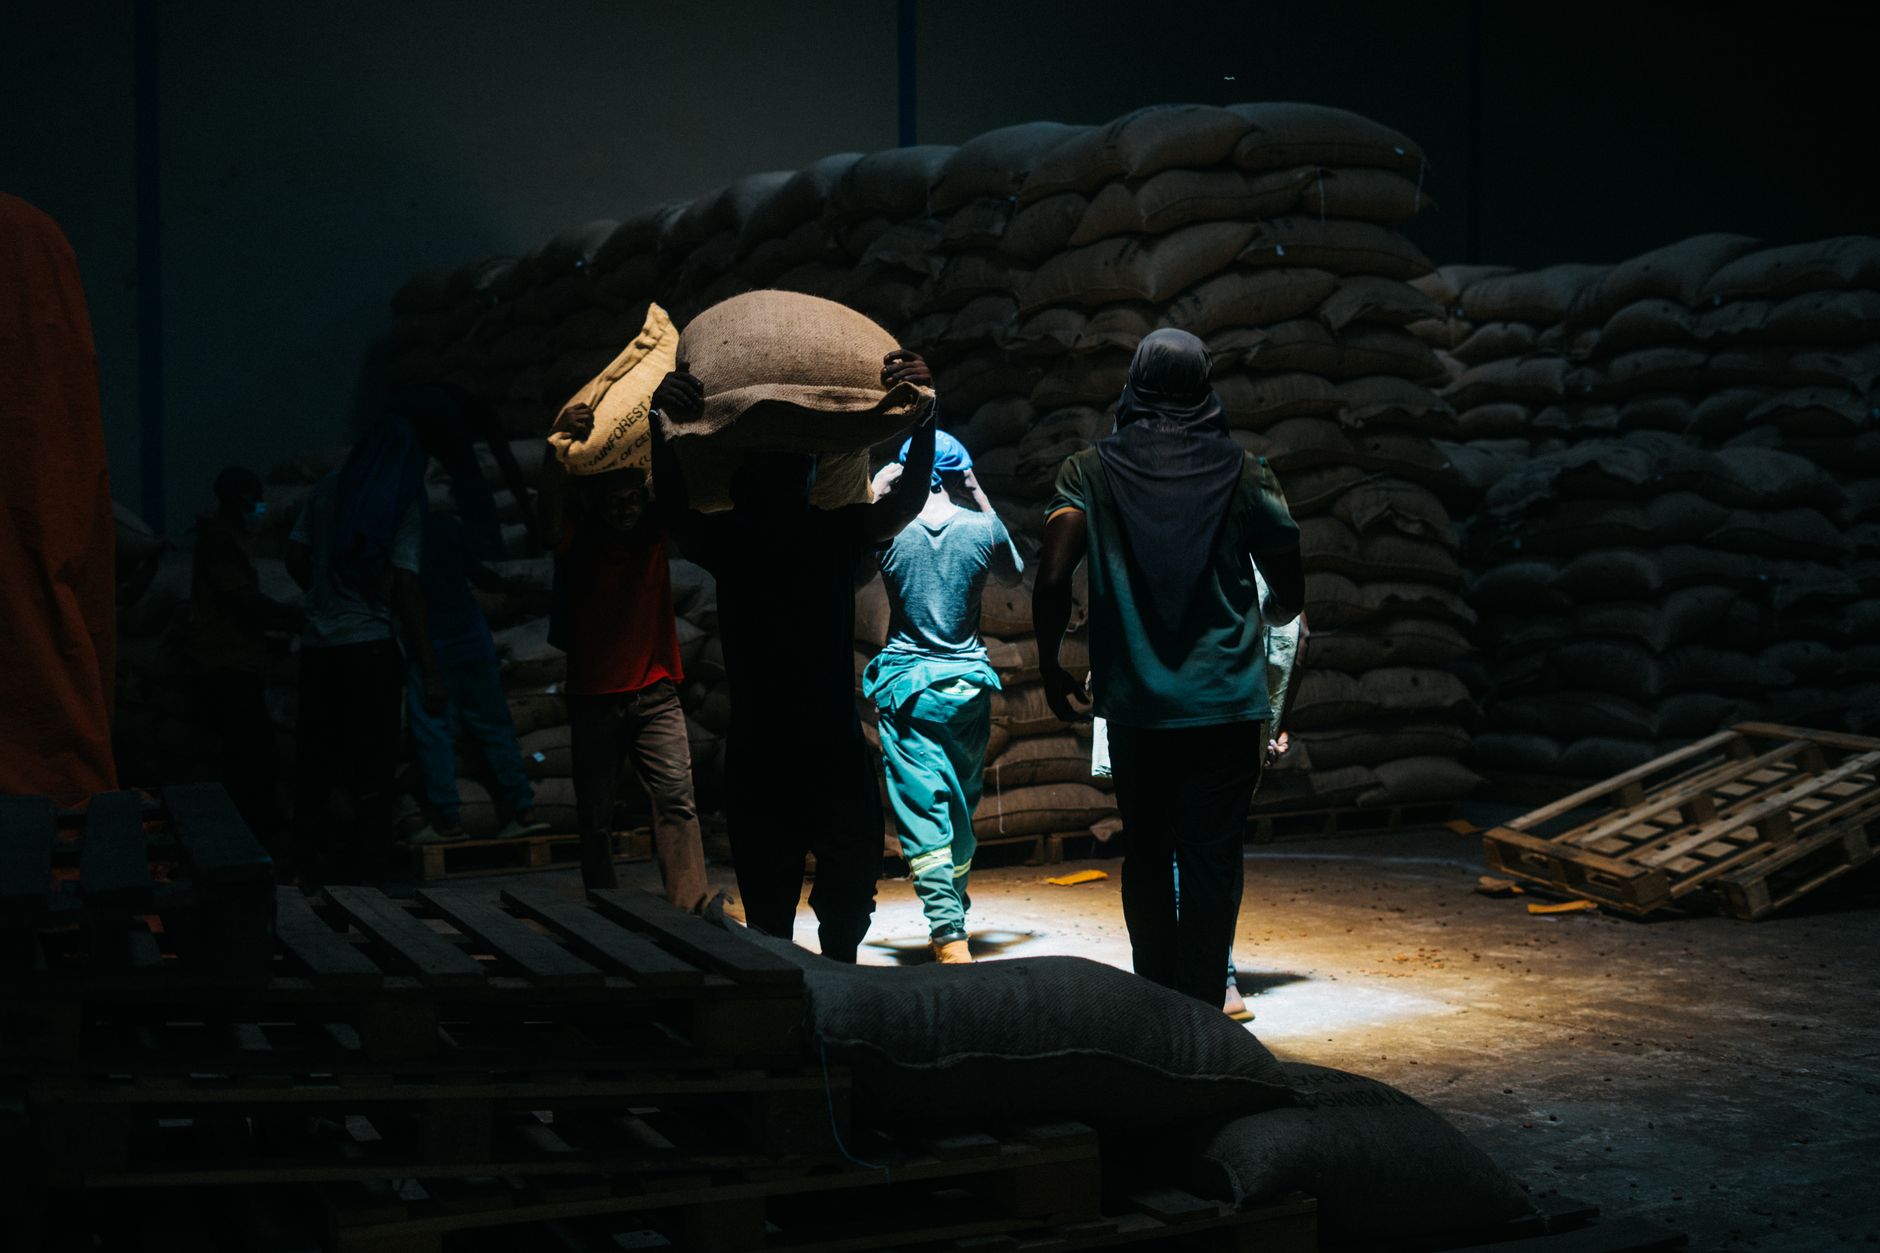
Turnover is the labor problem most distributors describe. A 2025 State of Warehouse Labor report, a vendor survey, found that most respondents reported turnover below 10%, but a notable minority reported 20% or higher. Forklift operators were named among the hardest roles to staff. A site at the high end of that range keeps training new drivers, and each new driver needs time before working a loop alone.
An older trade publication survey, from around 2017, reported that 39.2% of facilities had turnover under 10% a year. The two sources differ in year and sample, so do not merge them, but together they show that low turnover has never been guaranteed.
Federal data points the same way. According to the Bureau of Labor Statistics, quits fell by 49,000 in transportation, warehousing and utilities in July 2025, while the overall quits rate held at 2.0%. The Federal Reserve Bank of St. Louis reports a quits rate for trade, transportation and utilities of 2.6% in December 2025 and 2.3% in January and February 2026. That group includes wholesale trade, where plumbing distributors sit, but it is a broad sector rate, not a plumbing distributor rate.
The point for planning is simple. Night shift hours that go unfilled are a real cost, and the robot should be modeled against those hours, not against a full crew that is already in place.
What work does the robot take off the night shift?
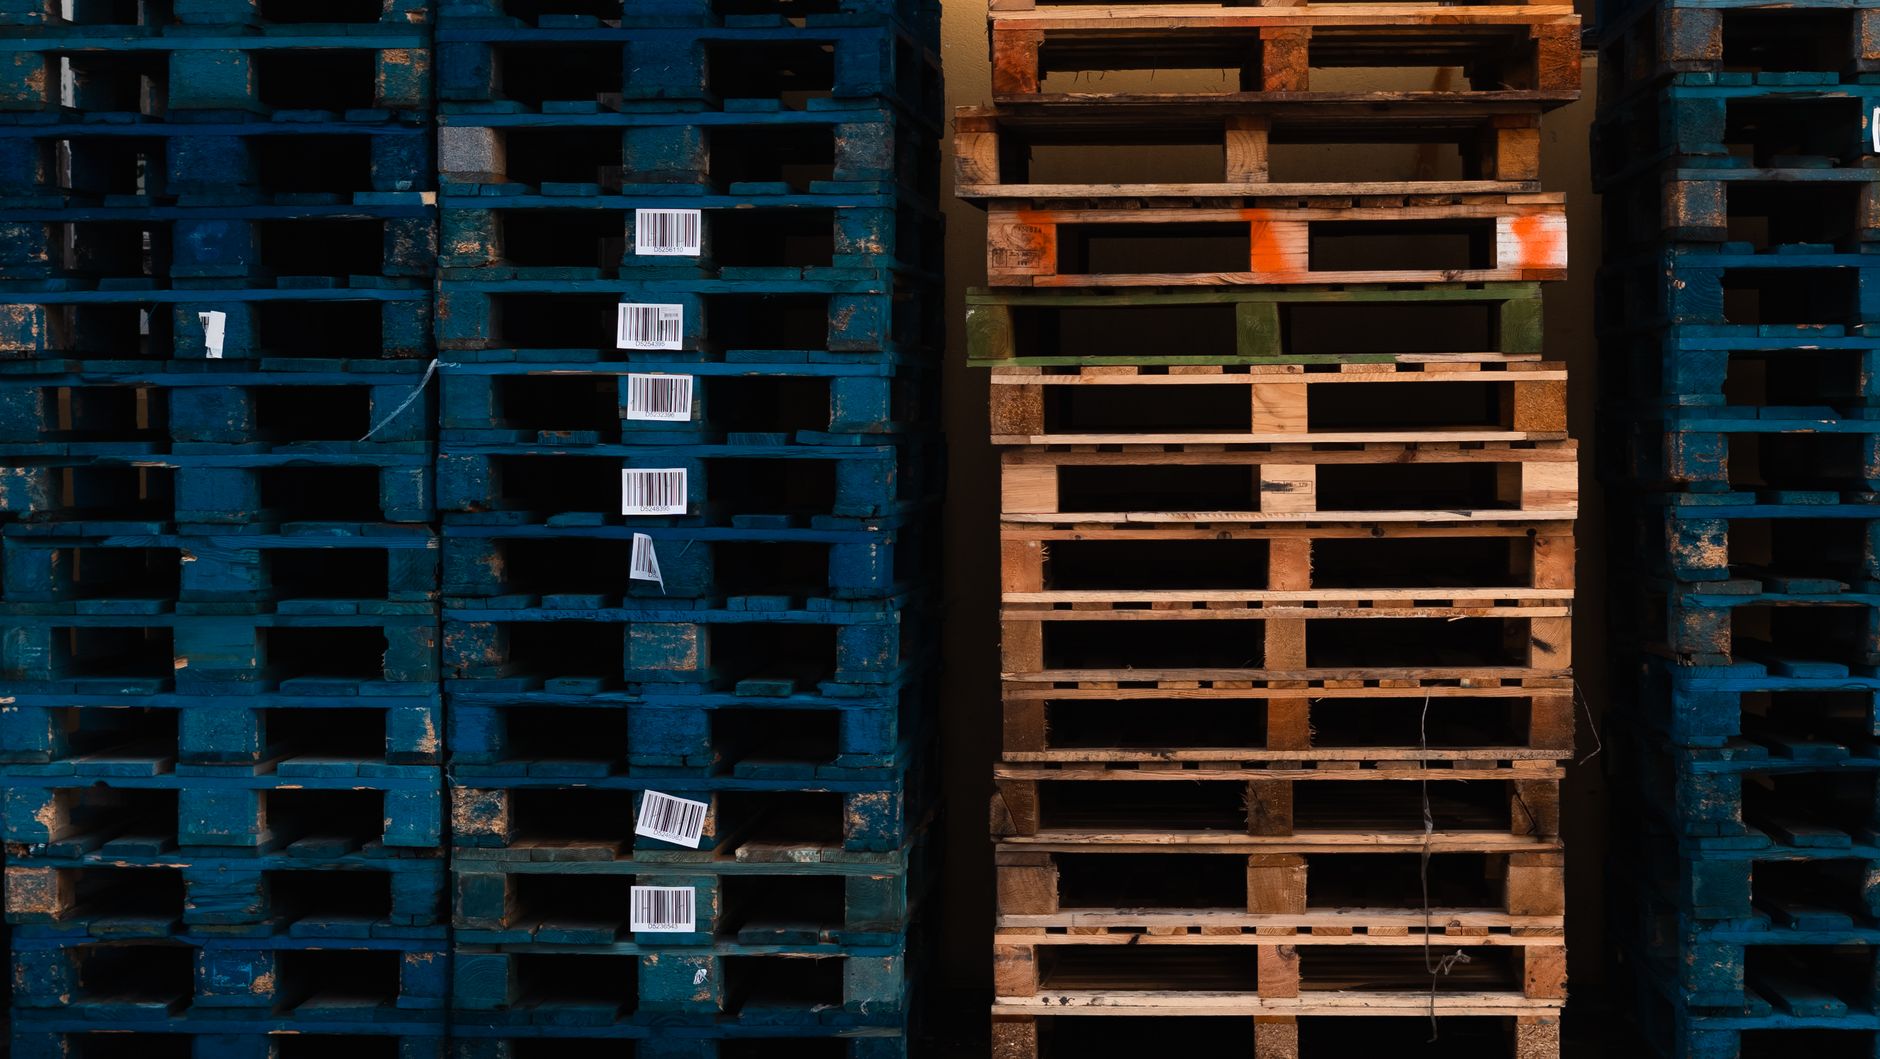
The robot's share of the work is the repeat pallet move. In a plumbing supply warehouse that usually means fittings, valves, pipe and fixture cartons moving from racking to staging near the dock doors, and empty pallets coming back. The move itself is simple. The hours are the issue, because one driver can spend much of a night on the same loop with breaks and handoffs in between.
A robot earns hours only on a loop it can finish safely and repeatedly. Irregular loads, damaged pallets and dock coordination stay with people, and the model should show that split clearly. The labor side of the math is the hours of laborers and freight, stock, and material movers, hand work that the robot takes over. The savings figures are priced on that kind of work, not on the forklift driver job title, and the government wage data on this page shows the local wage for that job.
The hours-table below lists the tasks we see most often in this setting. Hour figures for your site come from shift logs and the site assessment, not from national averages.
How does the savings math work?
The core math is simple. Take the hours of repeat moving the robot covers each week, price those hours at the wage for the work they replace, and then subtract the fixed robot lease payment and any service cost that sits outside the lease quote. The savings range comes from low and high estimates of each input, not from one guess.
The share of work a robot realistically takes is the input most often overstated. A loop that looks like a full shift on paper often includes stops a robot cannot cover, such as staging that needs a person to check paperwork. So we model a share, not a total, and run it low and high. The lease quote fixes the payment cost, so the covered share is the variable to test, and a higher covered share moves the result faster than a lower one.
Phased deployment keeps the math honest. Starting with one leased unit lets you measure the real covered share and the real hours before adding units. A backup robot program or spare unit coverage belongs in the model too, since a stopped loop loses the same hours a missing driver does.
We pick the robot that fits your aisles, arrange lease financing, deploy and integrate it, train your staff and service it nationwide. That puts one team on the whole path from assessment to go live, which is the simplest way to keep the hours you modeled on paper.
What changes the number up or down?
Four factors move the number most: the share of repeat moves in the day, aisle width and traffic at the dock, the number of doors and the mix of loads. A single long loop through open aisles is the best case. A site with many short moves, tight turns and mixed pallet sizes will show a smaller covered share and a longer setup.
Staffing also moves it. If the night crew already runs with open shifts, the offset looks larger in practice, but the stakes rise, because the robot must run reliably when the team is thin. Model the return on the hours you cannot staff, and check that against your vacancy log rather than your org chart.
Use the checklist below before you trust any range, including ours.
What are the risks to the return and how do I avoid them?
The main risks are a low covered share, an unplanned stop that empties the loop, and a layout change after go live. Each one erodes the hours in the model, so plan for them in the numbers instead of hoping they stay away.
Avoid them with a phased deployment, a site map made before go live, and written service terms. Remote triage and on-site dispatch shorten an outage, and a spare unit keeps the loop running while a repair is done. Ask what happens when a layout changes, because a new racking plan can change the route.
Training is a risk too. A unit that runs well with trained staff can still underperform if the people handling exceptions are unclear on the handoff. Build that handoff into the go live plan, with a named person for each shift.
- Repeat pallet moves
Autonomous Forklift
Strong: runs the same route with consistent timing
Staff
Works well, but slows and tires over a long loop
- Night coverage
Autonomous Forklift
Runs the route through the night when charged and in service
Staff
Needs breaks, shift handoffs and a relief plan
- Irregular or damaged loads
Autonomous Forklift
Weak: needs a person to judge the load and the fix
Staff
Strong: judges the load and decides the fix
- Dock coordination and exceptions
Autonomous Forklift
Limited to routes and signals set in advance
Staff
Strong: talks to dock staff and adjusts on the spot
- Hiring and training
Autonomous Forklift
Needs no new hire to run the route, but still needs trained staff to supervise
Staff
Hard to fill, and each new hire needs training before working a loop alone
- Cost pattern
Autonomous Forklift
Fixed robot lease payment set through financing
Staff
Hourly labor that moves with shift coverage and overtime
Why does forklift safety belong in the business case?
Forklift safety belongs in the return, because incidents carry costs in hours, injuries and disruption. A CDC and NIOSH abstract on forklift worker deaths from 1980 to 1994 counts 1,021 deaths. Overturns were the largest cause at 22%, followed by workers struck by forklifts working nearby at 20%, crushing at 16% and falls from forklifts at 9%.
More recent figures point the same way. According to a law firm summary of National Safety Council data, 67 workers died in incidents involving forklifts, order pickers or platform trucks in 2023. The Bureau of Labor Statistics fact sheet, using 2017 data, found that forklift-related injuries to pedestrians had the highest median days away from work, at 20 days.
This is why route separation, marked traffic lanes and staff training matter as much as the robot's own sensors. A robot does not remove the need for a clear pedestrian plan, especially at dock doors where people load and unload close to the route.
What is a realistic timeline, and how do I get a precise figure?
A realistic path starts with a free site assessment. It maps the aisles, measures the repeat loop, checks dock traffic and confirms the night crew baseline. The result is a lease quote with its assumptions listed, covering the fixed robot lease payment, the financing terms and the service scope, so you can set it against the hours model.
After a decision, integration and staff training come first, followed by a limited pilot on one unit. The team then measures the covered share over a set period before adding units. Payback follows the measured share, so the pilot is the step that turns a range into a figure you can sign off on. The timeline depends on site readiness and is set during the assessment.
Ask for the quote in writing with every assumption listed, so you can check each input against your own shift data. We pick the right robot for the site, lease it through financing, deploy and integrate it, train the staff and service it nationwide. The free site assessment is where those choices start.
Frequently asked questions
Want an autonomous forklift at your plumbing supply distributor?
Tell us about your site. We will recommend the robot, quote the lease, and keep it serviced.
Sources
- US Bureau of Labor Statistics, Occupational Employment and Wage Statistics (OEWS May 2024)
- Industry aggregator summary of Census County Business Patterns, NAICS 423720
- 2025 State of Warehouse Labor report (vendor survey)
- Trade publication article on warehouse turnover (older survey)
- Bureau of Labor Statistics JOLTS release, July 2025
- Federal Reserve Bank of St. Louis, quits rate for trade, transportation and utilities
- Law firm summary of National Safety Council forklift data
- Bureau of Labor Statistics fact sheet on forklift-related fatal and nonfatal injuries
- CDC/NIOSH abstract, forklift worker deaths 1980 to 1994