
The short answer
Autonomous forklift ROI for feed mills comes mainly from the hours of pallet and bag moves a robot takes over on each shift, weighed against the fixed lease payment and the share of moves that follow the route. Feed mills move palletized bags and ingredients between fixed points on predictable routes, which suits the work. Our research found no published benchmark for hours per shift on feed mill moves, so the savings range is an estimate to confirm on your floor, not a promise.
See what a autonomous forklift costsRun the numbers in the ROI calculator
Key takeaways
- The return comes from the repeat moves a robot takes over, not from a headline percentage.
- Feed mills run lean crews per shift, so even a few hours of repeat moves can matter.
- Labor is roughly half of operating cost for feed mills, according to a farm lender's industry report as summarized by Feed & Grain.
- The savings range depends on route fit, shift coverage and the lease quote, and it changes when those inputs change.
- A free site assessment replaces the estimates with your mill's own route and shift data.
Run the numbers for your site
Pick your city or state for a real regional number - we use the real BLS wage there. (On the live site this auto-detects from your location.)
What do you want to automate?
The robot takes the repetitive cart and pallet moves off the heaviest motion.
What is autonomous forklift ROI for feed mills?
Autonomous forklift ROI for feed mills is the return a mill gets when a leased autonomous forklift takes over part of its pallet and bag moving, measured against what the lease costs and what the labor would have cost. The return is not a fixed percentage. It depends on how many moves run on fixed routes, how many shifts the mill runs, and how much of that work a robot can realistically do without a person.
The useful question is not whether a robot can move a pallet, which it can on a fixed route, but how many repeat moves on your mill are regular enough to fill a route across a shift. This page explains where the return comes from, how the savings range is built, what pushes it up or down, and how to get a precise figure. The savings range beside the text comes from the calculator on this page, prefilled for feed mills. Treat it as a starting estimate until a site assessment confirms the route and shift data.
Why do feed mills fit autonomous forklifts?
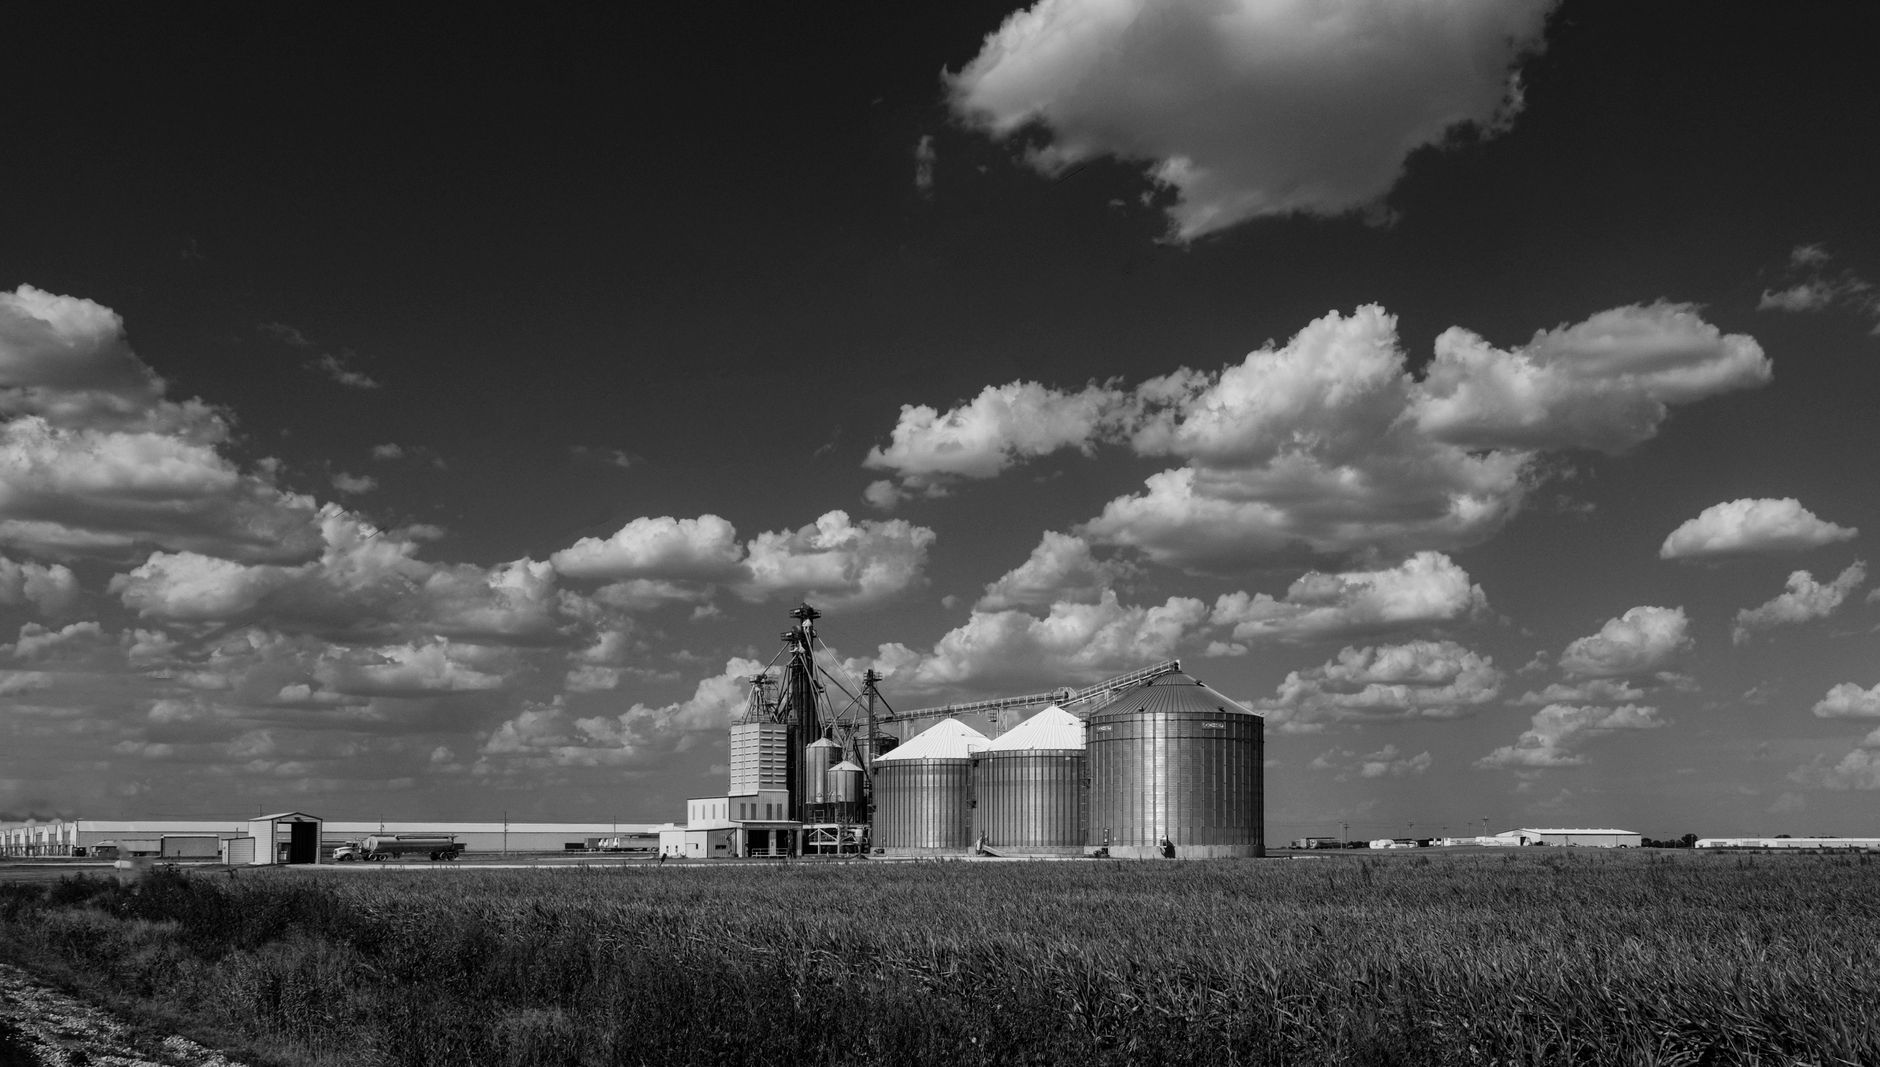
The American Feed Industry Association reports 5,125 feed mills and 523 pet food manufacturing facilities in the US. Those are association figures, not a census table, but they show the setting is large and spread across the country. Feed mills move palletized bags and ingredients between fixed points such as receiving, storage, mixing, bagging and dispatch, and the same routes repeat across shifts.
Predictable routes are what make an autonomous forklift practical. A robot does best on a known path with clear floors and set stop points. Overnight and weekend dispatch loading is a natural fit, since the same route can run whether or not a full crew is on site. Work that changes every hour, such as irregular truck loads or mixed pallet patterns, still needs a person. We did not find a feed-specific adoption figure in our research, so the fit has to be judged on your own route map.
Median hourly wage, Laborers and Freight, Stock, and Material Movers, Hand
$4,380
Monthly cost of one full-time worker, at the median wage plus payroll costs (an estimate, not a quote).
- Fixed route moves
Autonomous Forklift
Runs the same path each shift without breaks
Staff
Runs the route but needs breaks and time off
- Overnight coverage
Autonomous Forklift
Runs the route with no crew on site
Staff
Needs a staffed shift and a replacement when someone is out
- Unplanned loads
Autonomous Forklift
Struggles with loads outside its programmed route
Staff
Adapts to damaged bags, odd pallets and quick changes
- Load checks
Autonomous Forklift
Moves loads it is rated for and stops at faults
Staff
Checks load stability, bag condition and labels by eye
- Recovery after a fault
Autonomous Forklift
Stops and waits for a technician or dispatch
Staff
Clears a minor fault on the spot and keeps going
How many people do this work at one mill?
The American Feed Industry Association also reports about 80,000 direct employees across the industry. Dividing the two association totals gives roughly 16 direct employees per mill. That is our own arithmetic, and the two counts may not cover the same scope. The average mixes small and large plants, so it is a rough guide, not a staffing plan.
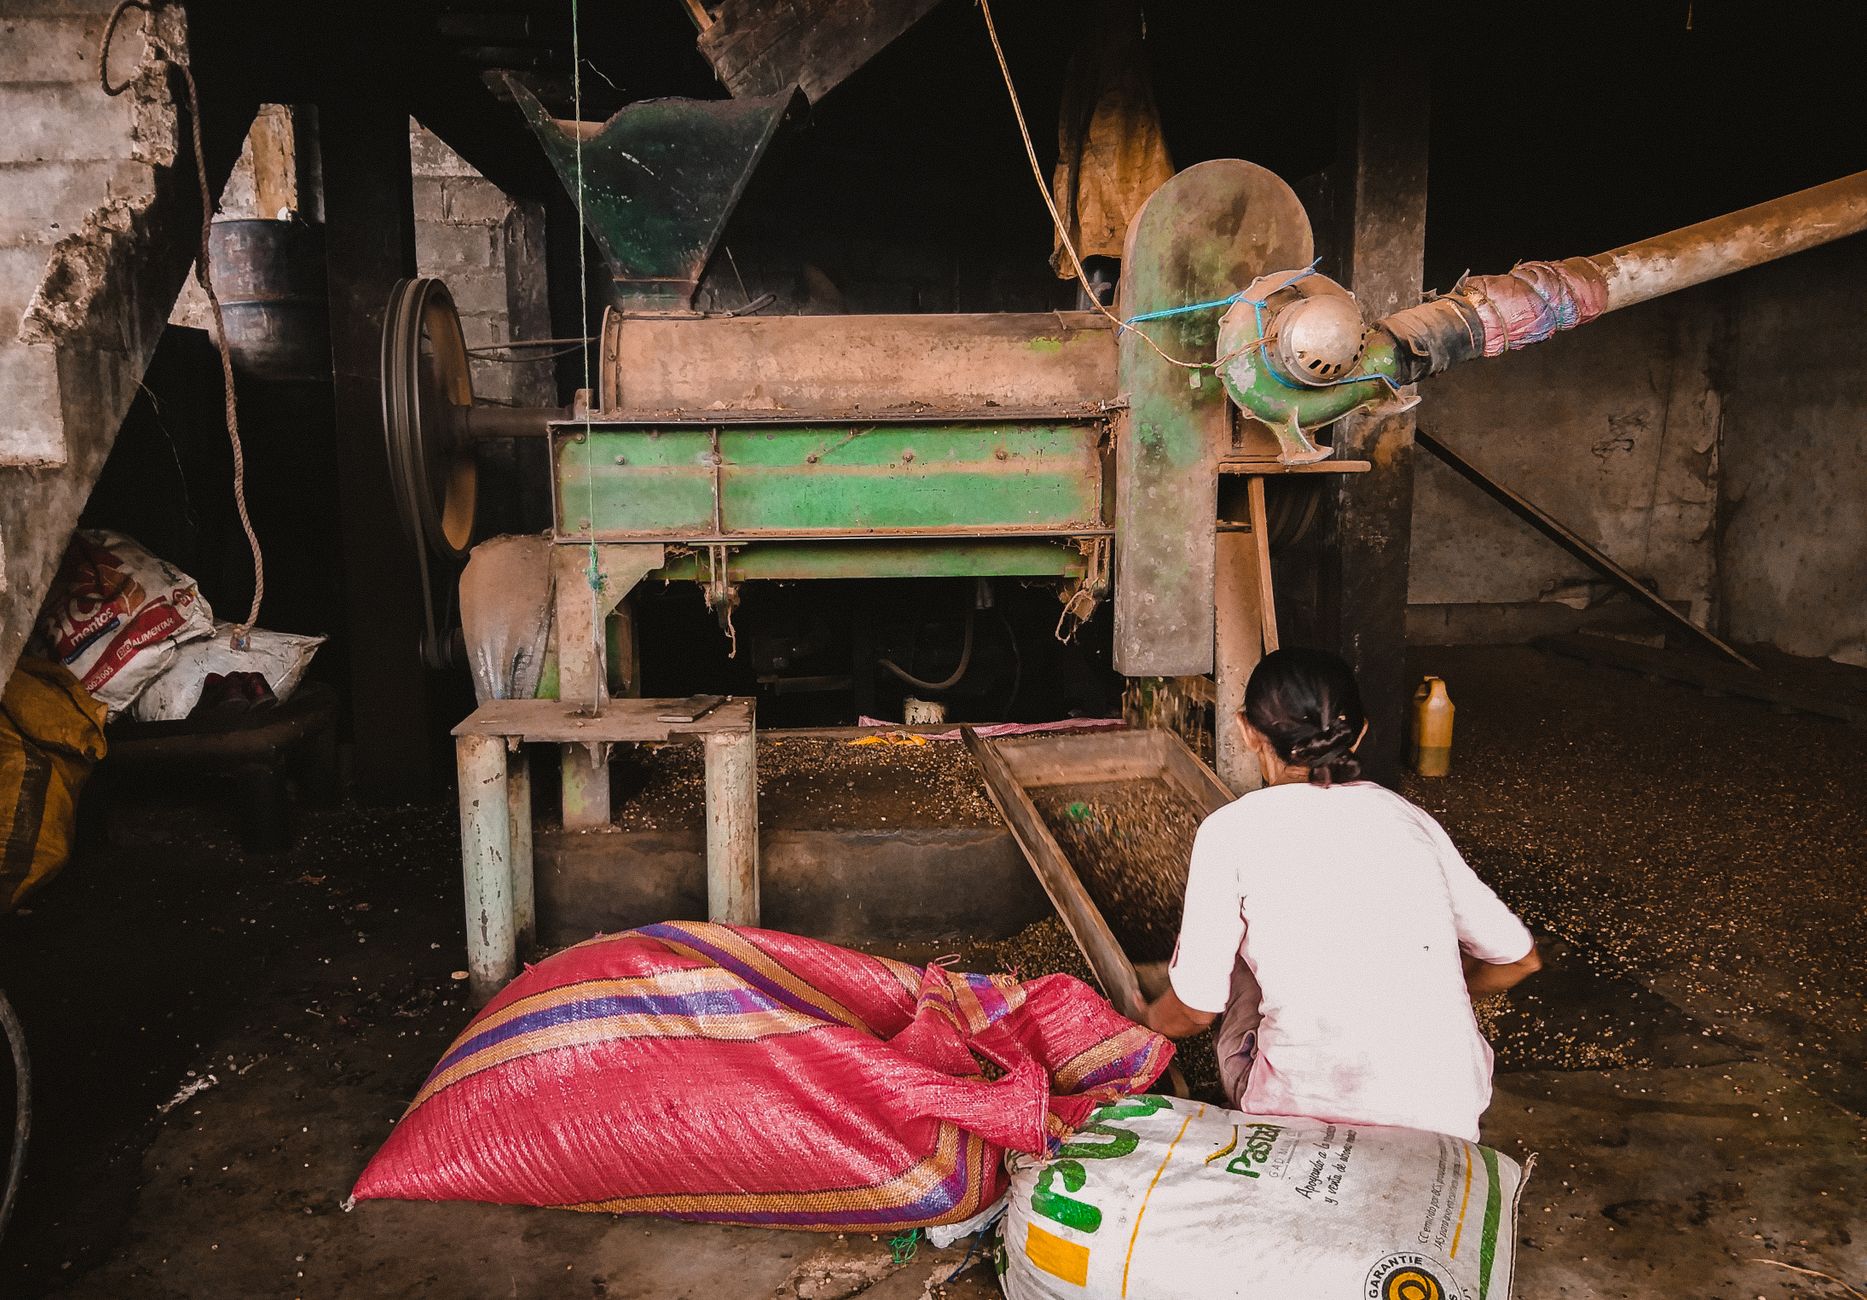
The clearer signal comes from single-site reports. A vendor-hosted case study of a corn mill says manual bagging and palletizing once needed four to six operators per shift and now needs three to run the packaging line. A Texas feed and grain business reported that a robotic packaging system cut bagging labor from five employees to three. Both are company-reported, and both describe packaging crews rather than forklift routes, but they show how many people a single shift can spend on moves.
For this page we use five people doing this kind of work at one mill as the typical headcount. Treat that as a planning anchor. The actual crew on your site depends on bag weight, shift pattern and how many lines the mill runs.
Where does the return come from?
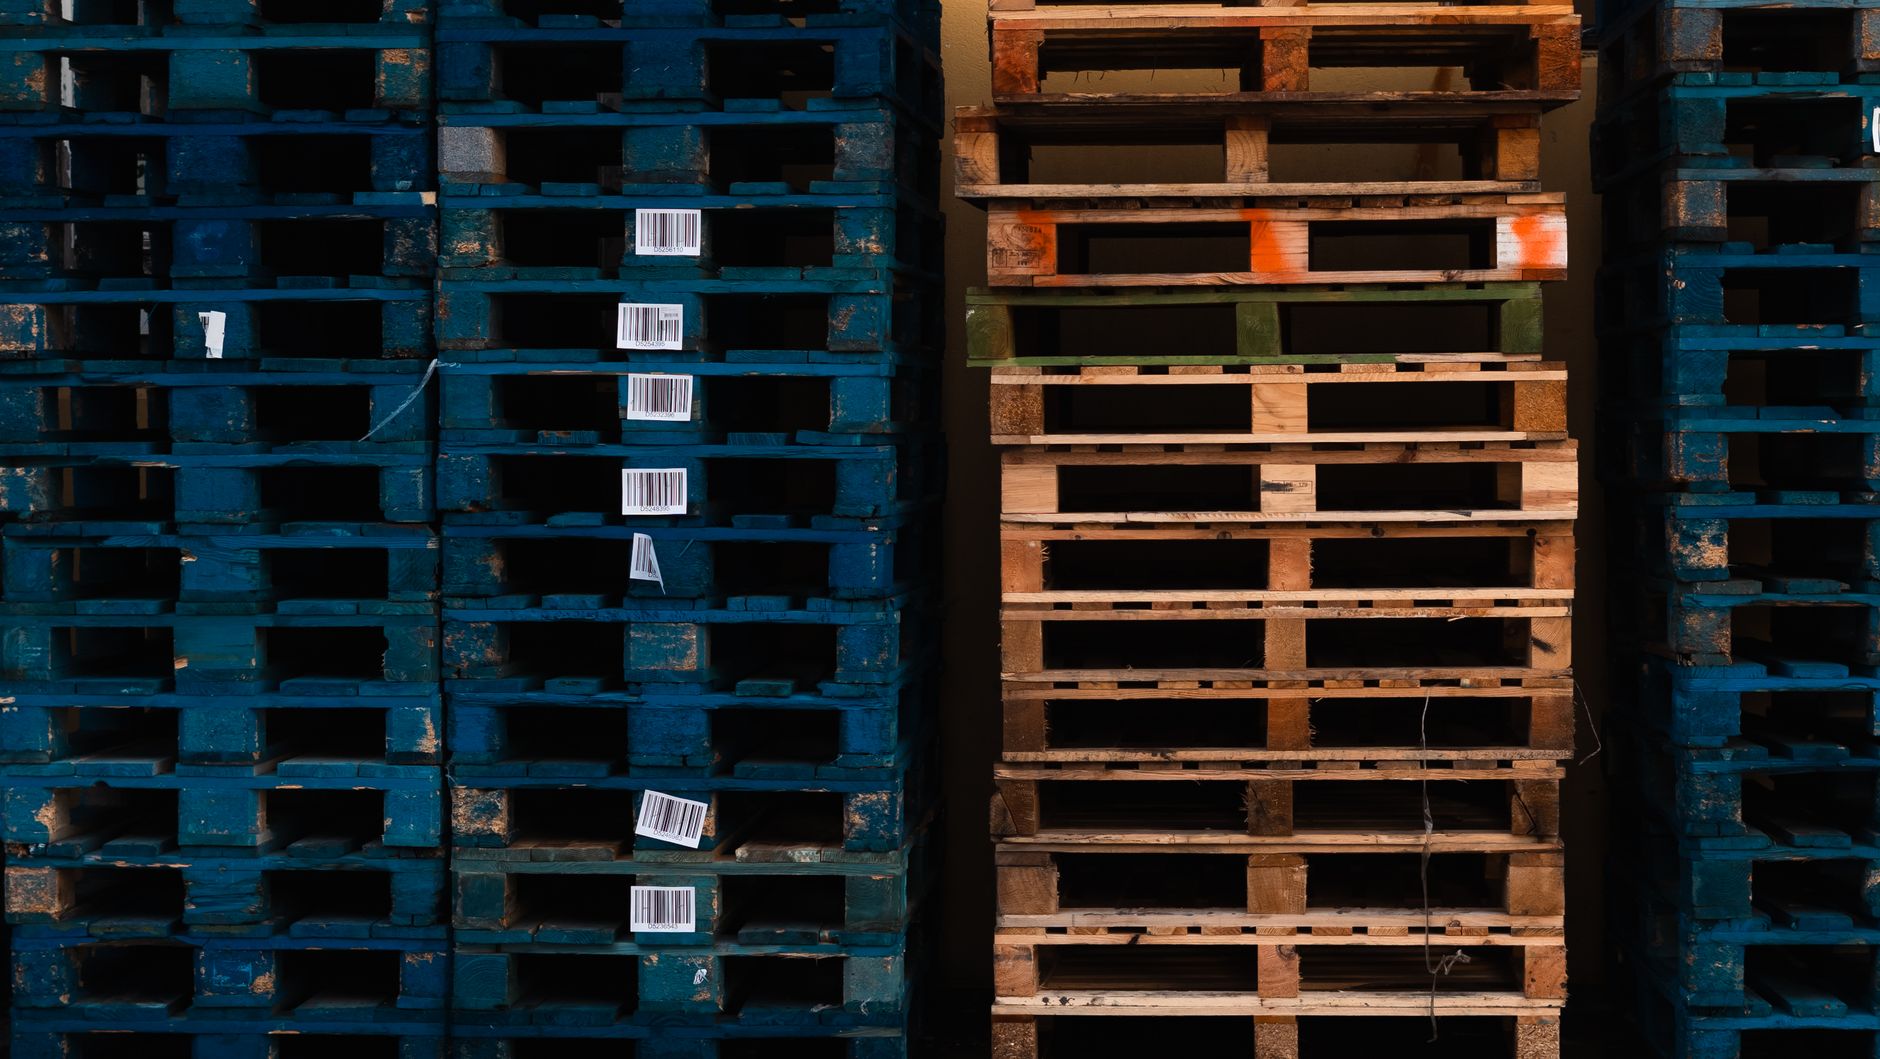
The return comes from labor hours. Each hour a robot runs a route is an hour of laborers and freight, stock, and material movers, hand type of work that a person no longer does. The government wage data on this page prices that work, and the calculator uses it on the labor side of the math.
Labor weighs heavily in this industry. A farm lender's industry report, as summarized by Feed & Grain, puts labor at roughly half of total operating cost for feed mills. Feedstuffs reports a shortage of qualified workers, worse in some regions, and says even highly automated mills still need a control room operator. A robot can keep a route running on a shift that is hard to fill.
The national labor pool is large. The Bureau of Labor Statistics counts about 6,950,000 hand laborers and material movers in 2024, with projected growth of 4 percent from 2024 to 2034, as fast as average. That size means the work is common, so finding and keeping people for it is a general labor market problem, not one unique to feed.
Three cost lines sit on the labor side. The first is the hours of repeat moves that a person currently works through. The second is overtime or call-in cost when a shift runs short, a risk the Feedstuffs reporting on workforce shortages points to. The third is supervision time that crew leads spend on moves they could hand off. The calculator prices the first line directly. The other two vary too much by plant to price here, so the site assessment records them as separate inputs.
How is the savings range worked out?
The savings range is built from a short chain of inputs, and each one can be checked on site. The calculator takes the hours of repeat pallet and bag moves on the routes a robot could run, applies the share of that work a robot realistically takes, values those hours using the government wage data on this page, and then subtracts the fixed lease payment. Savings are shown as a range because each input is an estimate until the route is mapped.
Net return is the labor value of the hours taken over, minus the lease payment and any costs that sit outside the lease quote. Our research did not find a published benchmark for hours per shift on feed mill ingredient or bag moves, so the hour inputs must come from your route data and the site assessment, not from a generic industry average.
Because the net return is a difference between two sizable numbers, small changes in the inputs can move it a lot. A few fewer hours per shift, or a lower share of moves a robot can take, can shrink the range quickly. Ask the assessment to show the range at a low, middle and high set of inputs, and ask which input the range depends on most. That input is the one to measure first.
- Hours of pallet and bag moves on fixed routes, per shift and per week
- Share of those moves a robot can take without a person, after exceptions
- Shifts per week the route runs, including overnight or weekend coverage
- Fixed lease payment from the quote, set after the site assessment
- Labor value of the hours taken over, from the government wage data on this page
What changes the number up or down?
Route structure moves the number more than anything else. Longer repeat routes with fixed stops give the robot more hours to take over, while short or irregular routes leave more work for people. The share of moves that follow the route matters just as much, because every ad hoc request kept by a person lowers the hours the robot can take.
Schedule and floor conditions come next. Overnight and weekend coverage is where a robot adds hours a short crew cannot fill. Clear floors, workable aisle widths and consistent load types support reliable runs, and uneven floors or mixed loads slow them down and cut the hours taken over.
Load type is the last factor. Uniform bags on a standard pallet are easier to run than mixed pallets with varied heights, and the site assessment should record which loads dominate each route before the hour inputs are set.
What are the risks to the return, and how do you avoid them?
The main risk is low utilization. If the route is short, the shifts are few, or the robot waits on other equipment, the hours taken over fall and the return shrinks. Plan the route so the robot runs enough of each shift, and stage loads so it is not idle at the dock. A new layout or product mix can also break a path that worked at the start, so review routes whenever the floor changes.
Safety is part of the picture. The National Safety Council reports 25,110 nonfatal forklift cases in 2023 to 2024, including 15,460 cases with days away from work, drawing on Bureau of Labor Statistics survey data. These figures cover forklifts in general, and the Council notes that older years use a different classification, so comparisons across years need care. Fewer manual forklift runs can lower exposure, but only if the robot route keeps people and robots apart.
Downtime and integration are the last risks. A robot that cannot reach the mill's ERP or warehouse system will be run by hand, and a robot that stops needs a fast fix. Ask for a plan that covers spare coverage, on-site dispatch and remote troubleshooting before you sign.
What does the timeline from assessment to payback look like?
The sequence runs from site assessment to mapping, then a pilot route, then wider deployment. The assessment maps the floor, measures the routes and sets the lease quote. Deployment integrates the robot with the mill's systems, trains the crew and goes live with support. We do not quote a fixed timeline in this text, because the pace depends on the mill's floor, approvals and route count.
A practical pilot runs one route through several shifts, including the overnight or weekend shift where the hours matter most. The crew logs moves, exceptions and any stops, so the hour inputs are checked against real operation rather than the assessment alone. Only after the pilot confirms the hours does it make sense to add routes.
Payback follows the savings range. It arrives when the hours taken over, net of the lease payment and any setup costs shown in the quote, have covered the cost of getting the route running. Ask that the payback estimate show its inputs, so you can see which assumption drives it.
How do you get a precise figure from a free site assessment?
A free site assessment produces the figure the calculator cannot. We map the routes, count the moves by shift, check floor and load conditions and note where people must stay in the loop. That data replaces the estimates in the savings range with your mill's own numbers, and it sets the lease quote through financing.
We are a commercial robot integrator. We pick the robot that fits the site, lease it through financing, deploy and integrate it, train the staff and service it nationwide. The team that assesses the route also deploys it and keeps it running, so the figure you get reflects the setup you will actually live with.
Bring your route data to the assessment: moves per shift, the shift pattern, the bag and pallet mix, the layout and the staff turnover you see. The more accurate those inputs, the tighter the savings range becomes.
Frequently asked questions
Want an autonomous forklift at your feed mill?
Tell us about your site. We will recommend the robot, quote the lease, and keep it serviced.
Sources
- US Bureau of Labor Statistics, Occupational Employment and Wage Statistics (OEWS May 2024)
- American Feed Industry Association, Our Industry Is Rising
- Bureau of Labor Statistics, Occupational Outlook Handbook: Hand Laborers and Material Movers
- National Safety Council Injury Facts: Forklifts
- Feedstuffs, The Future of the Feed Industry Workforce
- Feed & Grain, Today's labor shortage will shape feed mill technology of tomorrow
- Pet Food Industry, Texas feed and grain business robotic packaging case study (company-reported)
- Vendor-hosted corn mill case study on bagging and palletizing (vendor-hosted)