
The short answer
Autonomous forklift ROI for container freight stations comes mainly from repeatable pallet moves between dock doors and staging lanes during peak receiving and consolidation, and from the labor hours on that work that the robot takes over. The result is a savings range, not a promise, and it turns on how much of that work the robot can realistically repeat, how many shifts it covers, and the fixed robot lease payment, which is quoted after a free site assessment. The figure that counts comes from your own dock logs, not from a national average.
See what a autonomous forklift costsRun the numbers in the ROI calculator
Key takeaways
- The return comes from repeatable pallet moves between dock doors and staging lanes, not from the whole building.
- The savings range moves with the share of moves the robot takes and the shifts it covers.
- Lease cost is a fixed robot lease payment quoted after a site assessment, so the math can be checked before any commitment.
- Forklift work carries real injury stakes, so safety records belong in the business case from the start.
- Start on one lane, prove the logged hours, then decide on the full dock.
Run the numbers for your site
Pick your city or state for a real regional number - we use the real BLS wage there. (On the live site this auto-detects from your location.)
What do you want to automate?
The robot takes the repetitive cart and pallet moves off the heaviest motion.
What is autonomous forklift ROI for container freight stations?
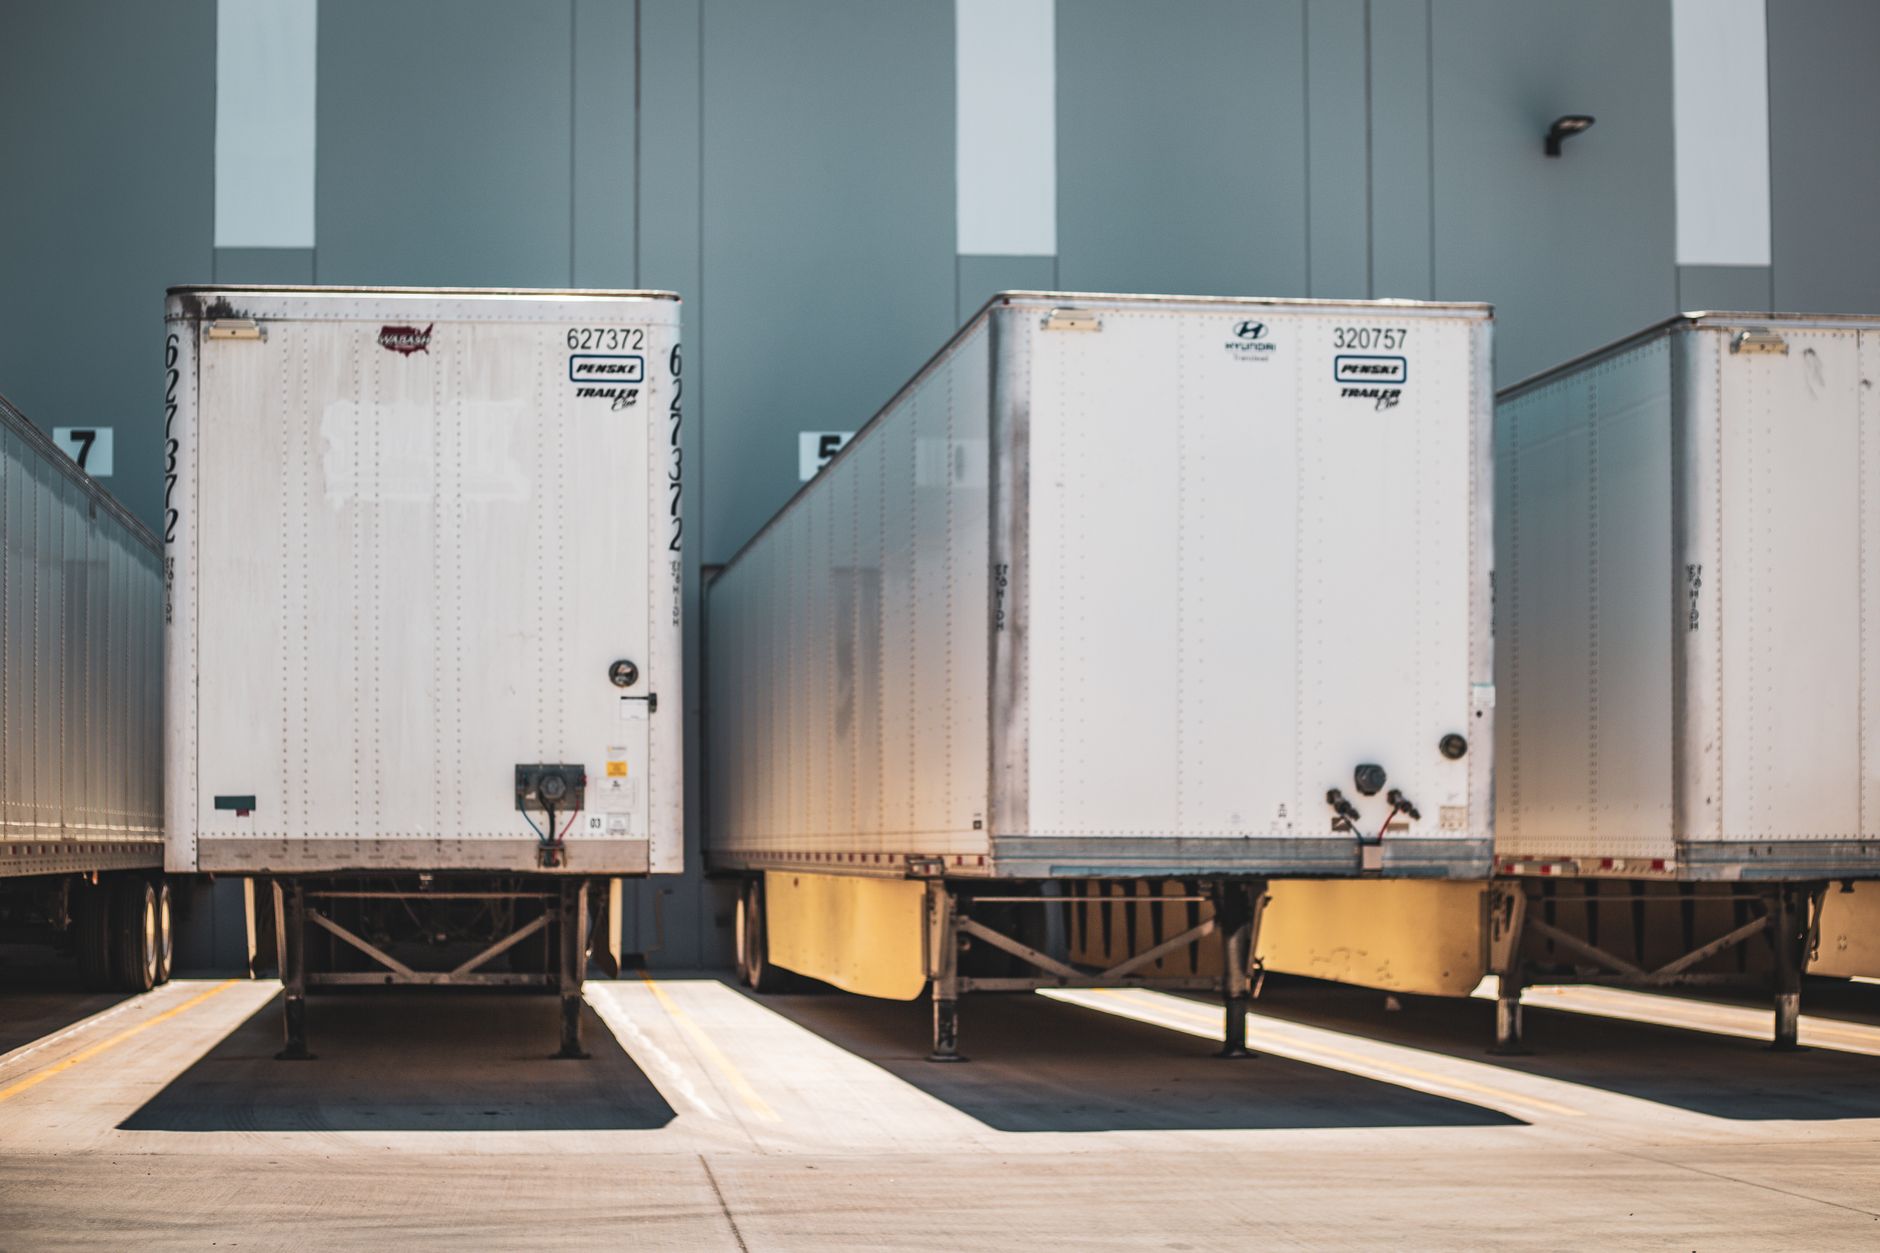
A container freight station, or CFS, is a licensed, customs-bonded site near seaports, airports, or rail hubs where international freight is consolidated or deconsolidated, according to the definition in a Marine Insight explainer on the topic. Inside that building, a steady flow of palletized freight moves from receiving docks to staging lanes, then on to sorting and load out. That flow is the part of the operation where an autonomous forklift earns its place.
Autonomous forklift ROI for container freight stations is the relationship between two numbers. One is the labor value of the hours the robot takes over on that flow, priced on the government wage data on this page for this kind of work. The other is the total cost of the fixed robot lease payment, plus integration, training and service over the lease term. When the first number is larger than the second, with a margin that still holds under a realistic share of the work, the robot pays for itself.
The return is measured per lane and per shift, not per building. An autonomous forklift does not replace a whole station. It repeats the same kinds of moves on fixed routes, and the savings come from those moves.
Where does the return come from in a container freight station?
The return comes from three places: moves that happen many times a shift on the same route, waiting time between moves when driver labor is short, and overflow during peak receiving when volume spikes and the crew cannot keep pace. A route from a dock door to a staging lane is fixed, which is what makes it automatable. Mixed freight, irregular breakdowns and one-off jobs stay with people.
Staffing varies by site and by operator, and no published count for this work at one station was found, so confirm the crew size on your own schedule during the site assessment. Driver labor is usually the constraint a station feels first during peak. The robot does not change the peak itself. It covers the predictable part of the extra pallet moves so the crew can stay on the work only people can do.
In government data, this work sits inside a large group. According to the BLS Occupational Outlook Handbook, about 7.1 million people worked in hand laborers and material movers occupations in 2023, and the detailed occupation of Laborers and Freight, Stock, and Material Movers, Hand accounts for about 3.0 million of them. That is the occupation whose hours the robot takes over, and the government wage data on this page covers it.
Median hourly wage, Laborers and Freight, Stock, and Material Movers, Hand
$4,380
Monthly cost of one full-time worker, at the median wage plus payroll costs (an estimate, not a quote).
How does the lease ROI math work?
The math has three inputs: labor hours offset, the share of the work a robot realistically takes, and lease cost. Start with the hours your dock log records for the lanes in scope. Price the hours the robot takes over using the labor value from the government wage data on this page. Then reduce that figure by the share of moves you can realistically hand to the robot, because no site hands over every move.
Set against that labor value is the fixed robot lease payment plus the costs that come with it, such as integration, training and service over the term. The calculator on this page is pre-filled for this setting, and it shows the result as a range built from those inputs rather than one point figure. The range is the honest answer, because each input can move.
- Hours the robot takes over per week, taken from the dock log for the lanes in scope
- Labor value of those hours, priced on the government wage data on this page
- Share of moves realistically handed to the robot, set in the site assessment
- Fixed robot lease payment and service cost over the lease term, quoted after the assessment
What changes the savings figure up or down?
The biggest driver is how many moves repeat. A lane where the same route runs many times a shift gives the robot more hours to take. A dock with irregular pallet sizes, many one-off jobs or frequent path changes gives it fewer.
Shift coverage matters as much. A robot that runs only during peak receiving carries a different load than one that covers two or three shifts. The length of the peak and how often it returns set how many of those hours are real.
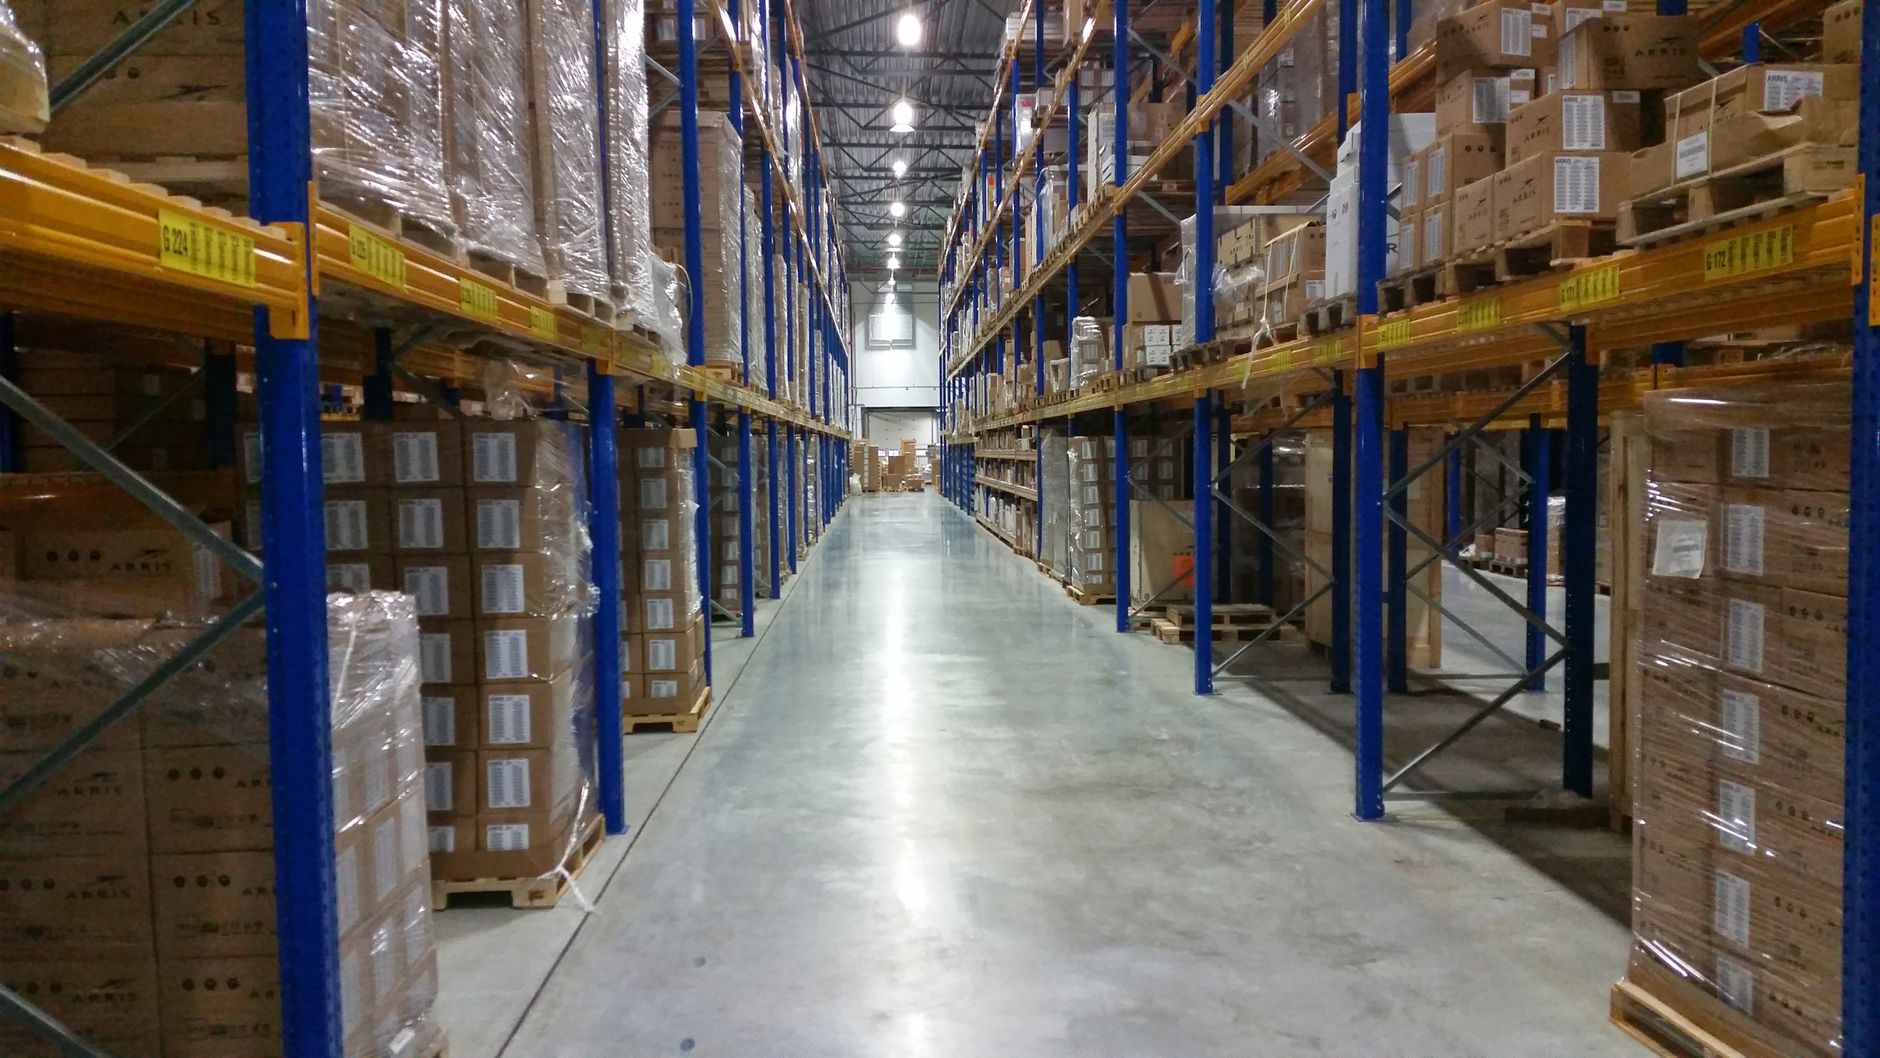
Layout and staging design push the number too. Clear aisles, marked lanes and predictable dock plates help. Congestion at staging, blocked routes and frequent changes to the floor pull it down. The checklist below turns these factors into questions to answer before the number is trusted.
What are the risks to the return and how do you avoid them?
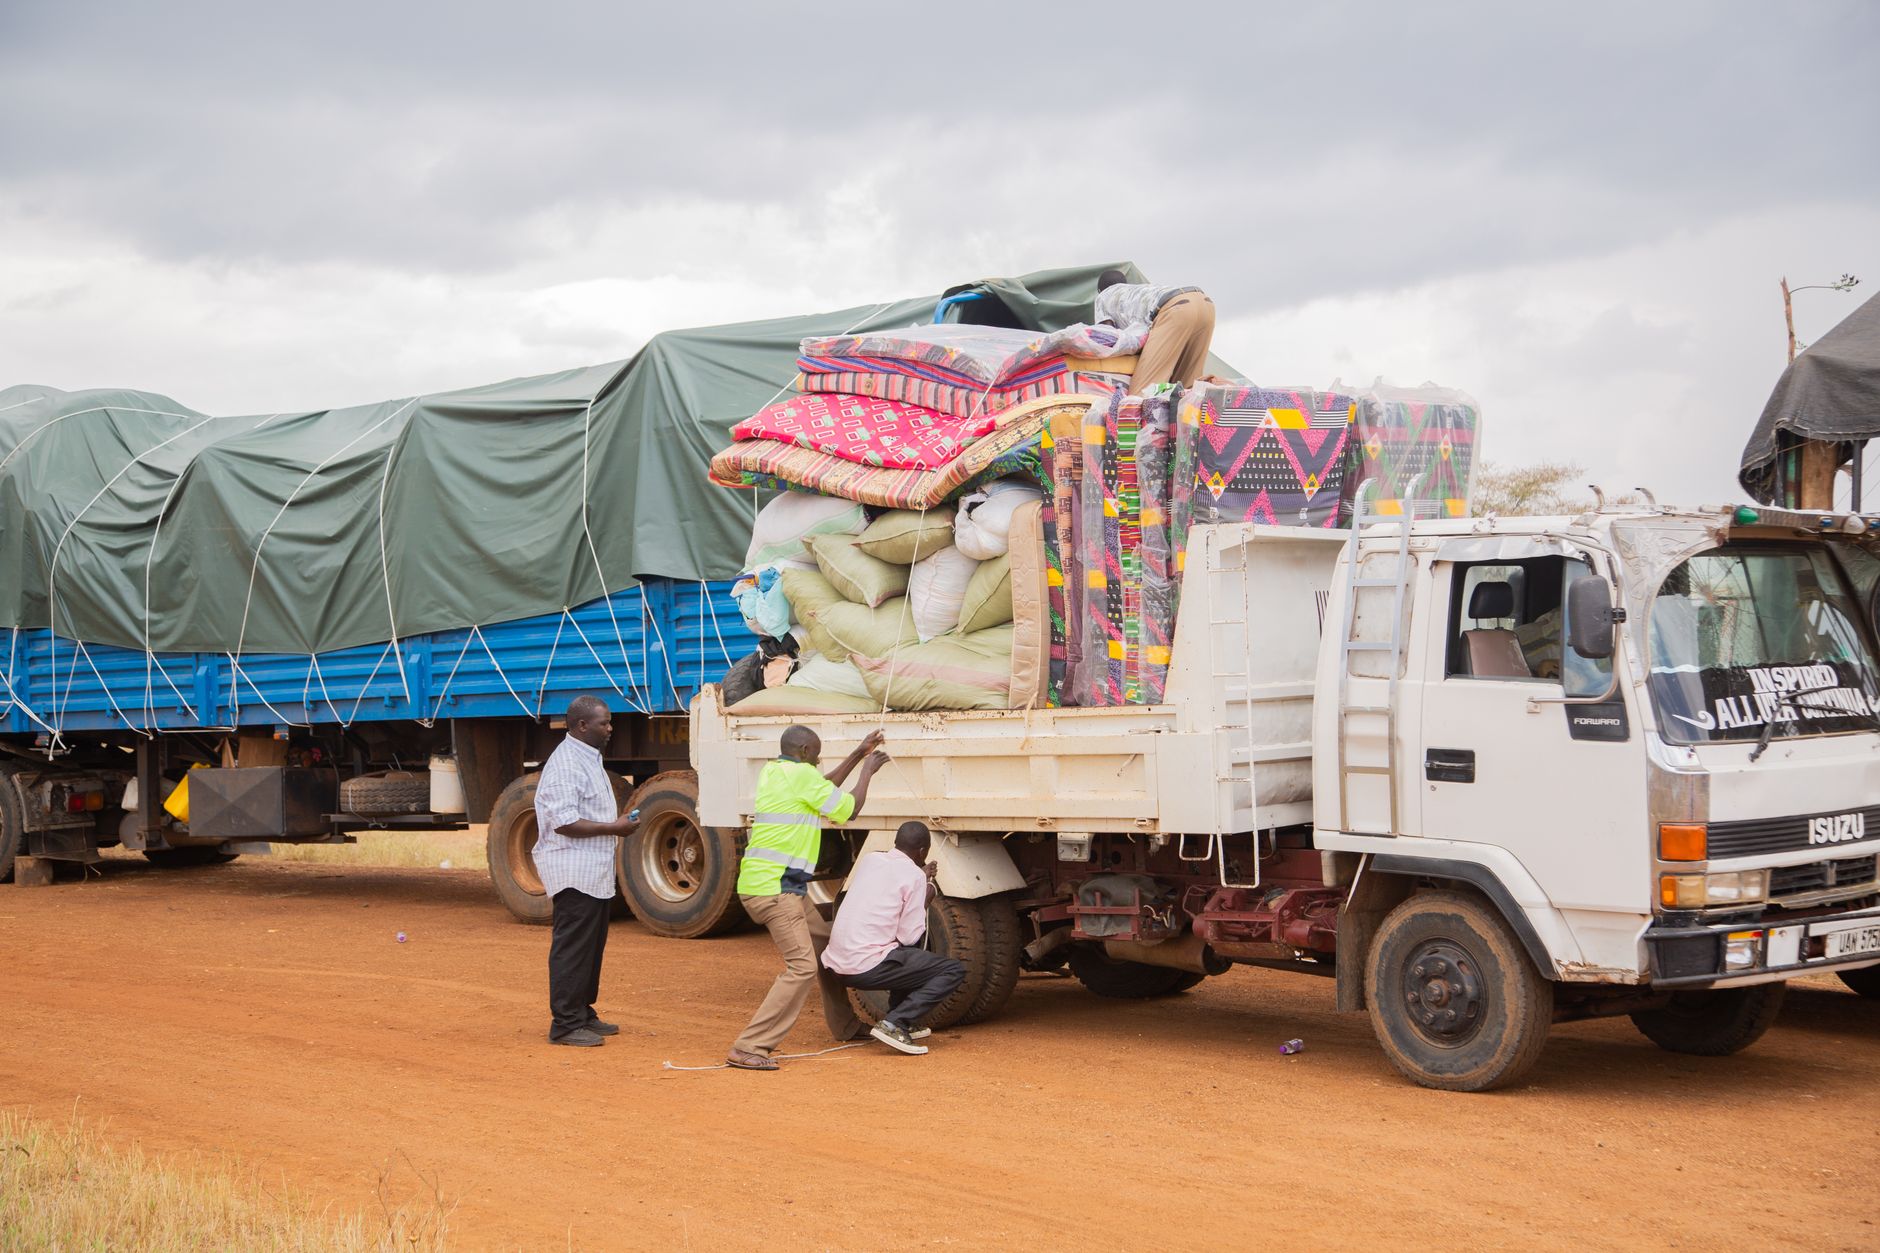
The most common risk is overestimating the share of moves. If the first estimate assumes most pallet moves are repeatable and the real mix is more irregular, the hours offset shrinks. Measure the mix on the actual lanes across a full cycle before committing, and treat the estimate as a range.
Downtime is the second risk. A unit that stops during peak receiving returns the moves it was supposed to take to the crew. Plan for spare unit coverage, a backup robot program and clear on-site dispatch, and ask how remote triage works before you sign anything.
Service Robot Co. is a US commercial robot integrator. We pick the robot for the site, lease it through financing, deploy and integrate it, train the staff and service it nationwide, so the return depends on one accountable partner rather than several vendors. The lease quote comes after the site assessment, not before it.
How dangerous is forklift work, and does automation change the risk?
Forklifts are a serious hazard. According to the National Safety Council analysis of BLS data, forklifts were tied to 84 work-related deaths in 2024, and there were 25,110 DART cases across 2023 and 2024, of which 15,460 were days away from work cases. These are national totals and do not describe any single station, so use them as context for the safety case.
Warehousing carries a higher injury rate than most sectors. According to Voxel AI, a secondary source rather than a BLS primary release, the total recordable injury and illness rate in warehousing and storage was 4.8 per 100 full-time workers in 2024, against 2.6 across all industries. The same source gives 4.4 for transportation and warehousing combined. The two rates cover different scopes, so compare them with care.
A robot removes some exposure from the moves it takes, but that safety gain should not be counted as savings in the ROI unless your own incident records show it. Keep the injury log for the lanes in scope so the baseline is real before the robot arrives.
How common are autonomous forklifts and mobile robots in warehousing?
No 2025 survey gave a forklift-specific autonomous adoption rate that this research could verify, so read the adoption figures here as signals, not as a count of stations. The most relevant one for a freight station is truck loading and unloading. The Intralogistics Robotics Survey 2025, as cited by Fox Robotics, found that 33% of respondents ranked truck loading and unloading as their top automation priority. That is a priority, not a deployment rate.
Actual deployment is still early for this kind of work. According to a July 2025 Indago survey reported by pulse.bot, about 4% of respondents had moved past pilots for trailer loading and unloading robots. A 2025 MHI survey, also reported by pulse.bot, found 48% of surveyed firms reporting active robot deployments, but that figure covers robotics in general.
Across the wider sector, GlobeST reported in March 2026 that autonomous mobile robots and automated guided vehicles are found in roughly 10 to 15% of facilities. BLS counted 1,832.4 thousand employees in warehousing and storage on a seasonally adjusted basis in January 2026, so the workforce around these tools is large, and a station that automates one lane is still a small part of it.
What is a realistic timeline from assessment to payback?
The timeline runs in phases, and the length of each depends on the site, so ask for a dated schedule in the quote rather than accepting a generic one. The first phase is the site assessment, which maps the lanes, pulls the dock logs and sets the move mix. The second is a pilot on one lane, which tests the share of moves the robot takes under real peak conditions.
The next phases are integration with the systems the station already runs, staff training, and go live support through the first full cycles. Payback is measured on the hours the robot actually took, not the hours it was planned to take. Set a review point after the pilot and another after the first full peak, and compare the logged hours to the range from the assessment.
A phased start without a shutdown is the usual approach, because a station cannot stop receiving during peak. The pilot is also the most direct test of whether the share of moves holds once real volume arrives.
How do you get a precise figure from a free site assessment?
A free site assessment turns the range on this page into a figure for your station. Bring the dock logs for the lanes in scope, the shift schedule, the peak calendar, the lane layout and the injury log. The assessment maps the routes, counts the moves that repeat, and sets the share of work the robot can realistically take.
What comes back is a savings range built on your data, plus a fixed robot lease payment quoted after the assessment. The quote covers the robot lease through financing, deployment and integration, staff training and service. Ask for the assumptions in writing, especially the move share and the shift count, so you can test them against your own records.
Service Robot Co. runs this assessment as a US commercial robot integrator. If peak is the main question, start with one lane, and expand once the logged hours hold up across a full season.
Frequently asked questions
Want an autonomous forklift at your container freight station?
Tell us about your site. We will recommend the robot, quote the lease, and keep it serviced.
Sources
- US Bureau of Labor Statistics, Occupational Employment and Wage Statistics (OEWS May 2024)
- National Safety Council, forklift injury facts
- BLS Industry at a Glance, warehousing and storage (NAICS 4931)
- BLS Occupational Outlook Handbook, hand laborers and material movers
- Voxel AI, warehouse safety statistics
- GlobeST, warehouse automation and modern logistics space, March 2026
- Indago survey on trailer loading and unloading robots, reported by pulse.bot
- MHI 2025 robotics survey, reported by pulse.bot
- Marine Insight, understanding container freight stations