
The short answer
Autonomous forklift ROI for precast concrete plants comes mainly from fewer crew hours spent on repeated, fixed-route moves of panels and forms between casting beds and storage, plus yard runs that no longer depend on overtime. The size of the return depends on how much of that work a robot can realistically take, the hours of laborers and freight, stock, and material movers, hand work it takes over, and the lease cost. A free site assessment turns those inputs into a lease quote and a savings range, and the range is an estimate, not a promise.
See what a autonomous forklift costsRun the numbers in the ROI calculator
Key takeaways
- Most of the return comes from repeatable panel and form moves on fixed routes.
- Savings are a range set by the share of work the robot takes, not a promise.
- Overtime-driven yard runs are often the clearest early gain.
- The average precast plant has about 37 employees, so a single leased unit can serve as a pilot.
- The precise figure comes from a free site assessment and a lease quote.
Run the numbers for your site
Pick your city or state for a real regional number - we use the real BLS wage there. (On the live site this auto-detects from your location.)
What do you want to automate?
The robot takes the repetitive cart and pallet moves off the heaviest motion.
What is autonomous forklift ROI for precast concrete plants?
Autonomous forklift ROI for precast concrete plants is the return a plant gets when a leased autonomous forklift takes over part of the heavy, repetitive moving that crews do today. In practice that means panels and forms carried between casting beds and storage, plus yard runs that otherwise pull people in early, late or onto overtime. The return shows up as labor hours offset, not as one line on a balance sheet, so it has to be measured against your own shifts.
The size of the setting helps explain why it matters. The National Precast Concrete Association report, as summarized by Concrete Products and covering 2022 data, counts 2,730 precast plants and about 102,000 workers. Dividing one by the other gives about 37 employees per plant on average. That average covers every job in the plant, not only the people who move panels and forms, so the share doing that work is measured during the site assessment.
The calculator on this page is pre-filled for precast plants and shows a computed savings range. Read that range as a planning estimate. It shows how the return moves as the inputs change, and it is not a promise of what your plant will save.
Where does the return come from in a precast plant?
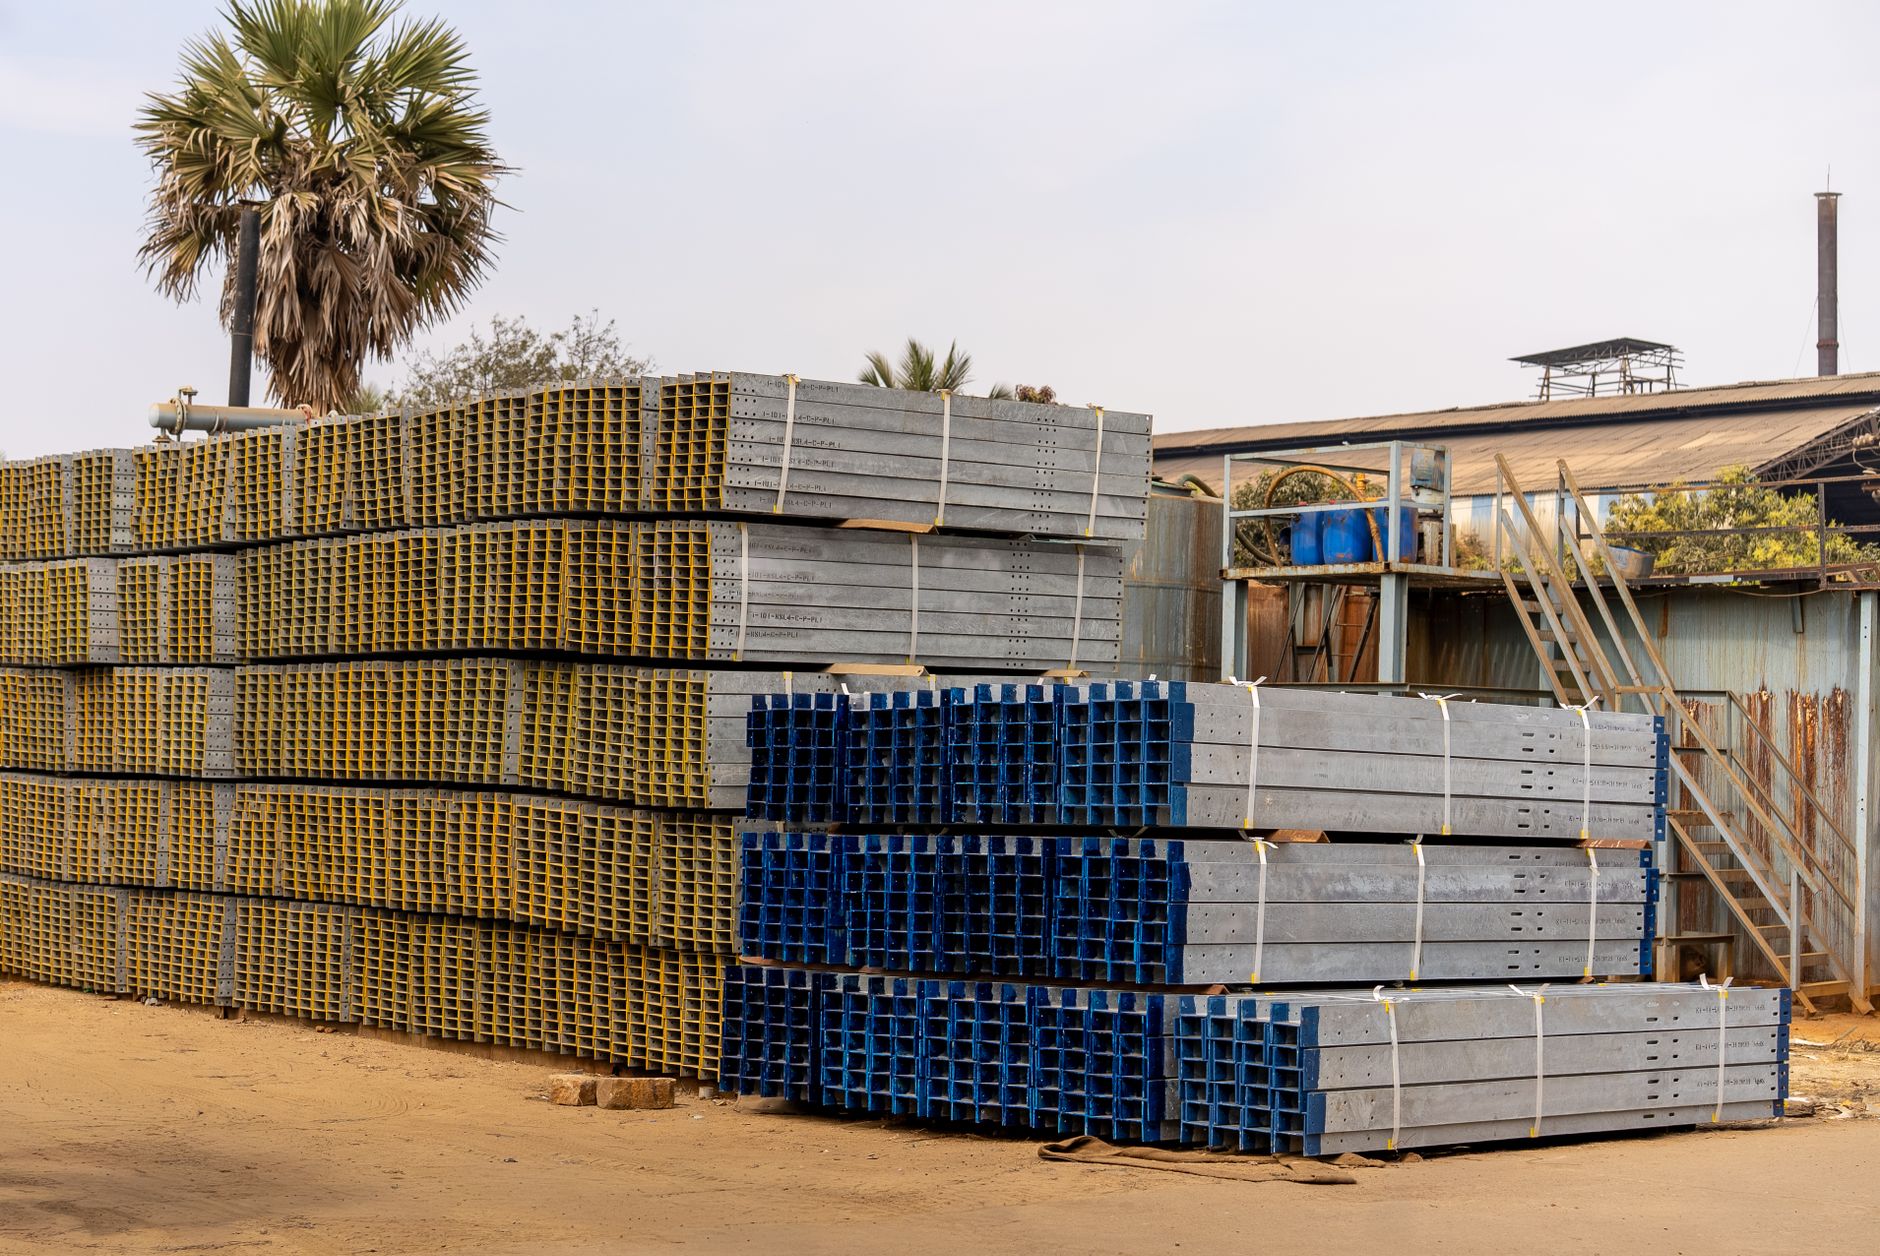
Precast work is heavy and repetitive. Finished panels move from casting beds to storage, empty forms return to the casting area, and reinforcing pieces and finished units shift between zones. Much of this follows the same paths shift after shift, which is the kind of fixed route an autonomous forklift handles well. Because the moves are heavy, crews work them with equipment, and each move ties up a driver and often a spotter.
Yard runs are the second source. Trucks and staging areas need a steady flow of panels, and when volume peaks, plants add overtime to keep loads on schedule. A leased unit can run queued moves between the peaks, which moves some of that work out of paid overtime and into steady operation. The gain is largest where the yard is busiest at the hours when the plant is short of people.
The return is strongest where a move repeats often, starts and ends at fixed points, and is done by a person waiting on a truck or a bed. It is weakest on one-off moves that need judgment, such as a damaged piece or a misplaced form. A good site assessment sorts moves into those two groups before any savings range is set.
Median hourly wage, Laborers and Freight, Stock, and Material Movers, Hand
$4,380
Monthly cost of one full-time worker, at the median wage plus payroll costs (an estimate, not a quote).
How does the savings math work?
The math has three moving parts. The first is the labor side: the hours of laborers and freight, stock, and material movers, hand type of work that the unit takes over, valued at the local wage for that job, which is shown in the government wage data on this page. The second is the share of work the robot realistically takes, since not every move fits a fixed route. The third is the lease cost, which comes in a quote after the site assessment.
Read it in this order. Take the weekly hours of repeat moves, multiply by the share the unit realistically takes, value those hours at the local wage for the job, and subtract any staff time the unit still needs for supervision and exceptions. Then compare that result with the lease cost. Each input is a range, so the result is a range too. Check the labor side against your own payroll records, not a national average.
Two points keep the math honest. Hours the unit takes over only save money if the crew hours come off the payroll, through reassignment, fewer overtime shifts or attrition that is not refilled. And the labor value uses the wage for the moving job, not a supervisor's wage, so the figure stays tied to the work that actually moves.
How many labor hours does a precast crew spend on these moves?

I did not find published hour counts for precast moves in the sources checked for this page, so the hour figures have to come from your own plant. The workforce shape is available, though. The NPCA-based average puts a typical plant near 37 employees across all jobs, so a crew moving panels and forms is one slice of that total. The table below lists the task types to time during the assessment, so the hours you track match the work the unit would take.
Turnover is harder to pin down. I found no published turnover rate for precast plants. The closest benchmark is ready-mix concrete, where NRMCA surveys reported a 35% mixer driver turnover rate for 2020, according to Concrete Products. That is another job with another workforce, so use it only as a sign that concrete plants can struggle to hold drivers, not as a precast figure.
Turnover matters to the return because each departure resets training and can leave a gap that is covered with overtime. A unit that runs a fixed route does not depend on who is on shift, which is one reason yard runs are a common starting point.
What changes the number up or down?
Route repeatability is the biggest driver. Moves that run the same paths many times a shift raise the share a unit can take. Moves that change from day to day, or that need a spotter or a visual check on every load, lower it. Overtime also matters. Where yard runs are paid at overtime rates today, the labor side of the math grows, and where they are covered by regular shifts, it shrinks.
Site layout moves the number too. Clear, mapped aisles with defined crossings let a unit run more often and at a steady pace. Tight corners, shared lanes with trucks and carts, and frequent blind crossings slow it down and add staff time for escorting or clearing a route. Floor condition and grades count as well, so the assessment includes a floor check.
Staffing and wages set the value of each hour. A higher local wage for the job raises the labor value of every hour the unit takes over. Higher turnover does the same, since each vacancy costs training time. The checklist below lists what to bring to the assessment, so the range you receive reflects your plant rather than an average.
What are the risks to the return and how do you avoid them?
The largest risk to the return is a route that changes faster than the system can follow, which leaves the crew doing the work anyway. The second is underused capacity, where a unit is leased for a job that fills only part of a shift. The third is safety. Forklifts are serious across industries. The Bureau of Labor Statistics reports that 614 workers died in forklift-related incidents from 2011 to 2017, and more than 7,000 nonfatal injuries with days away from work occurred every year.
Those BLS forklift figures cover all industries, not precast alone. For the sector, SafetyRecord, which republishes BLS injury data, reports 4.9 total recordable cases per 100 full-time workers in 2024 for other concrete product manufacturing (NAICS 32739), with a relative standard error of 9.5%. Check that figure against the BLS release before it goes into a decision. Your safety team will ask about it, and a plant with a lower rate still needs the same route mapping and exclusion rules.
You avoid these risks by starting with a mapped route and a short pilot, setting clear exclusion zones, and training the people who work around the unit. Plan the route with the crew who move panels today, not only with plant engineers. Keep the first lease on a route with a clear payoff, and widen it only after the first route runs as planned.
How common are autonomous forklifts in plants and warehouses?
Adoption is still early in most industrial settings. GlobeST, in a March 2026 article, says roughly 10 to 15% of warehouse facilities use AMRs or AGVs, and full automation is at about 3 to 5% of warehouses. The article does not state the survey year, so treat those figures as directional.
Conventional equipment still dominates. The 2025 automation survey from Modern Materials Handling found that 83% of respondents use conventional lift trucks, up from 74%, among 139 respondents. Those are manually driven trucks, not autonomous units, so the figure shows how much of the work is still done by people on equipment, which is the room a leased unit can fill.
I did not find an autonomous forklift adoption share for precast plants. The figures above describe warehouses and general plant work, so they show the trend, not the rate in precast. Ask during the assessment which route types other plants have already automated and what those routes looked like before the change.
How long does it take from assessment to payback?
The timeline runs in phases, and the order matters more than any single date. The assessment and mapping come first, because the route and the share of work set the range. A pilot with one unit then runs the highest-repeat route before any second unit is added. Integration with plant scheduling and tracking follows, then staff training and go-live support. Payback is measured after the unit has run long enough to show the real share of moves it takes.
No payback date is fixed in advance. It depends on how quickly the route is proven and how many hours are truly freed from the crew or from overtime. A plant with a clear, repeatable route usually sees a clearer picture sooner than one with many one-off moves, which is why the assessment sorts the moves first.
- Site assessment and route mapping, using the plant's own move data
- Lease quote and financing terms, set against the savings range
- Pilot with one leased unit on the highest-repeat route
- Integration with plant scheduling, staff training and go-live support
- Review of actual hours against the range, then a decision on added units
How do I get a precise figure from a free site assessment?
The precise figure comes from a free site assessment, not from a published table. We pick the right robot for the site, lease it through financing, deploy and integrate it, train the staff and service it nationwide. In the assessment we map the routes, time the moves, check floor conditions and crossings, and confirm the overtime and staffing picture. Those inputs are what the calculator needs to narrow the range.
Bring a short list of data: the moves you would like automated, how often each one repeats, which shifts carry yard runs, the crew size on those moves, and any overtime records for those jobs. Add panel and form weights and layout drawings if you have them. With that data the calculator on this page can be refined into a range for your plant.
After the assessment you receive a lease quote with the financing terms and the service plan. The savings range stays a range until operating months confirm the hours, so keep the calculator and the quote side by side and review both at the pilot stage.
Frequently asked questions
Upcoming manufacturing events
- Trade showBrats & RobotsNov 10, 2026Alliant Energy Center Exhibition Hall, Madison, WI
- Trade showMATE Farm & Ranch ShowFeb 11 to 13, 2027MetraPark, Billings, MT
- ExpoPFMA Expo 2027Feb 17 to 18, 2027Washington County Fair Park, West Bend, WI
- ExpoLouisville Facilities Maintenance ExpoApr 15, 2027Mellwood Art Center, Louisville, KY
Want an autonomous forklift at your precast concrete plant?
Tell us about your site. We will recommend the robot, quote the lease, and keep it serviced.
Sources
- US Bureau of Labor Statistics, Occupational Employment and Wage Statistics (OEWS May 2024)
- Concrete Products, summarizing NPCA precast economic report
- IBISWorld, precast concrete manufacturing
- NPCA, Precast Today workforce data article
- SafetyRecord, republishing BLS injury data
- BLS forklift injury factsheet
- GlobeST, warehouse automation article
- Modern Materials Handling, 2025 automation survey
- Concrete Products, NRMCA workforce survey