
The short answer
The return from autonomous mobile robot ROI for aircraft maintenance hangars comes from carrying tooling, consumables and parts kits between stores and work bays on set routes, so technicians stay with the aircraft. The savings range is the hours of laborers and freight, stock, and material movers, hand type of work the robot takes off the shift, minus the lease cost and the staff time still needed for exceptions. A free site assessment measures the trips, the share a robot can realistically take, and the payback period for your hangar.
Key takeaways
- Tool and parts trips are the main time a robot removes from a technician's shift.
- The savings range is built from measured trip hours, not a headline figure.
- Technician shortages raise the value of keeping skilled staff on the aircraft.
- Route layout and safety rules decide how much of the work a robot can take.
- A free site assessment turns the range into a lease quote for your hangar.
Run the numbers for your site
Pick your city or state for a real regional number - we use the real BLS wage there. (On the live site this auto-detects from your location.)
What do you want to automate?
The robot takes the repetitive cart and pallet moves off the heaviest motion.
How much technician time goes to tool and parts runs?
Autonomous mobile robot ROI for aircraft maintenance hangars starts with one measurement: how often a technician leaves the aircraft to fetch a tool, a consumable or a parts kit, and how long each trip takes. Published U.S. Air Force examples show the scale of the loss. A C-17 maintenance unit reported that reorganizing a toolbox saved, on average, more than 30 minutes of travel to and from the tool room, according to the Air Force Materiel Command article on that effort. A separate Air Force article on an aerospace ground equipment flight reported that parts lookup fell from five to seven minutes of searching to about one minute.
These are base-level examples, not industry averages, and they describe organization changes rather than robots. They still point at the same pattern. Most of the lost time is the walk, and the search is a smaller share. A robot changes the walk by carrying the item, which is why distance and trip frequency are the first things to measure. Your hangar has its own distances, crib hours and store layout, and the site assessment records those rather than borrowing a figure from another base.
Where does the return come from in a hangar?
The return has three sources. The first is labor hours. A robot that carries tooling, consumables and parts kits takes over runs that fall under laborers and freight, stock, and material movers, hand type of work. The savings range values those hours at the government wage data shown beside this page, so the wage side of the math is set by that published figure rather than by any estimate we make.
The second source is technician time on the aircraft. When a technician stays with the aircraft, the same shift completes more of the scheduled work, and the aircraft waits less on the ground for a tool or part. That held ground time has a cost of its own, and it sits outside the labor side, so bring your own ground time figures to the assessment.
The third source is the hiring squeeze, which is hardest to put in a spreadsheet. The ATEC pipeline report from November 2025, as reported, projects a shortage of 4,200 technicians by 2035 after the deficit widens first. A shop that cannot fill technician seats has less room to spend skilled hours on fetching. Every trip a technician does not make returns time to the work only that person can do, and that work gets harder to staff each year.
Median hourly wage, Laborers and Freight, Stock, and Material Movers, Hand
$4,380
Monthly cost of one full-time worker, at the median wage plus payroll costs (an estimate, not a quote).
How many people work in these hangars?
According to the Bureau of Labor Statistics Occupational Outlook Handbook, about 160,800 people held jobs as aircraft and avionics equipment mechanics and technicians in 2024. About 139,400 of them were aircraft mechanics and service technicians, and about 21,400 were avionics technicians. The same source projects employment in these jobs to grow 5 percent from 2024 to 2034, faster than average, with about 13,100 openings a year on average over the decade.
The federal data does not give a count of technicians per hangar, and we did not find a verified figure for how many people run tools and parts at one site. That gap matters for your number. A line maintenance station and a large base hangar staff very differently, and a night shift may have only a few people covering several aircraft. Use your own roster and shift schedule, not an industry average.
Facility counts add context. The FAA information collection document counted 4,020 certificated repair stations in the United States as of December 31, 2019. That is the most specific total we found, and it is dated. ARSA, a trade association, estimates that 1,507 U.S. repair stations hold EASA approval across 47 of 50 states, and that about one in three U.S. repair stations holds European certification. Sites vary this much, so a single standard hangar profile would mislead.
How does the savings math work?
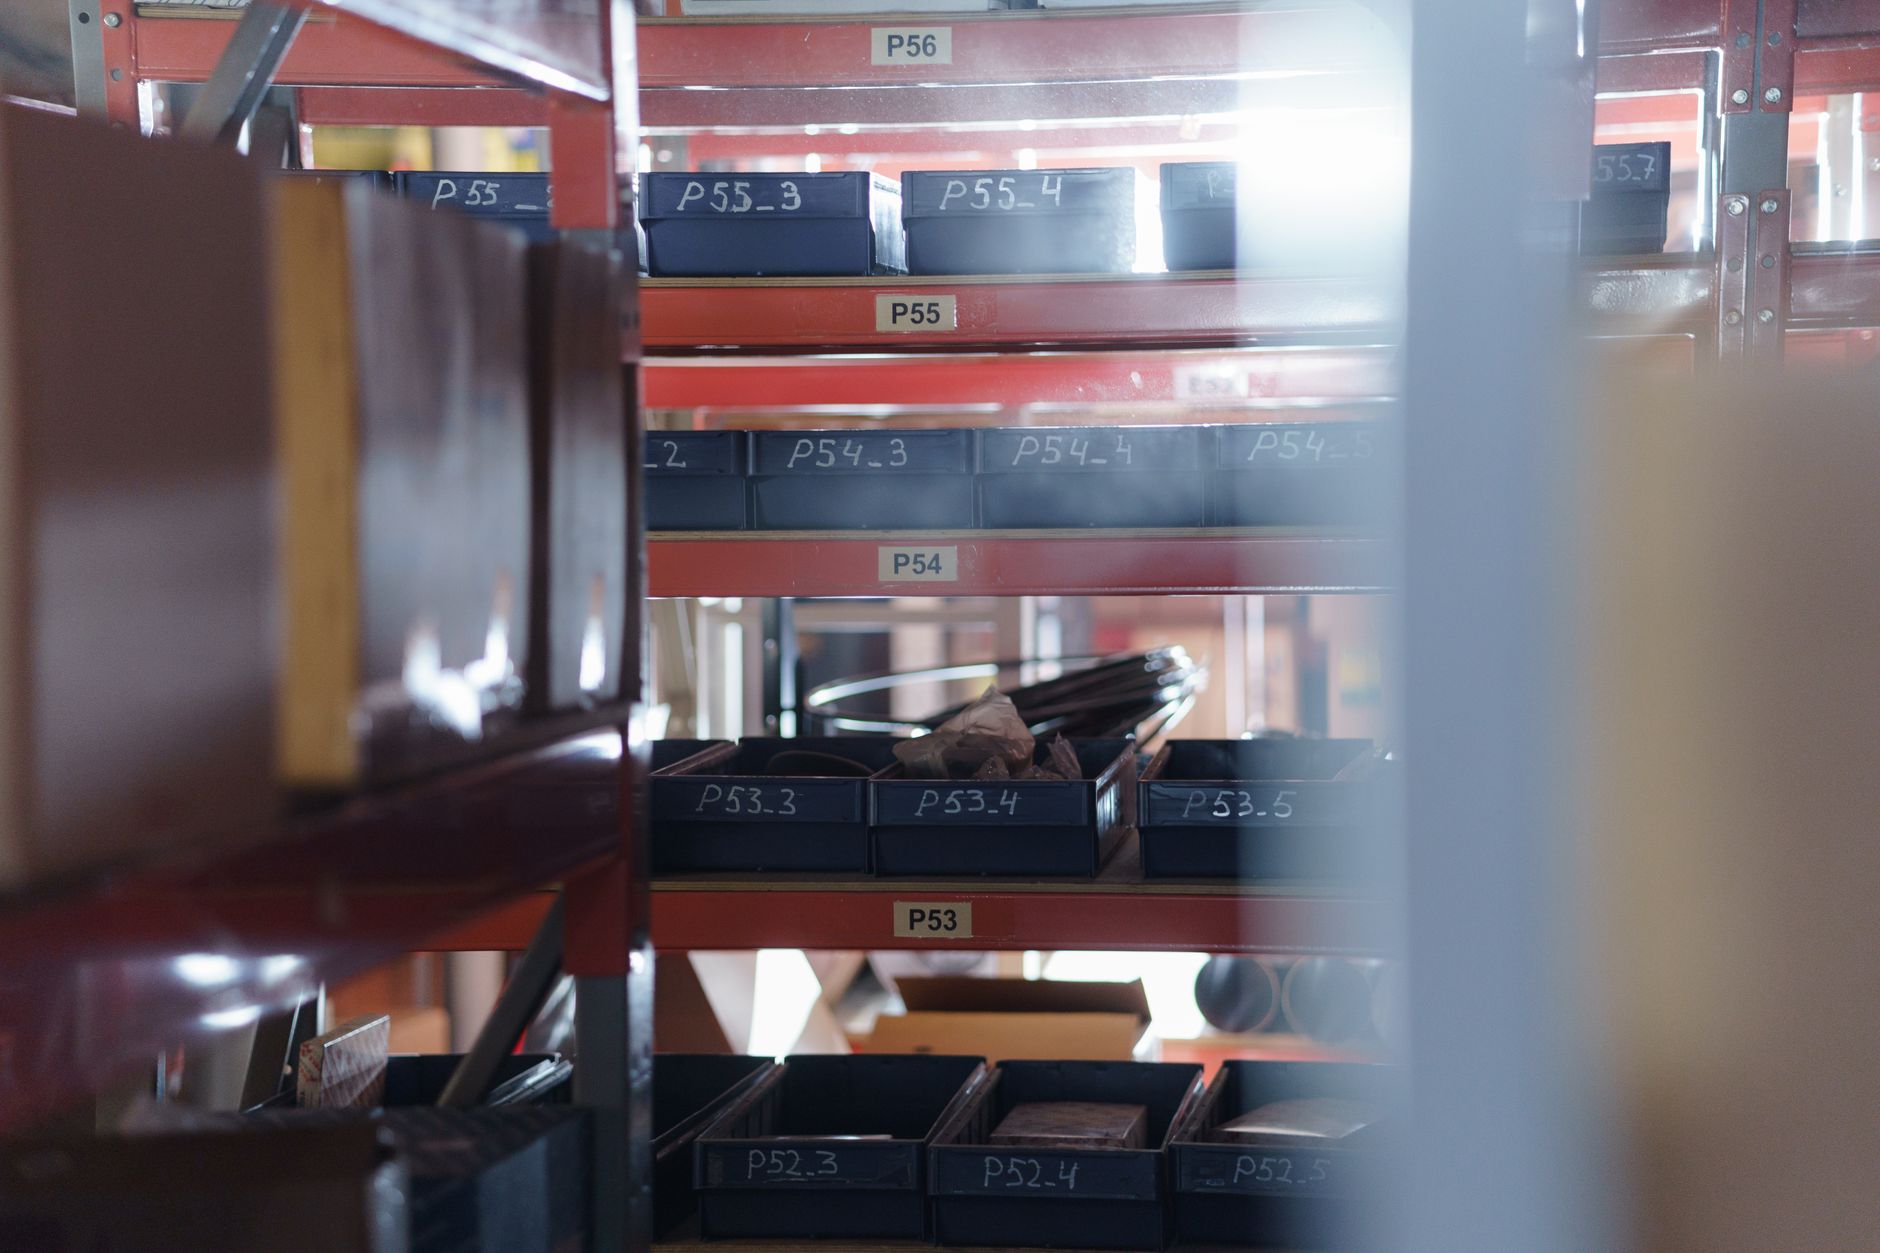
The calculator takes four inputs. The first is the hours per shift that technicians now spend on tool, consumable and parts trips, measured on your floor. The second is the share of those trips a robot can realistically take on set routes. That share is seldom all of them, because urgent or unusual items still need a person. The third is the number of hours of laborers and freight, stock, and material movers, hand type of work the robot removes, valued on the government wage data beside this page. The fourth is the lease cost, quoted after the site assessment through financing.
In plain terms, the labor side is the hours taken over, multiplied by the value of that work. The savings range subtracts the lease cost and the staff time still needed to load, supervise and handle exceptions. Because the trip hours come from measurement and the share is a judgment call, the result is a range, not a promise. Two hangars with the same headcount can produce very different ranges if their distances and request rates differ.
Ground time belongs in the picture too, but as a separate line, as noted above. The hours table below shows the kinds of work the robot takes over and how each is measured.
What changes the number up or down?
Distance and frequency matter most. A tool crib at the far end of a large hangar produces more walking per request than one beside the bays, and a robot on a fixed loop can serve many requests on each pass. Mixed kits reduce how many items fit on one route. The number of work bays and technicians per bay sets how often requests arrive, and the timing of those requests shapes how a route should be scheduled.
Layout and access shape the route. Narrow passages, cable runs, ground support equipment parked in aisles and door thresholds all limit where a robot can go. A route clear at night may be blocked during the day, so the assessment records both. Shift patterns matter as well. A robot that runs when most requests come in earns more of its value than one that runs only when the building is quiet.
What are the risks to the return, and how do you avoid them?
The first risk is overestimating the share. If the robot covers only routine items, the return follows that routine share and the rest of the labor stays. Stage the deployment, measure actual runs over a representative period, and size the route set from that data. The second risk is weak route design. A route that crosses an active work zone or a ground support equipment path creates a safety issue and a stoppage. Map the floor with technicians and the people who run ground equipment before any route goes live.
Safety is the third risk. According to the Bureau of Labor Statistics Industry at a Glance page for air transportation (NAICS 481), that sector recorded 6.5 total recordable cases per 100 full-time workers in 2024. Of those, 5.6 involved days away, job restriction or transfer, and 4.0 involved days away only. Across all private industry, the BLS national release reports 2.3 total recordable cases per 100 full-time workers for the same year. Air transportation is not the same as an aircraft maintenance hangar, so these figures set context rather than a benchmark. They do suggest that a busy aircraft setting carries more recordable injury risk than the average workplace, and a robot adds moving equipment to it. Lanes, stop rules and staff training belong in the plan from the start.
Uptime is the fourth risk. A robot out for service leaves its routes to staff, and the return falls for those hours. Plan a fallback for those periods, and confirm the service response for your location before committing to a route set.
How long does it take to reach payback?
The timeline runs in stages, and the length of each depends on the number of routes and bays. The first stage is the free site assessment, where we map the floor, record trips and requests, and identify safe routes. The second is the quote and financing, followed by integration, which sets up the routes, the request process and the charging plan. The third is staff training and a go-live period, when technicians learn to request runs and handle exceptions.
The payback calculation starts once measured results exist, not on day one. A phased start with one unit on the busiest route, then measurement, then a decision on more units, puts real hours into the model before the commitment grows. One unit on the most frequent route also gives a clear baseline for the rest of the hangar.
What does a free site assessment give you?
A site assessment maps the tool crib, parts store, work bays and staging points, then records trips and requests over a representative period. It identifies routes that are safe for a robot and shows where the layout blocks them. From that work we recommend the robot configuration for your floor and build the savings range from your own trip data, not a generic figure.
We are a US commercial robot integrator. We lease robots through financing, deploy and integrate them, train your staff and service the units nationwide. The fixed robot lease payment is quoted after the site assessment, and the quote lists what is included. Bring the shift roster, any tool and parts request logs you keep, and the aircraft schedule, so we can see when requests peak.
Frequently asked questions
Want a warehouse robot at your aircraft maintenance hangar?
Tell us about your site. We will recommend the robot, quote the lease, and keep it serviced.
Sources
- US Bureau of Labor Statistics, Occupational Employment and Wage Statistics (OEWS May 2024)
- BLS Occupational Outlook Handbook, aircraft and avionics equipment mechanics and technicians
- BLS Industry at a Glance, air transportation (NAICS 481)
- BLS national release, workplace injuries and illnesses (January 2026)
- FAA information collection document on certificated repair stations
- ARSA, EASA certificates held by US repair stations
- Air Force Materiel Command, C-17 maintainers initiative saves time
- Air Force Southern, AGE flight finds creative way to save time
- ATEC pipeline report (November 2025)