
The short answer
Autonomous mobile robot ROI for battery manufacturing plants comes mainly from moving electrode rolls, cell components and trays between process steps without manual handoffs, so a plant can staff new cell lines with fewer people on transport. The savings range depends on how many hours of laborers and freight, stock, and material movers, hand work the robot takes over, the share of routes it runs, and the fixed lease payment. A free site assessment replaces that range with a lease quote built from your own routes and handoff logs.
Key takeaways
- The return comes from transport hours that no longer need a person at each handoff.
- The savings range is set by the share of moves a robot can run on fixed routes.
- Battery plant routes need staging, contamination control and dock planning before the numbers hold.
- The lease payment is quoted after a free site assessment, and payback is measured on your own logs.
- Start with one route or one cell line, then add units once the hours are proven.
Run the numbers for your site
Pick your city or state for a real regional number - we use the real BLS wage there. (On the live site this auto-detects from your location.)
What do you want to automate?
The robot takes the repetitive cart and pallet moves off the heaviest motion.
What return can battery manufacturing plants expect from autonomous mobile robots?
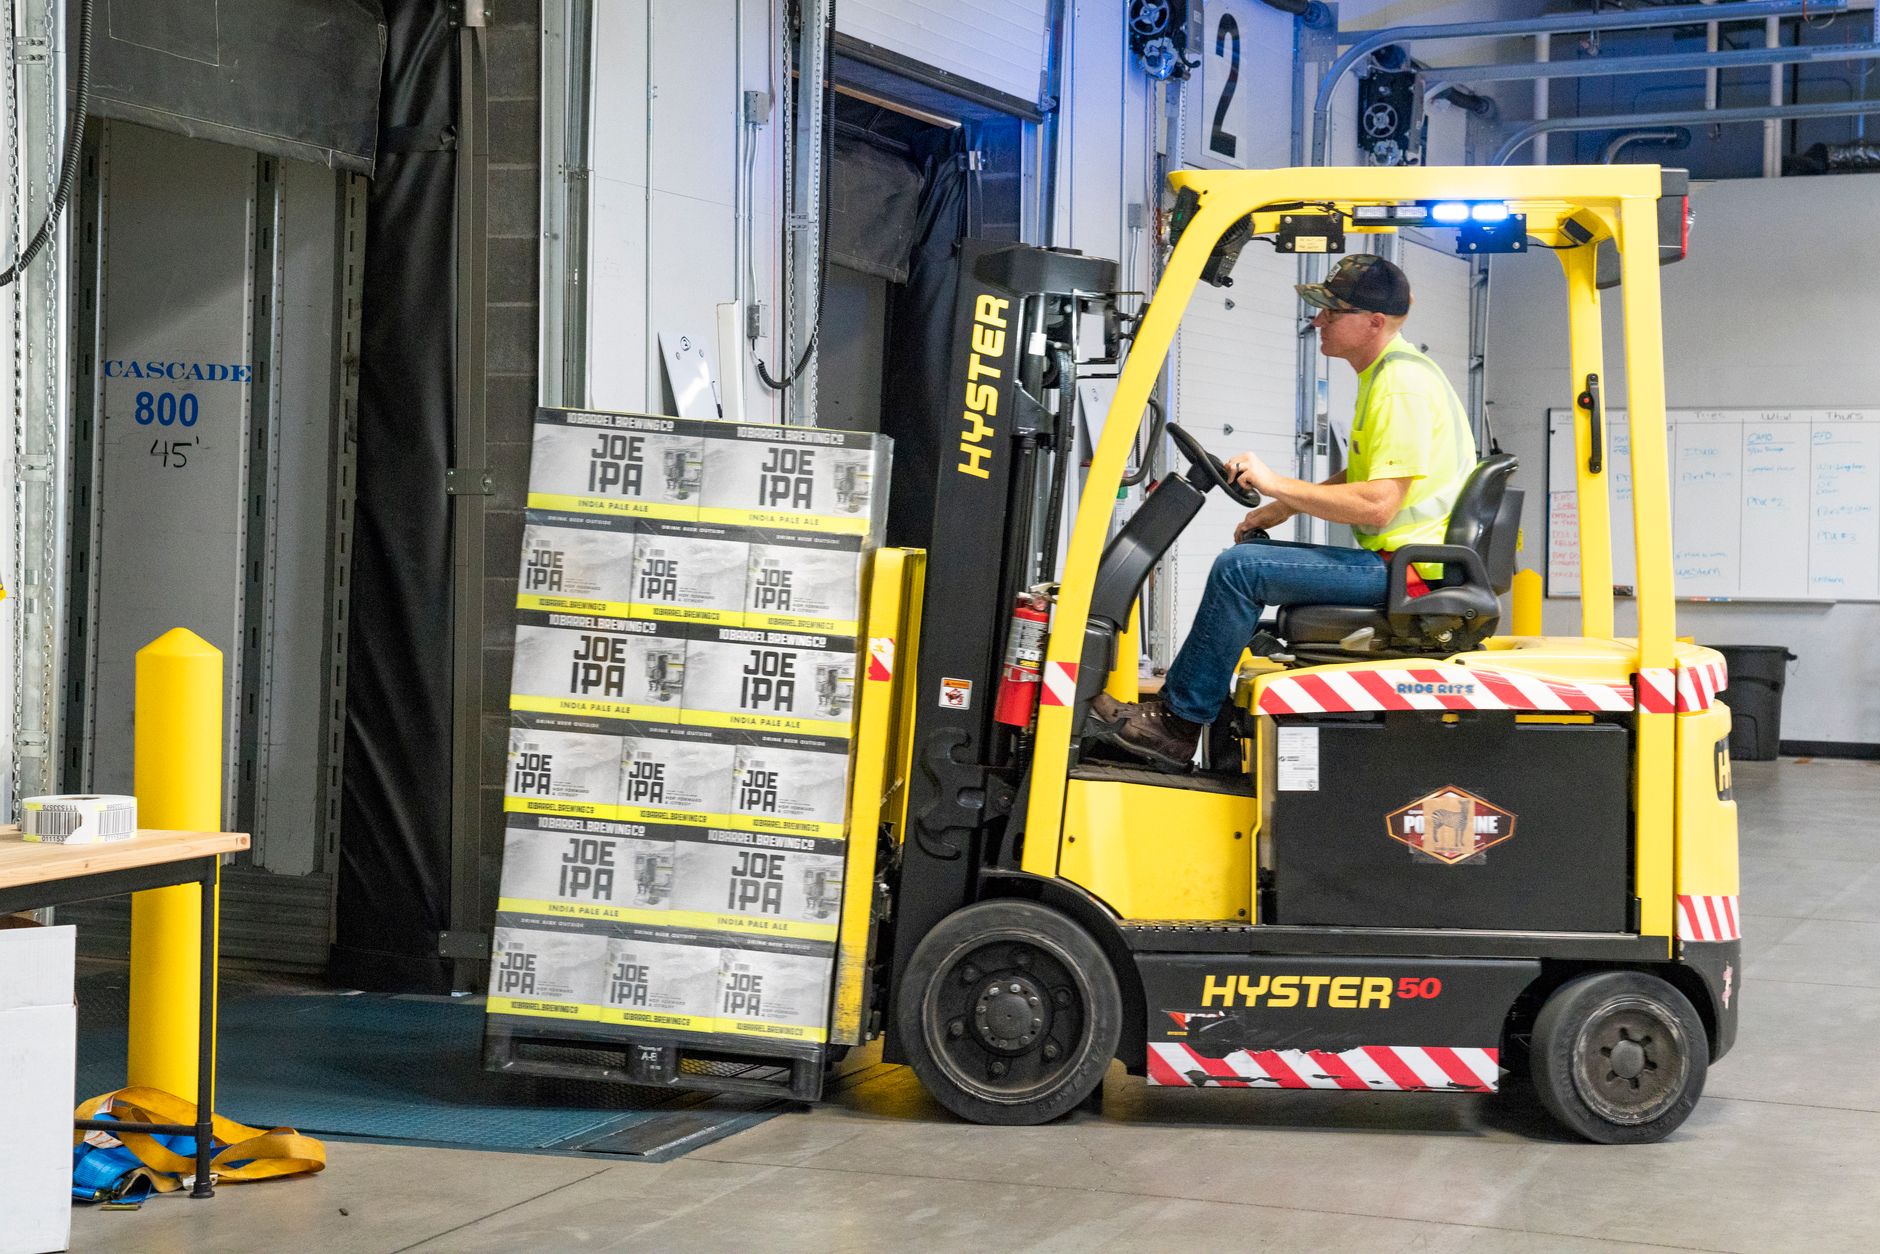
Autonomous mobile robot ROI for battery manufacturing plants is mostly a question about transport labor. A cell plant moves electrode rolls, cell components and trays between process steps all shift, and every handoff done by hand costs a person's time and adds a point where material waits, gets mislabeled or gets damaged. A robot running a fixed route removes those handoffs, so the return shows up first on the transport lines, not across the whole plant.
New cell lines are being built fast, and that changes the math. A line that needs a dedicated transport crew on every shift has to fill those roles before it can ramp. A fleet designed into the layout from the start lets a plant add shifts without adding a transport crew for each one. That is the return to test against your staffing plan for each new line.
How big is the transport workforce in a battery plant?
The research did not verify a count of operating battery plants or a per-plant headcount, so any site-level number should come from your own floor. The scale of the industry is clear, though. According to a secondary summary of an American Clean Power report, US battery module output rose from under 10 GWh in 2022 to roughly 75 GWh in 2025, with planned plants reaching 180 GWh of capacity by 2028. Each new gigawatt-hour of output adds a block of transport work.
Workforce estimates vary by method. An ICCT working paper by Bui and Slowik says the US battery industry could create 84,000 to 125,000 domestic jobs by 2032, with pack production at about 95 workers per GWh and cell components and recycling combined at about 49 workers per GWh. The Volta Foundation, a trade-oriented source, puts a mature cell manufacturing facility at about 130 direct workers per GWh of annual output. These estimates use different scopes, so they are not interchangeable with each other or with your own line.
IBISWorld reports 48,363 people employed in US battery manufacturing as of 2025, and an average battery manufacturing business with 157.0 employees. That average describes a business rather than one plant, and it covers all staff, not material handlers. Read it as a ceiling for total site staffing, not as a transport count.
Median hourly wage, Laborers and Freight, Stock, and Material Movers, Hand
$4,380
Monthly cost of one full-time worker, at the median wage plus payroll costs (an estimate, not a quote).
What work does the robot actually take over?
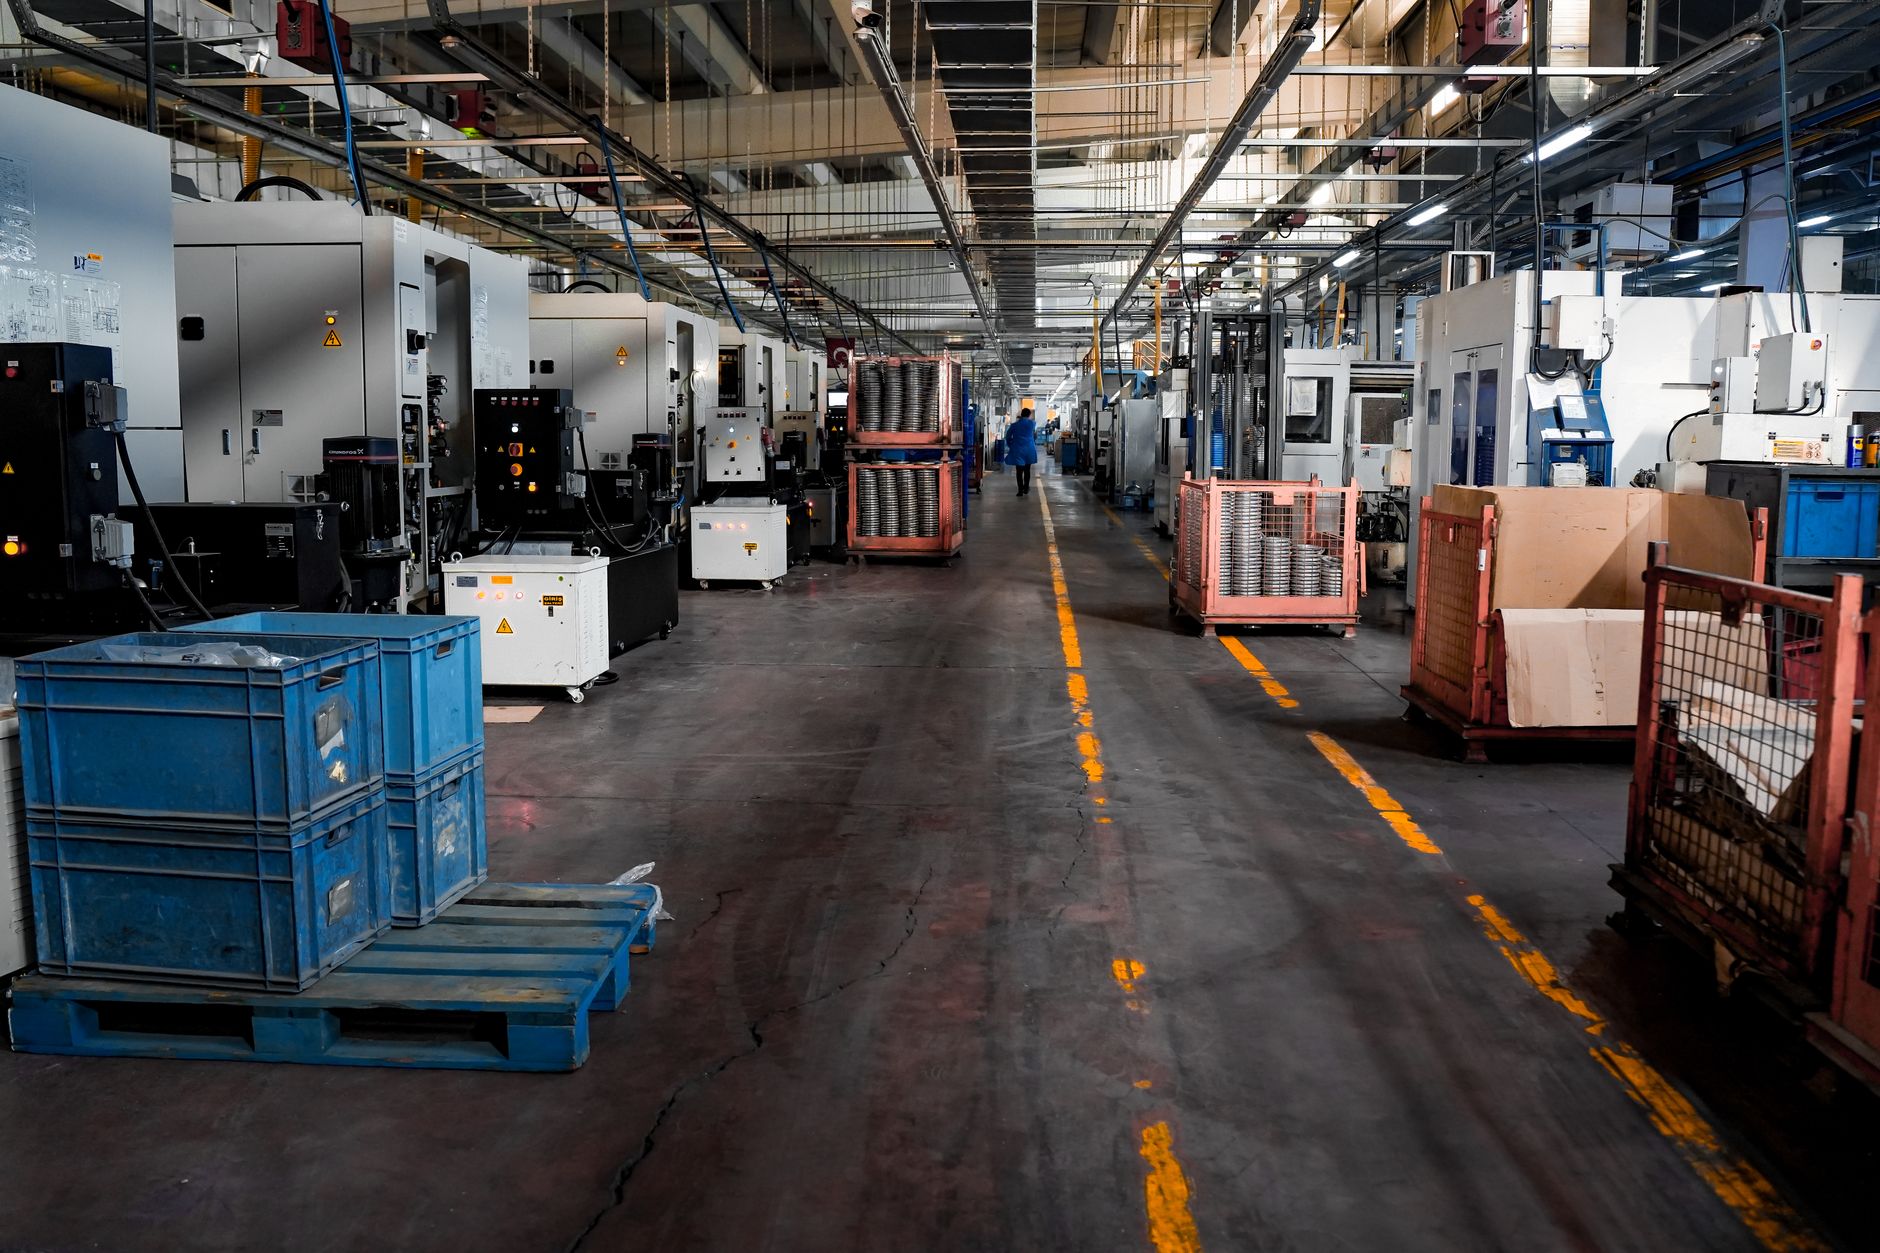
Most of the robot's work is repetitive carrying on fixed paths. A tray or roll comes off one station, travels a set route, and is set down at the next station, over and over. These are the moves that can be scheduled in advance, which is what makes them a good fit for a fixed route.
Battery plants add conditions a warehouse does not. Electrode material is sensitive to contamination and handling, dry rooms limit what can pass through them, and staging areas have to match the pace of the process steps they feed. A route that works in a warehouse can fail at a dry-room airlock, so the assessment checks every stop before any route is set.
The table below lists the task types to measure. The hour figures are not in the research, so the site assessment fills them in from the plant's own handoff logs and time studies.
How does the ROI math work for a battery plant?
The savings range rests on three inputs. The first is labor hours: the hours each week that people spend on the transport work the robot takes over, priced at the local wage for this job shown in the government wage data on this page. The second is the share of those moves the robot realistically takes, because some moves still need a person for exceptions, off-route loads and quality checks. The third is the fixed lease payment, quoted after a site assessment.
The Bureau of Labor Statistics Occupational Outlook Handbook says the hand laborers and material movers group held about 7.0 million jobs in 2024. The detailed occupation Laborers and freight, stock, and material movers, hand is listed at 2,988,900 jobs, with projected growth of about 4% from 2024 to 2034. That tells you how large this kind of work is across the economy and how fast it is expected to grow. It does not tell you what your plant pays, which the wage panel on this page shows.
Put simply, the labor side of the range is the robot's share of transport hours, priced at that wage, set against the lease payment and the cost of keeping the fleet running. A plant where the robot takes most of the handoff hours gets a very different range than one where it takes a small share, even under the same lease. That is why the calculator asks for the share, not only the headcount.
What changes the number up or down?
Route length and stops per route matter most. A long, straight run between two stations gives the robot more productive time per trip, while many short hops spread across a floor reduce the gain. Shift coverage also matters. A robot that runs through a second or third shift without a person on the route spreads its lease cost over more hours, provided the staging and charging plan can support them.
The work mix moves the range too. Carrying trays between steps is steadier than moving a mixed set of loads, and a site that changes routes often spends more on remapping and testing. The checklist below lists what to confirm before you read the range as a planning number.
What are the risks to the return, and how do you avoid them?
The biggest risk is a fleet larger than the routes can use. Robots that wait for loads or queue behind each other at a dock return less than their lease cost. Start with the routes that have the steadiest hand-carried work, and add units only when the logs show them busy.
The second risk is a ramp that stalls. According to a secondary summary of Clean Energy Associates findings, some battery projects were canceled in early 2025, and smaller vendors have struggled to reach manufacturing at scale. A fleet sized for a line that never reaches full volume sits underused. Tie the fleet to the line's confirmed ramp, and keep the lease scope to the lines that are running.
The third risk is integration. Routes that cross elevators, fire doors or dry-room airlocks need controls and staging designed around the plant's systems, not added after go-live. Ask who owns exception handling and robot faults on each shift, because unowned faults are where the hours quietly disappear.
- Repeated carries on fixed routes
Autonomous Mobile Robot
Same path and pace on every trip, with no fatigue
Staff
Adequate, but pace varies with workload and fatigue
- Exceptions and off-route loads
Autonomous Mobile Robot
Limited, and staff must clear them
Staff
Strong, handles unusual loads and decisions
- Second and third shift coverage
Autonomous Mobile Robot
Runs with no person on the route if staging is ready
Staff
Needs a shift, breaks and a supervisor
- Contamination and quality checks
Autonomous Mobile Robot
Follows the route but cannot judge material condition
Staff
Can spot defects and handling problems
- Changes to layout
Autonomous Mobile Robot
Needs remapping and testing when routes change
Staff
Adapts to a new route without setup
- Time to start a new route
Autonomous Mobile Robot
Mapping and testing up front
Staff
Starts on day one
How long does it take to reach payback?
A realistic timeline runs in phases. The site assessment and route mapping come first, then a pilot on one route or one cell line, then the rest of the fleet once the logs confirm the hours. Each phase has its own check, so the plant does not commit to a full fleet on a forecast alone. The total length depends on how fast the routes reach steady use, and the assessment sets that rather than this page guessing it.
Training and go-live support happen during the pilot, so the plant's own staff run the robots before the fleet grows. The payback date should come from the pilot logs, not from the first quote. If the logs show the robot taking fewer moves than planned, check route design and staging first, before any change to the fleet.
How do you get a precise figure from a free site assessment?
A free site assessment maps the transport routes, counts the handoffs and times the moves that are done by hand. We are a US commercial robot integrator: we select the robot for the site, lease it through financing, deploy and integrate it, train the staff and service it nationwide. From the assessment we match routes to the right robot type, which may be a pallet mover, a tray carrier or a mix with conveyors and other automation, and we send a lease quote with the fixed payment and service terms.
Bring a list of the transport routes between process steps, handoff logs from the last few weeks, the ramp plan for each new line, and the staffing plan for transport roles. With those, the range on the calculator becomes a figure built from your floor, and you can see which inputs are measured and which are estimated.
Does the robot change injury risk in transport work?
Transport work carries injury risk, so the safety case belongs in the return. According to the Bureau of Labor Statistics, manufacturing recorded 332.6 thousand nonfatal injury and illness cases in 2024, a rate of 2.7 per 100 full-time workers. Those are whole-industry figures, and the research did not find a verified rate for material movers inside battery plants.
The National Safety Council's summary of BLS data puts the private-industry total recordable rate at 2.3 in 2024, down from 2.4 in 2023, the lowest level in that series since 2003. Robots do not remove people from the floor, and the lines still need forklift and dock rules. What they do is take fewer manual carries and handoffs out of the shift, and the plant's own incident logs will show whether that change happens.
On turnover, the research found no BLS rate for material-moving occupations inside manufacturing, so the labor case should not lean on a turnover figure. Record transport turnover from the plant's own HR data during the assessment. A stable route with trained staff is worth more where turnover is high, and that effect should be measured, not assumed.
Frequently asked questions
Want a warehouse robot at your battery manufacturing plant?
Tell us about your site. We will recommend the robot, quote the lease, and keep it serviced.
Sources
- US Bureau of Labor Statistics, Occupational Employment and Wage Statistics (OEWS May 2024)
- Bureau of Labor Statistics, Occupational Outlook Handbook: Hand Laborers and Material Movers
- ICCT working paper on US battery manufacturing jobs by 2032
- Volta Foundation: How many workers are needed for battery manufacturing
- IBISWorld: Battery Manufacturing in the US
- Bureau of Labor Statistics charts: nonfatal injuries and illnesses by industry
- National Safety Council: Work-related incident rate trends
- Pulse: American Clean Power report summary on US battery module capacity
- Energy-Storage.news: US battery gigafactories face delays and cancellations