
The short answer
An autonomous mobile robot returns money in a furniture factory by taking over the repetitive cart moves between cutting, assembly and finishing that material handlers would otherwise make on every shift. The savings range is the labor hours those routes cover, measured as the share of that work the robot realistically takes, minus the lease payment and service. A free site assessment measures those hours on your floor, so the range becomes a figure you can check.
Key takeaways
- The return comes from labor hours in the cart moves between cutting, assembly and finishing.
- Savings are a range built from measured hours, the share of work a robot takes, and the lease payment.
- Route layout, shift count and floor condition move the number more than anything else.
- Start with one route, measure the hours it takes over, then expand to more routes.
- A free site assessment turns the range into a figure you can trace back to your floor.
Run the numbers for your site
Pick your city or state for a real regional number - we use the real BLS wage there. (On the live site this auto-detects from your location.)
What do you want to automate?
The robot takes the repetitive cart and pallet moves off the heaviest motion.
What return can furniture factories expect from autonomous mobile robots?
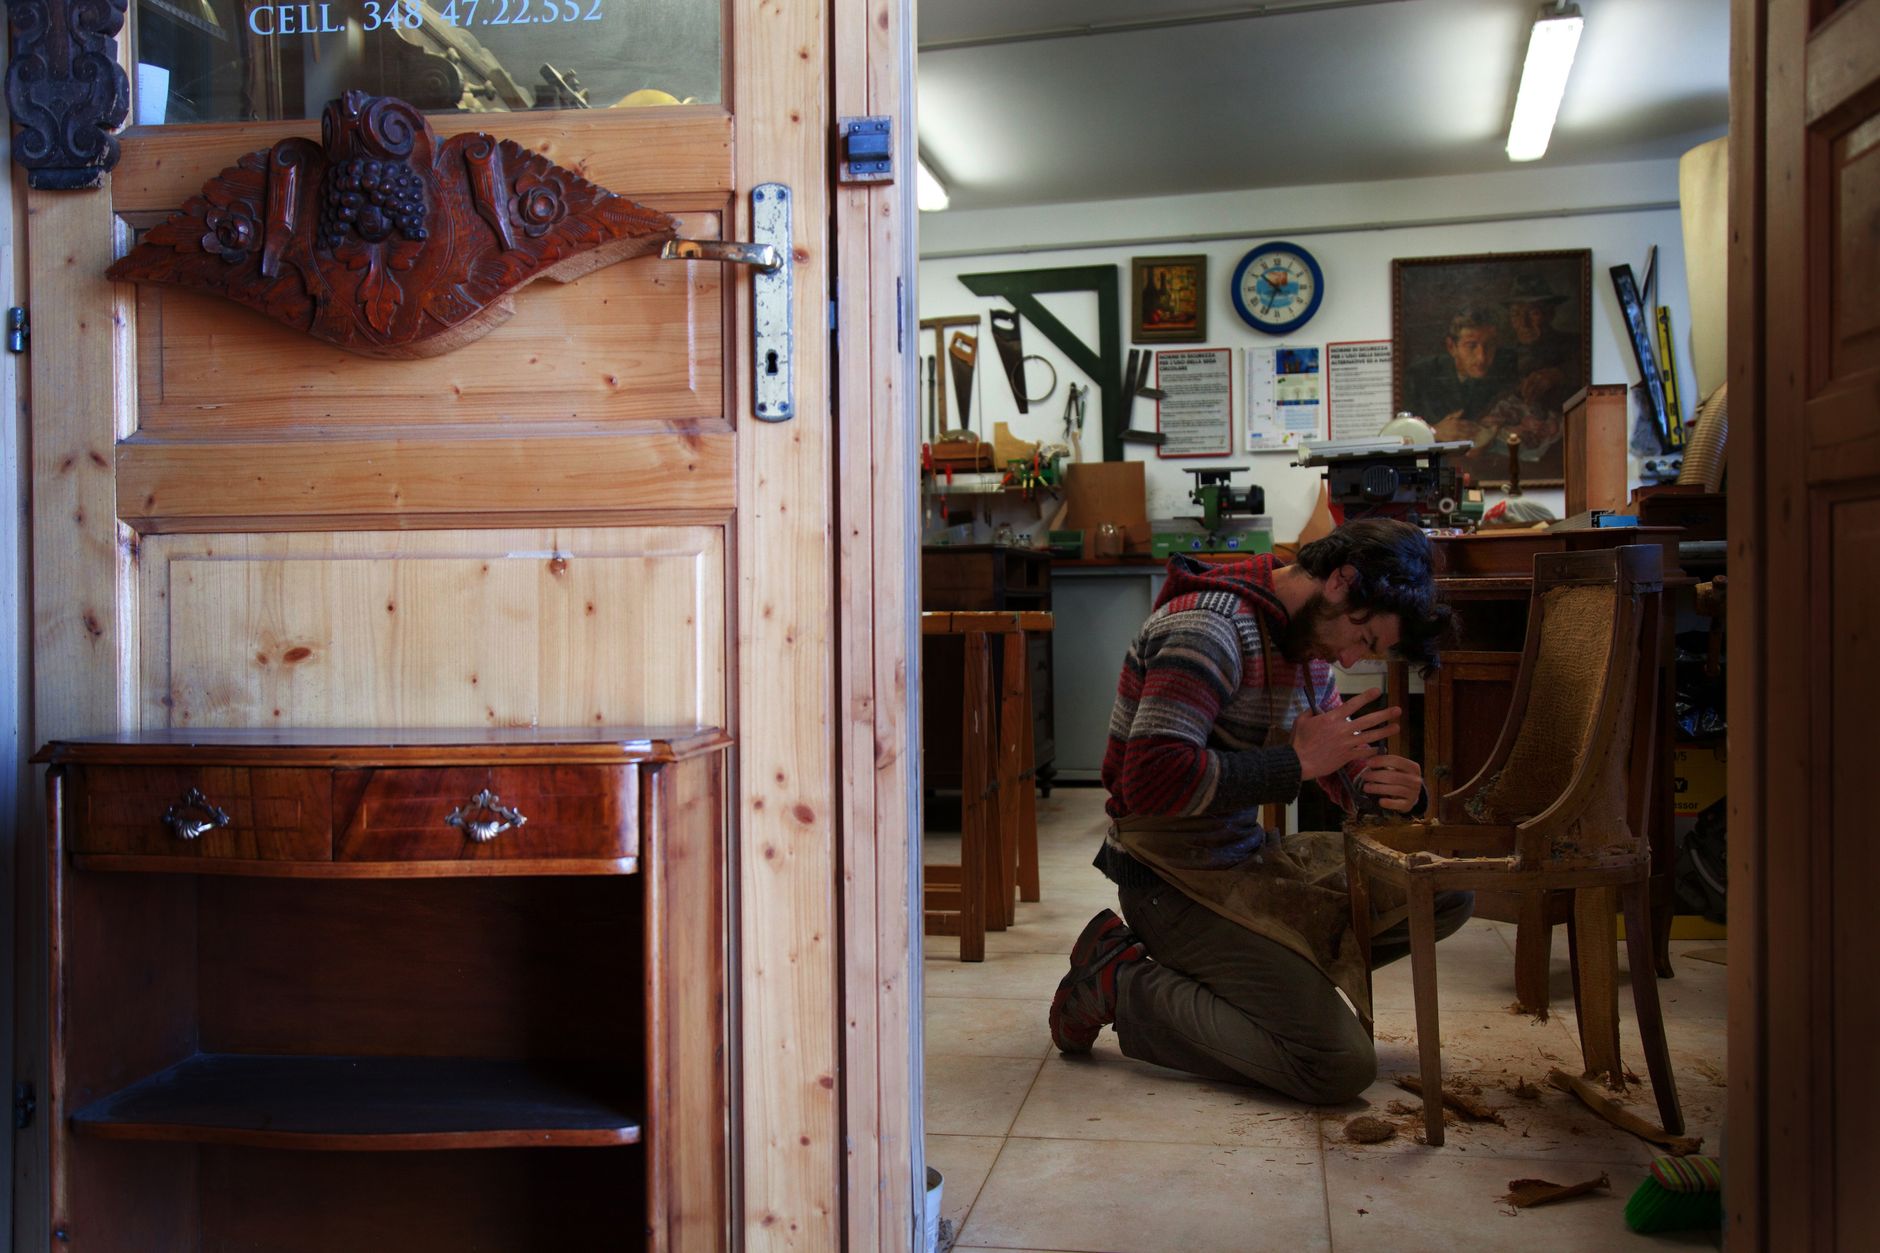
A furniture factory moves parts all day. Panels and lumber leave the cutting area, sub-assemblies travel to the assembly line, and finished pieces go on to sanding, finishing and packing. Much of that movement is carts pushed or towed along the same routes by people paid to do it on a set schedule. An autonomous mobile robot can take over a share of those trips, and that is where the return in this setting comes from.
The return is not a general productivity gain. It is labor hours in one specific job, moved from people to a machine that follows routes you choose. Its size is set by your route and shift data rather than by an industry average, so the autonomous mobile robot ROI for furniture factories can be answered with your own numbers.
Labor supply is the pressure behind the question. IBISWorld reports 112,813 people employed in US household furniture manufacturing, down an average of 1.5% a year from 2020 to 2025. Fewer people in the sector means more shifts depend on finding someone for each cart move, and that is the work a fixed schedule protects.
Where do the savings come from in a furniture plant?
The labor being offset is the work of Laborers and Freight, Stock, and Material Movers, Hand. On a furniture floor that means the person pushing carts from the cutting room to assembly, moving bundles of frames to the finishing booth, and restocking staging areas between runs. The government wage data on this page is for that job, and the savings figures are priced on it.
The Bureau of Labor Statistics Occupational Outlook Handbook lists 3,004,800 people employed in this detailed occupation nationally, tied to 2023 data. That covers all industries, so it shows the job is common across the economy, not how many handlers a furniture plant employs.
Robots that follow fixed routes do best at the repetitive part of the job: the same load, the same origin and destination, the same timing. They do less well with unplanned pickups, aisles blocked by temporary stock, and tasks that need hands. Those hours should stay with people, and the assessment should show exactly which hours those are.
Median hourly wage, Laborers and Freight, Stock, and Material Movers, Hand
$4,380
Monthly cost of one full-time worker, at the median wage plus payroll costs (an estimate, not a quote).
- Schedule consistency
Autonomous Mobile Robot
Runs the same fixed route at the planned times, every shift
Staff
Varies with attendance, breaks and the day's priorities
- Coverage when a shift is short
Autonomous Mobile Robot
Keeps scheduled moves running when the shift is short-staffed
Staff
Fills gaps only when people are available, and overtime adds cost
- Unplanned work
Autonomous Mobile Robot
Weak at blocked aisles and stock that moves to new places
Staff
Adapts quickly to odd loads, temporary stock and blocked paths
- Hands-on tasks
Autonomous Mobile Robot
Carries the load it is set up for and nothing else
Staff
Handles varied loads, lifting, loading and checks
- Hours of coverage
Autonomous Mobile Robot
Runs the hours the plant schedules it for
Staff
Works the shifts they are hired and scheduled for, with breaks
How does the savings math work?
The calculation has four parts. First, the hours per shift the cart moves take today, measured by timing the routes rather than estimating them. Second, the share of those hours a robot can realistically take on fixed routes, which is usually less than the full total because of exceptions, loading and checks. Third, the number of shifts it runs. Fourth, the lease payment and service cost, quoted after the site assessment.
Multiply the hours taken over by the local wage for this job, add any overtime or agency cover the plant avoids, and subtract the lease payment and service. The result is a range, not one figure, because the hours and the share both vary from week to week. A plant short of handlers may have more of its hours covered by overtime, which the calculator lets you enter separately.
Read the range with its assumptions beside it. A share set too high makes the number look better than the floor will deliver, and that is the first assumption to challenge.
| Task | Today | With a robot |
|---|---|---|
| Pushing carts from cutting to assembly | Measured hours per shift from the timing study | Share of those hours on fixed routes, set in the assessment |
| Moving finished frames to the finishing booth | Measured hours per shift from the timing study | Share on a scheduled route, minus exception handling |
| Restocking staging areas from the warehouse | Measured hours per shift from the timing study | Likely kept with staff, because stock moves vary by order |
| Loading and checking each cart | Time spent at each station | Still done by staff, so it stays in the staff hours |
| Clearing blocked routes and exceptions | Unplanned interruptions logged in the study | Stays with staff until the route plan covers them |
Hour figures come from the site assessment timing study, not from published data. The rows show the method for measuring each task, not a benchmark for any plant.
How many people does this work in a furniture plant?
Our research did not find a verified count of material handlers per furniture plant, so this page does not state one. What the data does show is how big the sector is in plant terms. The Census Bureau Economic Census, using 1997 and 2002 data, counted 20,738 establishments and 603,668 paid employees across NAICS 337, the furniture and related products sector.
That works out to about 29 paid employees per establishment on average, across every role including supervisors, office staff and machine operators. Material handling is only a fraction of that. Because the figure is dated and covers all of NAICS 337, use it as a rough sense of plant size, not as a staffing plan, and only where no site count exists.
Turnover is the bigger issue for handling work. A Woodworking Network and Woodwork Career Alliance workforce study, with 2020 survey data, found 39.3% of respondents had lost at least a quarter of their production workforce, and 4.7% reported turnover above 75%. A separate Woodworking Network survey, date not confirmed, found 80% of woodworking companies struggling to hire. Those are the conditions that leave carts sitting in staging.
What changes the number up or down?
Route length and the number of stations on the path matter most. A line where cutting, assembly and finishing sit in sequence, with short repeatable moves, gives the robot more trips it can carry. A plant with a separate warehouse feeding several buildings has more route to map and more exceptions to handle.
Shift count and batch size come next. A robot running two shifts takes over more hours than one running a single day shift, but only if the plant schedules enough moves to fill them. Frequent changeovers, where the product mix shifts often, add mapping work and can lower the share of moves that stay on fixed routes.
Injury exposure is a factor too, and it belongs in the case rather than the savings line. The Bureau of Labor Statistics reports 2.7 nonfatal injuries and illnesses per 100 full-time workers across all private manufacturing in 2024. Fewer manual cart pushes lower the exposure of the people who remain on the line, which matters for staffing as much as for cost.
What are the risks to the return and how do you avoid them?
The most common risk is an underused robot. If the routes get reconfigured or the plant drops a shift, the hours it takes over fall and the range falls with them. Set the route plan against the shift schedule you expect to run over the lease term, and review it whenever the product mix changes.
The second risk is downtime. A robot that stops hands its hours back to people, so the return depends on service response. Ask for spare unit coverage on critical routes, and confirm in writing that service includes on-site dispatch and remote triage before you sign.
The third is adoption. Floor staff who do not trust a route, or who park stock on it, cut the hours the robot can complete. Train the people who work beside the route, set clear rules for where stock may sit, and track the hours the robot actually completes against the plan. Missing hours are usually an adoption or routing problem, and tracking shows them first.
How common is automation in manufacturing right now?
Automation is growing across manufacturing, though our research did not find an AMR-specific figure. According to A3, North American robot orders rose 6.6% in 2025, with general industries driving broader adoption. That is an overall robot number, so read it as direction rather than a measure of AMR demand in furniture.
Automate reported that robot orders rose 11.6% in the third quarter of 2025, and that non-automotive sectors took 59% of demand. For a furniture plant that matters, because automation is no longer confined to the largest automotive lines. Plants that run steady routes between a few stations are where a fixed-route robot fits the work most naturally.
What is a realistic timeline from assessment to payback?
The timeline moves through stages. The site assessment comes first, with route mapping, a timing study of today's cart moves and a review of shifts and floor conditions. Next comes the quote for lease financing and service terms, then the decision and a fixed route plan.
Deployment usually starts with one route, not the whole plant. That lets the team check the hours the robot actually takes over, fix routing problems and train staff before adding routes. Payback arrives when the hours taken over, net of the lease payment and service, cover the commitment. When that happens depends on the route plan and the share of work taken, so the assessment has to model it rather than assume it.
We handle the parts a plant does not want to manage. We pick the right robot for the site, lease it through financing, deploy and integrate it, train the staff and service it nationwide. Go-live support is part of the deployment, so the plant is not left to sort out the first routes alone.
How do you get a precise figure from a free site assessment?
A free site assessment replaces estimates with measured data. We map the cart routes between cutting, assembly and finishing, time the moves over several shifts, and record how many carts move on each route, how far they travel, and where they stop.
We also check the shift pattern, floor condition, door widths, lift points, and any place where a route crosses forklift traffic or where staging blocks an aisle. Those findings set the share of work the robot can realistically take, which is the input that moves the range most.
You receive the lease payment quote after the assessment, along with the savings range built from your measured hours and your own wage assumption. Ask for every assumption in writing. A precise figure is one you can trace back to your own floor.
Frequently asked questions
Want a warehouse robot at your furniture factory?
Tell us about your site. We will recommend the robot, quote the lease, and keep it serviced.
Sources
- US Bureau of Labor Statistics, Occupational Employment and Wage Statistics (OEWS May 2024)
- IBISWorld, household furniture manufacturing employment
- US Census Bureau Economic Census, NAICS 337 (1997 and 2002 data)
- Bureau of Labor Statistics Occupational Outlook Handbook, hand laborers and material movers
- Bureau of Labor Statistics, nonfatal injuries and illnesses by industry
- Woodworking Network and Woodwork Career Alliance workforce study
- Woodworking Network survey on hiring and pay
- A3 via Robotics 24/7, 2025 robot orders
- Automate, Q3 2025 robot orders