
The short answer
Autonomous mobile robot ROI for produce packing houses comes mostly from labor hours during harvest peaks, when a robot takes repeat bin and pallet moves between the wash line, sorting, and cooler areas off crews. The savings range depends on how much of that hauling follows fixed routes, how long the peaks run, and the lease cost, which is quoted after a free site assessment. Treat the result as a range measured on your own floor, not a promise.
Key takeaways
- Repeat bin and pallet routes are where the return is most likely to show up.
- Savings come from hours of hauling work, not from cutting packing line staff.
- Route repeatability and peak length move the savings range the most.
- Overestimating the share of hauling a robot takes is the main risk to the return.
- A one-route pilot through a full harvest peak gives you the number to decide on.
Run the numbers for your site
Pick your city or state for a real regional number - we use the real BLS wage there. (On the live site this auto-detects from your location.)
What do you want to automate?
The robot takes the repetitive cart and pallet moves off the heaviest motion.
Autonomous mobile robot ROI for produce packing houses: the short answer
Autonomous mobile robot ROI for produce packing houses comes mostly from labor hours during harvest peaks. A robot takes repeat bin and pallet moves between the wash line, sorting, and cooler areas, so crews can stay on the line when volume spikes. The return is a range, not a single figure, and it depends on how much of the hauling follows fixed routes and how long the peaks run.
The case rests on labor. According to Produce Processing's labor survey, 86% of produce processors experienced labor shortages in 2023, and those shortages limited production. Shortages pull people off the line first, and hauling is often the work that goes unstaffed when that happens, which is why it deserves a close look before anything else.
Where does the return come from in a packing house?
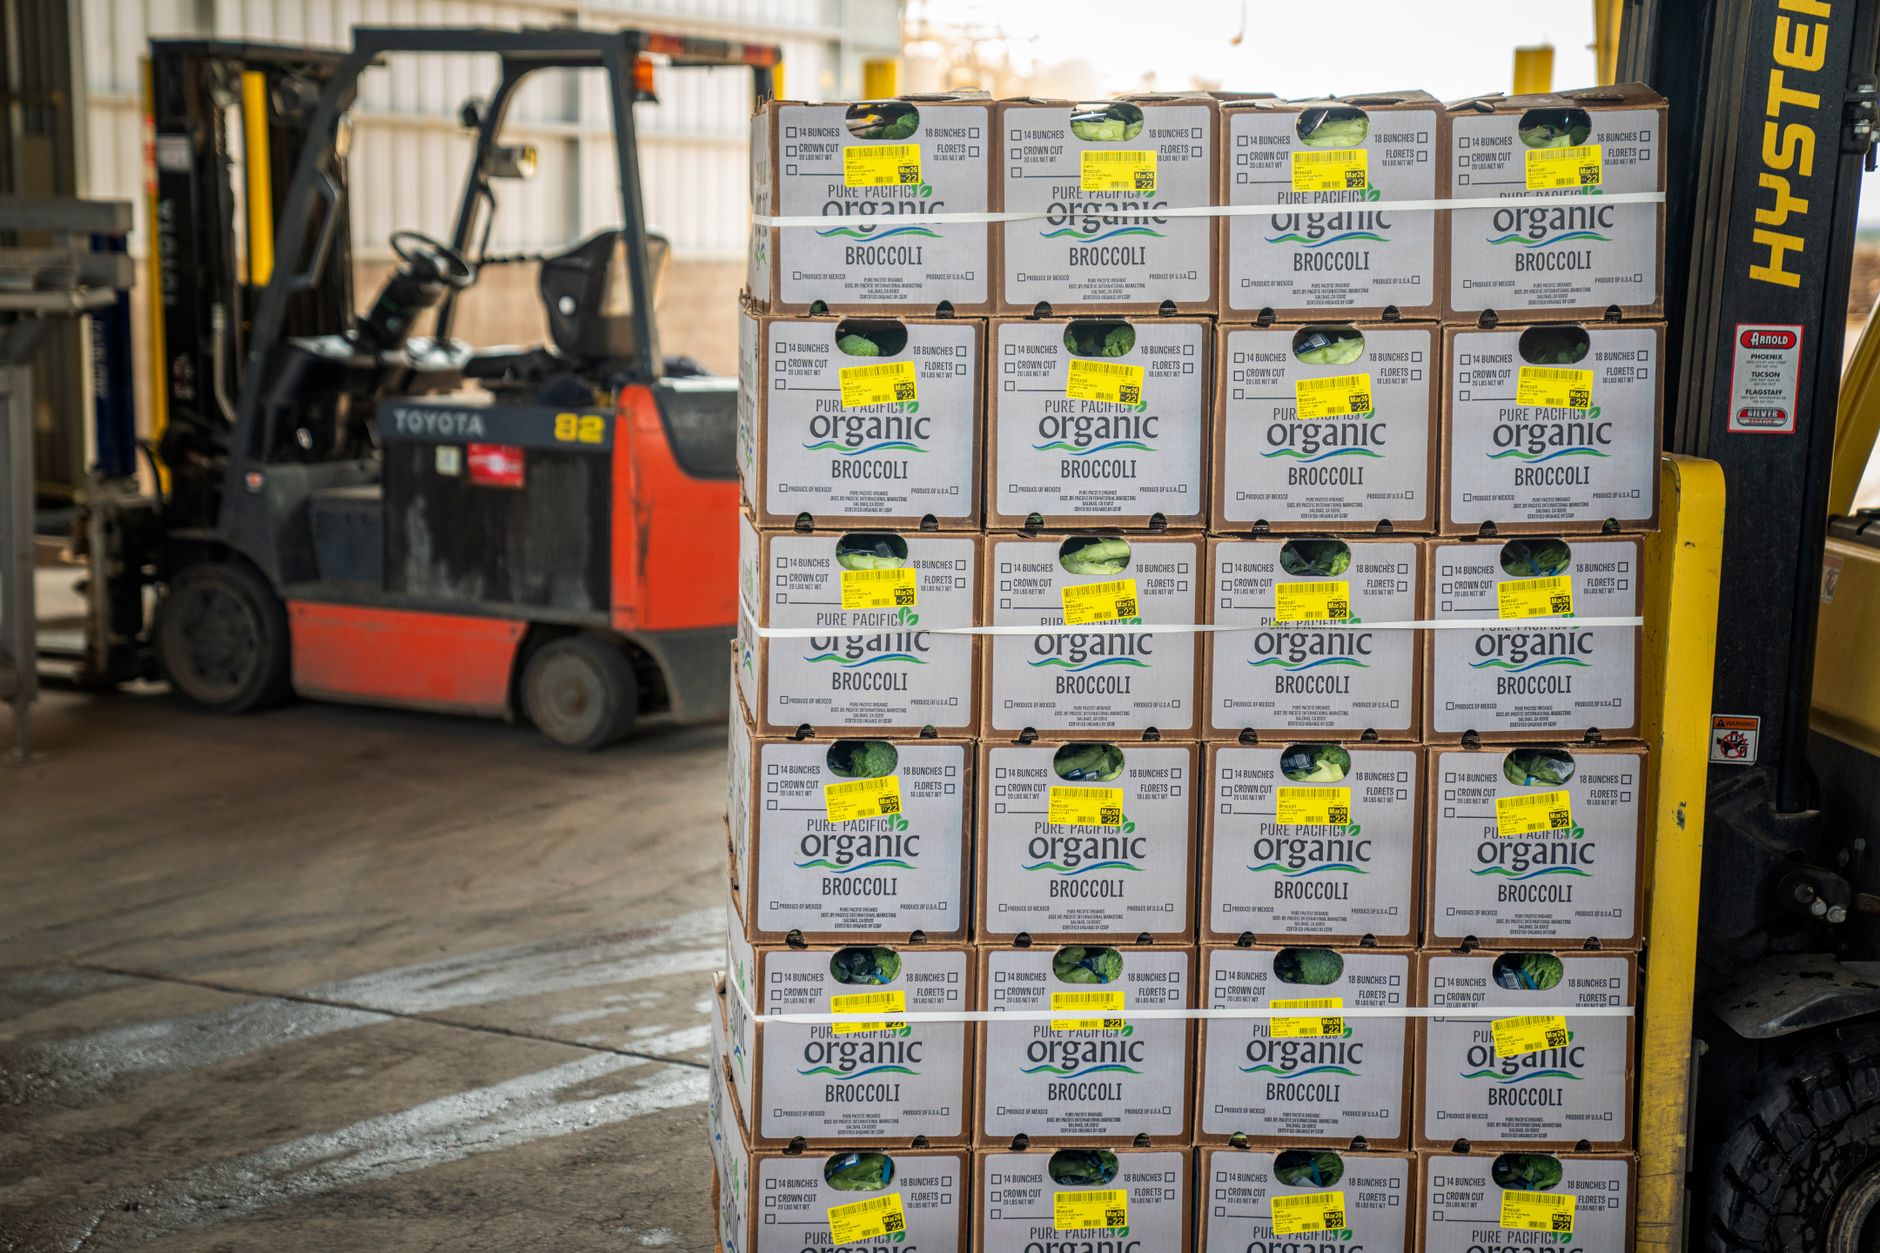
The return comes from three places: fewer hours of hauling labor during peaks, less overtime to cover the gaps, and fewer stalls when a bin or pallet waits for a person to move it. Packhouses suit this because the moves repeat. Field bins go to the wash or dump area, washed product goes to sorting, and finished pallets go to staging and cooler doors, often along the same paths every shift.
Some of the return is less visible. When a robot handles hauling, supervisors spend less time reassigning people between tasks, and sorting and packing lines wait less for empty bins or staged pallets. Those effects show up in line utilization, not on a payroll line, so a site assessment should time them alongside the hauling itself.
Median hourly wage, Laborers and Freight, Stock, and Material Movers, Hand
$4,380
Monthly cost of one full-time worker, at the median wage plus payroll costs (an estimate, not a quote).
How does the savings math work?
The basic math has three parts. First, measure the hours of hauling work per shift that run on routes a robot could follow, counting only moves that repeat. Second, apply the share of those hours a robot realistically takes over. Third, value those hours at the local wage for this job, using the government wage data on this page for Laborers and Freight, Stock, and Material Movers, Hand, and then subtract the lease cost.
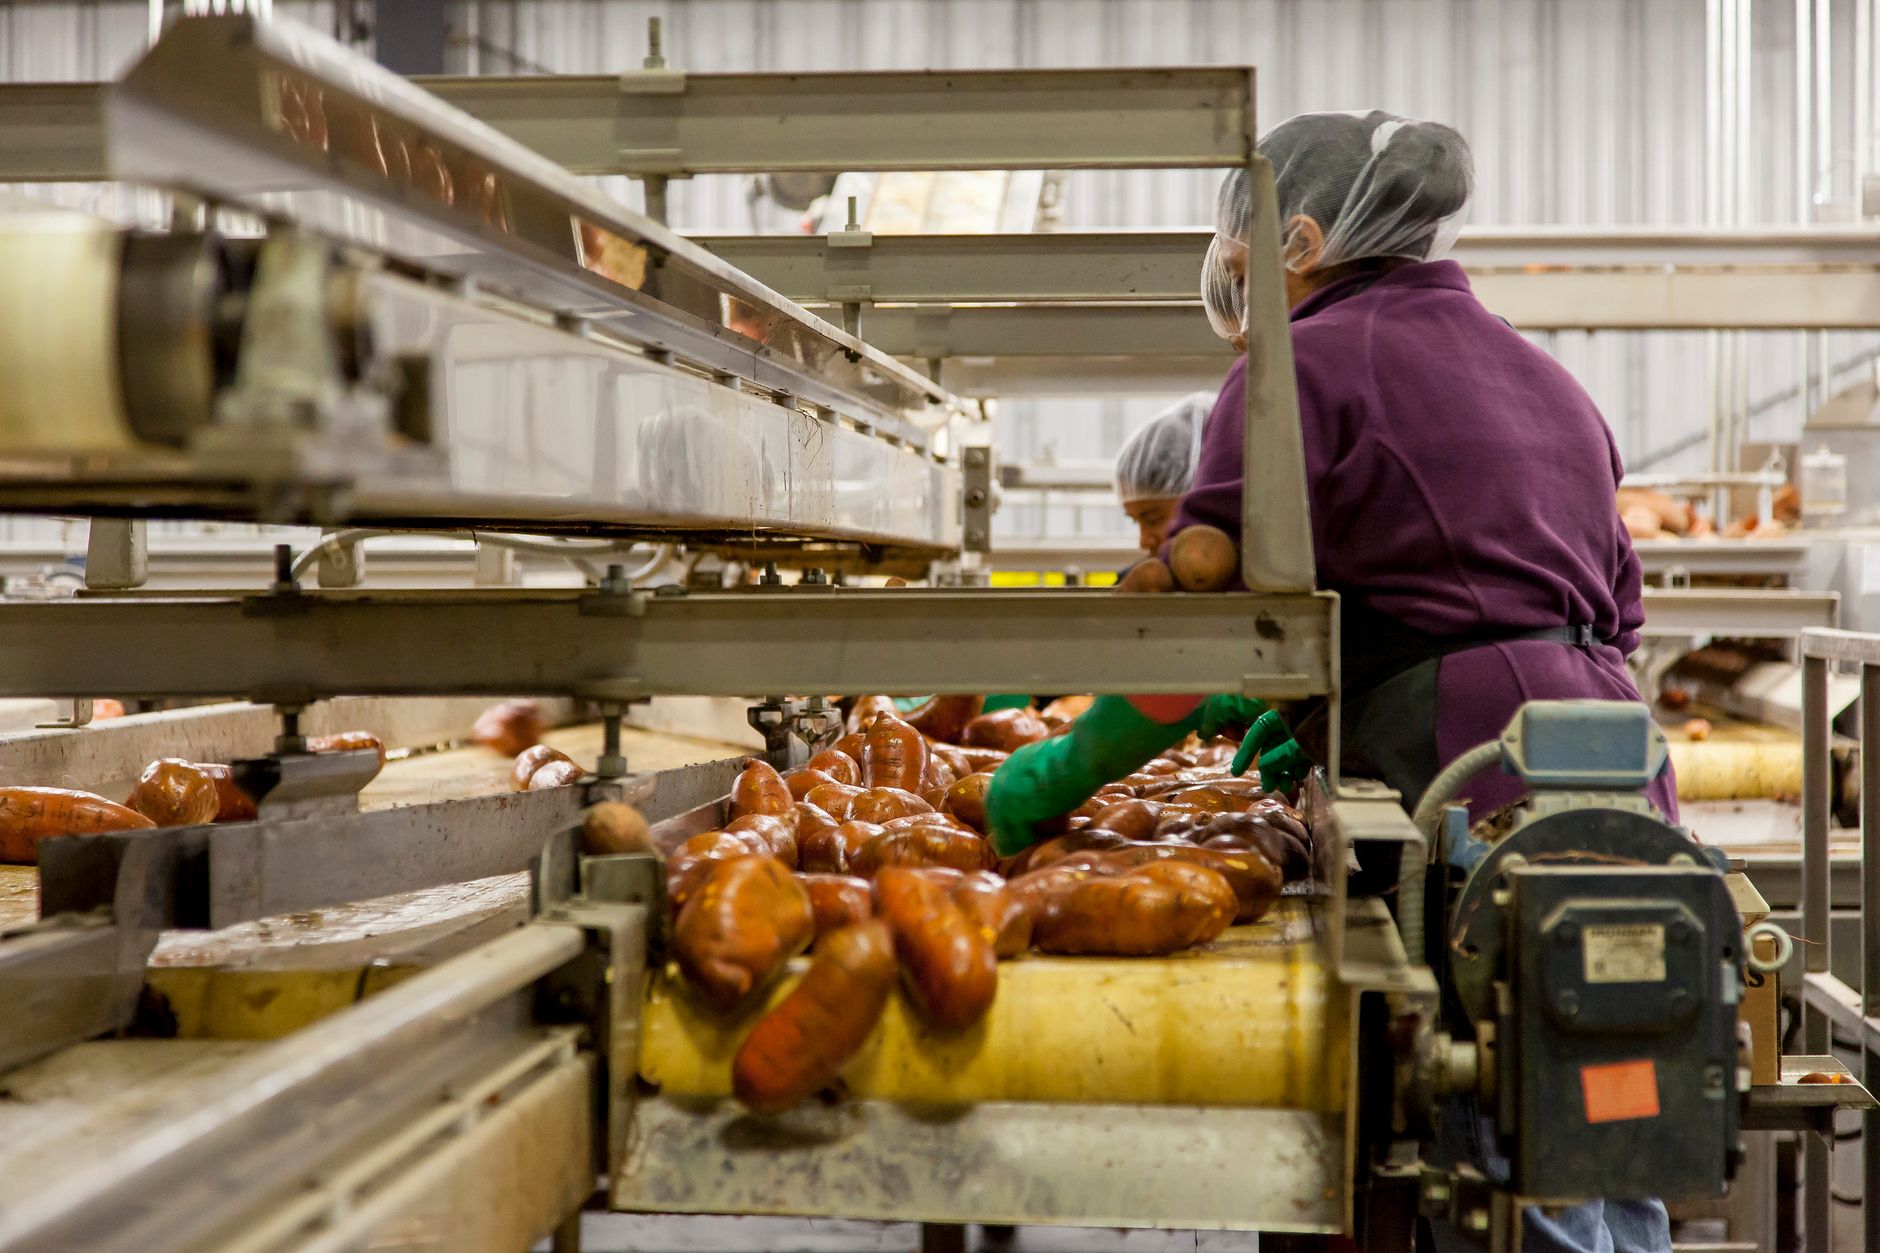
The labor side is priced on that job because it is the type of work a robot takes. Packing, sorting, grading, and dock decisions stay with people, and their time is not counted in the savings range. The output is a low and high figure built from your own hours, not a promise, and a site with long peaks and stable routes will land higher than one with irregular volume.
What changes the number up or down?
Route repeatability moves the range the most. A route that runs the same way every shift can be counted with confidence, while a route that changes with each order or each harvest adds uncertainty and may need manual handling at most stops. Layout changes in the off season also reset the route map, so a site that reconfigures often should expect a wider range.
Peak length and the number of peak shifts set how many hours the robot can offset in a year. Turnover matters too. An older Texas survey of fruit and vegetable employers, from around 2006, reported average turnover of 38%, with individual employers ranging from 2% to 120%. Each new hire on a hauling crew needs training, so a high-turnover site spends more hours on that than a stable one. That data is old, so use it as a pattern to test against your own hiring records rather than as a present rate.
What risks could erode the return, and how do you avoid them?
The main risk is overestimating the share of hauling a robot takes. If routes change every week, or if most stops still need a person, the hours offset shrinks while the lease cost stays fixed. Avoid this by mapping only the routes that run every shift and planning an explicit manual lane for everything else.
Layout friction is the second risk. Wet floors around washing, shared aisles with forklift traffic, and cooler door timing all cut uptime. Injury exposure is a real concern in this sector: the California Department of Industrial Relations reported a nonfatal injury incidence rate of 3.7 for fruit and vegetable preserving and specialty food manufacturing in 2024. A robot can reduce manual lifting on repeat moves, but that benefit has to be measured, not assumed.
The third risk is crew acceptance. Staff who see a robot as a threat may route around it or slow the handoffs, which erases the hours offset. Involve shift leads in route design, explain which tasks change and which do not, and make the pilot results visible to the crew.
How long does it take to go from assessment to payback?
A realistic path runs in phases: site assessment and route mapping, a single-route pilot, go-live support, and then a review of measured hours against the lease. Starting with one leased unit on the heaviest repeat route proves the hours offset before the site commits to more units.
Payback depends on how quickly the pilot reaches steady hauling and how many peak weeks the season has. A pilot that runs through a full harvest peak tells you far more than a few weeks in a slow month, so schedule the review for the busiest stretch you can get. Robots are leased through financing, and the terms are set after the assessment so they match your routes.
Service Robot Co. handles the work from start to finish: choosing the robot for the site, lease financing, deployment and integration, staff training, and nationwide service. That means one partner for the pilot, the go-live, and the repairs, rather than separate parties to coordinate during a peak.
What does the free site assessment give you?
A site assessment maps the packing house, times the hauling routes across peak and off-peak shifts, and identifies the share of work that fits a robot. The output is a savings range built on your own hours, a recommended number of units, and a lease quote with a fixed robot lease payment. The lease quote comes after the assessment because the route data sets the terms.
Bring the basics: a layout drawing, shift schedules for harvest and off-season, bin and pallet counts per shift, cooler and dock locations, and any wash-down or floor constraints. The more precise the route times, the tighter the savings range. The assessment is free, and it commits you to nothing.
How do robots and crews compare, and what is the labor picture?
A robot keeps a repeat route at a steady pace and does not need a break between runs. A crew is better at anything with variation: an irregular bin, a damaged pallet, a rush order, a dock request, or a judgment about whether product is ready to move. That split is why the robot takes repeat hauling and the crew keeps everything else.
On the labor picture, Data USA reports about 539,000 workers in Packers and Packagers, Hand in 2023. That is a line occupation, not a count of hauling staff, but it shows how large the labor pool is. The Fruit Growers News 2026 labor survey reports that nearly half of growers had labor shortages in the 2025 season, and 24% had trouble securing enough reliable workers. Those are grower figures, but they describe the same seasonal market packhouses hire from.
The Produce Processing survey adds that 29% of processors used H-2A workers and 43% planned to automate in 2024. The USDA Economic Research Service has no official count of packhouses; its archived page cites Census County Business Patterns data showing 4,514 food and beverage plants in California in 2010, which covers far more than packhouses. Published data did not give a typical headcount for hauling staff at one site, so the planning headcount used on this page is an assumption to check against your own roster.
Frequently asked questions
Want a warehouse robot at your produce packing house?
Tell us about your site. We will recommend the robot, quote the lease, and keep it serviced.
Sources
- US Bureau of Labor Statistics, Occupational Employment and Wage Statistics (OEWS May 2024)
- California Department of Industrial Relations, 2024 injury rates by industry
- Data USA, Packers and Packagers, Hand (SOC 53-7064)
- Produce Processing, labor survey provides look at challenges facing processors
- Fruit Growers News, 2026 FGN labor survey on H-2A and automation
- Texas A&M AgriLife Extension, Texas fruit and vegetable labor survey
- UK DEFRA, Automation in Horticulture Review (July 2022)
- USDA Economic Research Service, food and beverage manufacturing (archived page)