

The short answer
Autonomous mobile robot ROI for trade show exhibit builders comes from crew hours spent moving heavy crates and booth components between storage, build areas and loading docks. The return is the labor value of the repeat moves a robot takes over, minus the lease cost and the time spent on route setup and supervision. Expect a savings range rather than a fixed figure, and expect that range to narrow once routes and crew hours are measured on site.
Key takeaways
- The return comes from crew hours spent moving crates and booth parts on repeat routes.
- A robot takes the repeat freight legs on a mapped path, while people keep placement and judgment work.
- Savings are ranges, and the range narrows after a measured site assessment.
- Lease terms, service coverage and the build calendar matter as much as the robot itself.
- Start with one unit on the busiest route before planning a wider fleet.
Run the numbers for your site
Pick your city or state for a real regional number - we use the real BLS wage there. (On the live site this auto-detects from your location.)
What do you want to automate?
The robot takes the repetitive cart and pallet moves off the heaviest motion.
What return can trade show exhibit builders expect from autonomous mobile robot ROI?
The autonomous mobile robot ROI for trade show exhibit builders comes from one source: crew hours spent moving heavy crates and booth components between storage, build areas and loading docks. These moves repeat along the same routes through every build cycle, which is the kind of work a driverless vehicle handles well. The return is the labor value of the hours that come off the crew, minus the lease cost and the time spent setting up and supervising the route.
The show market is not growing in a straight line, so judge the return on steady repeat moves rather than one large show. According to the CEIR Q4 2024 Index, as reported by Facilities Online, US B2B exhibition net square feet ran 3.0% below 2019, and attendance was the slowest metric to recover, 12.9% below 2019. Fewer square feet and fewer visitors can push a shop toward a steady flow of mid-size booths, and each of those jobs still needs the same loading dock to build area legs.
Expect a range, not a fixed saving. The range depends on how many moves follow a fixed path, how many hours the crew really spends on them, and the lease cost set in a quote after a site assessment.
Where do exhibit crew hours go today?
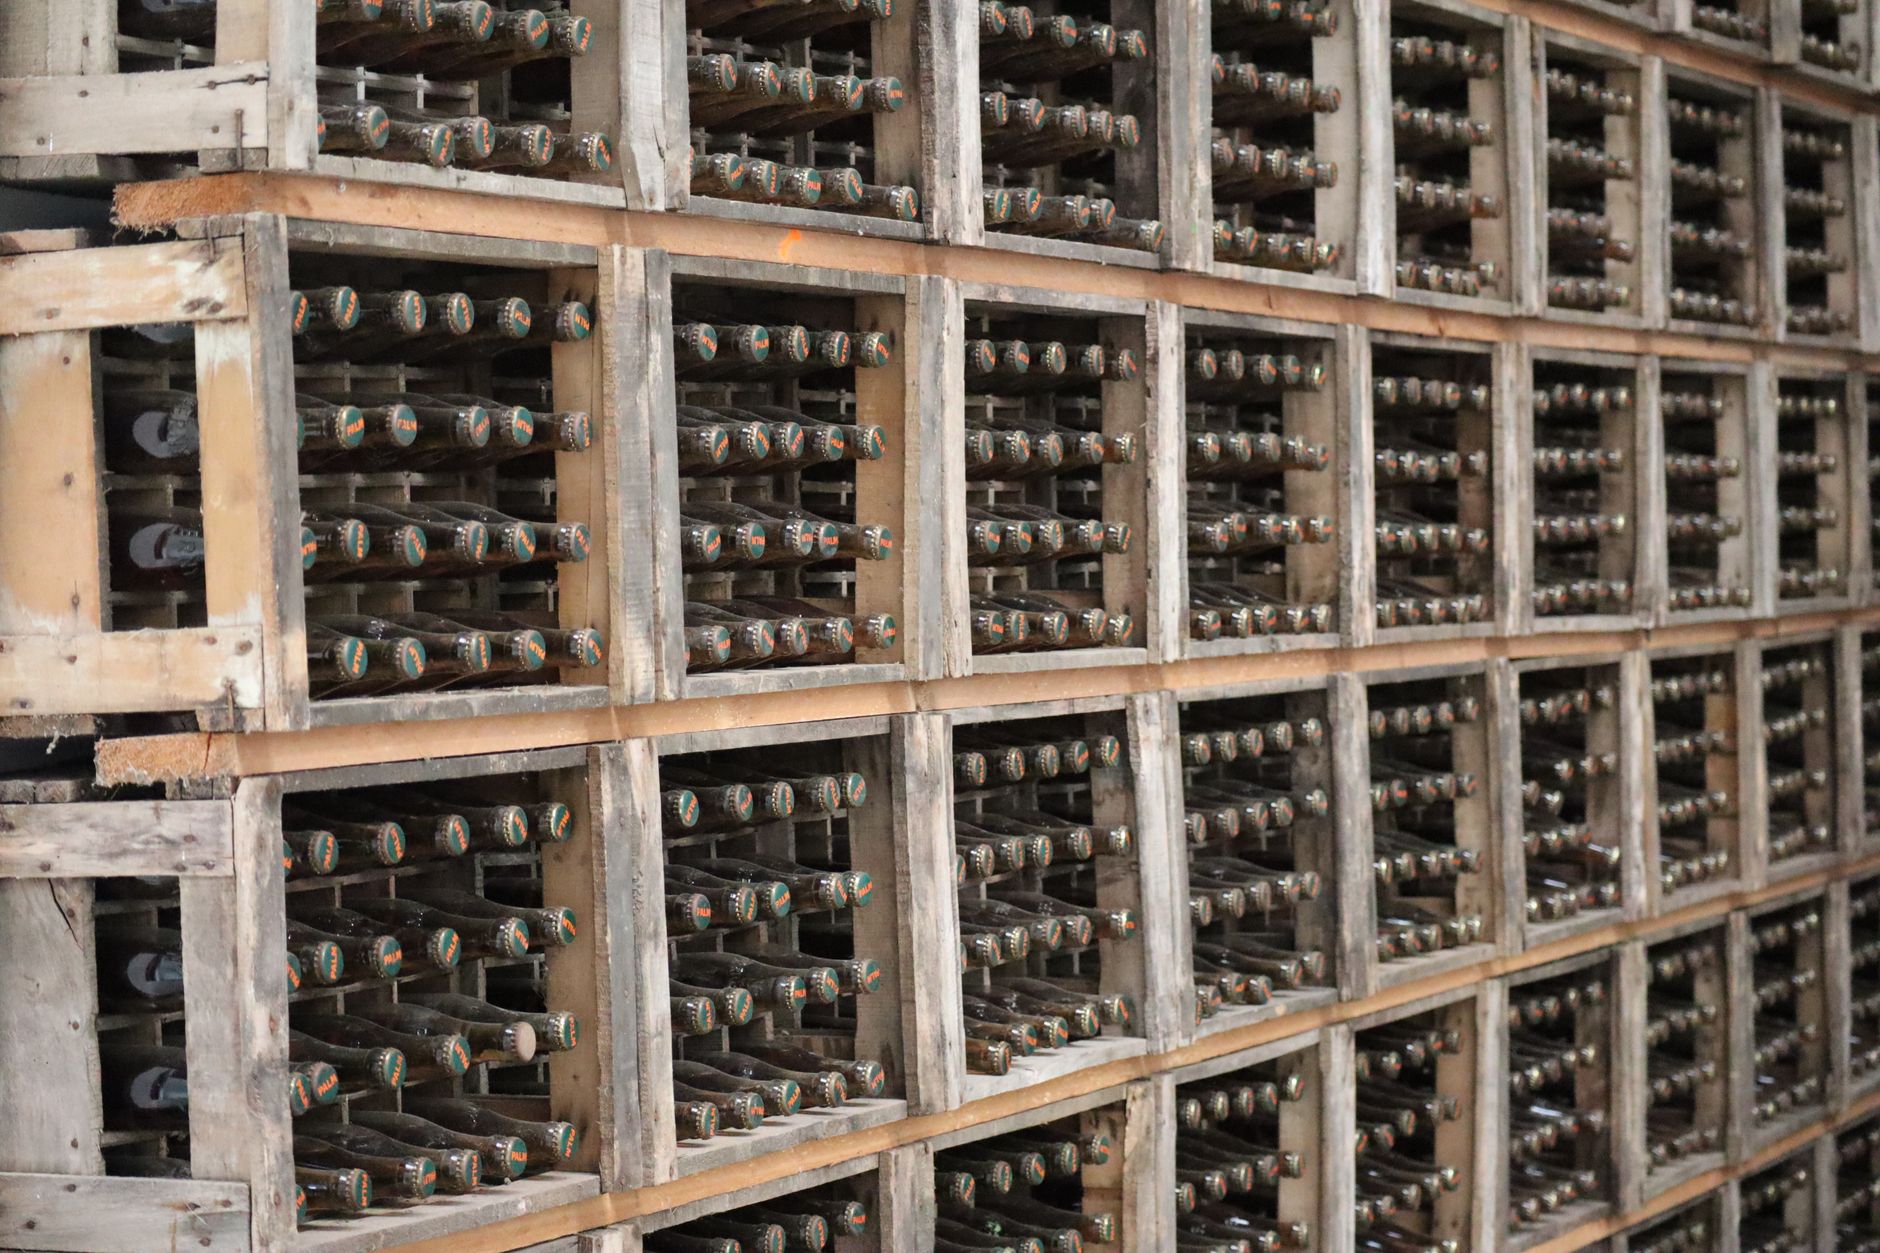
Heavy freight is the expensive part. A 2014 trade blog post on drayage described one 1,100 lb crate that needed about 37 general contractor labor hours, which the author put at about four and a half days of one person's work. That is a single case, and it is more than a decade old, so read it as an illustration of how heavy crates consume time, not as a current benchmark.
Freight at the venue is also billed in units of weight. Drayage is typically billed by weight, rounded up to the nearest hundredweight (CWT), so a 408 lb crate is billed as 5 CWT. Drayage is generally handled by union labor through the show's decorator, under a contract between show management and the drayage company. Track crate weights before you plan a route, because a small weight change can move the billed unit.
Handling cost is rising faster than many other line items. A 2022 industry survey reported in trade press found installation and dismantle labor, electrical labor and material handling rising faster than inflation, some by more than 30%. An older trade press comparison of eight major shows, covering 1996 to 2013, found material handling costs up 257% against 21% for installation and dismantle labor. Both are dated and neither is a current benchmark, but they point the same way.
Median hourly wage, Laborers and Freight, Stock, and Material Movers, Hand
$4,380
Monthly cost of one full-time worker, at the median wage plus payroll costs (an estimate, not a quote).
How does the autonomous mobile robot ROI math work?
The math has four inputs: weekly crew hours on repeat freight moves, the share of those moves a robot can take on a fixed route, the labor value of that work, and the lease cost. The return is the labor value of the hours the robot takes over, minus the lease and the time spent on route setup and supervision. Labor value is figured on the government wage data on this page for Laborers and Freight, Stock, and Material Movers, Hand, because that is the work the robot takes off the crew.
Exhibit crews are not all that job. Build teams also include carpenters, electricians and graphics installers, and the robot takes only the laborers and freight, stock, and material movers, hand type of work off their plate. The calculator on this page is pre-filled for exhibit builders and counts only that share of hours, so skilled time is never counted as saved.
The national employment base for this job is large. According to ONET OnLine, using the BLS projections program with a 2024 base year, 2,988,900 people were employed in this occupation. The national pool matters less to one shop than local hiring, so use your own hours and hiring data when you test the case.
For planning, this page assumes a build crew of four people moving freight at one site. That is an assumption to confirm during the site assessment, because no published headcount for exhibit builders was found.
Service Robot Co. works this math on site. We pick the robot that fits the route, lease it through financing, deploy and integrate it, train the staff and service it nationwide. The lease quote comes after a free site assessment, not from the calculator alone.
How many hours can a robot realistically take over?
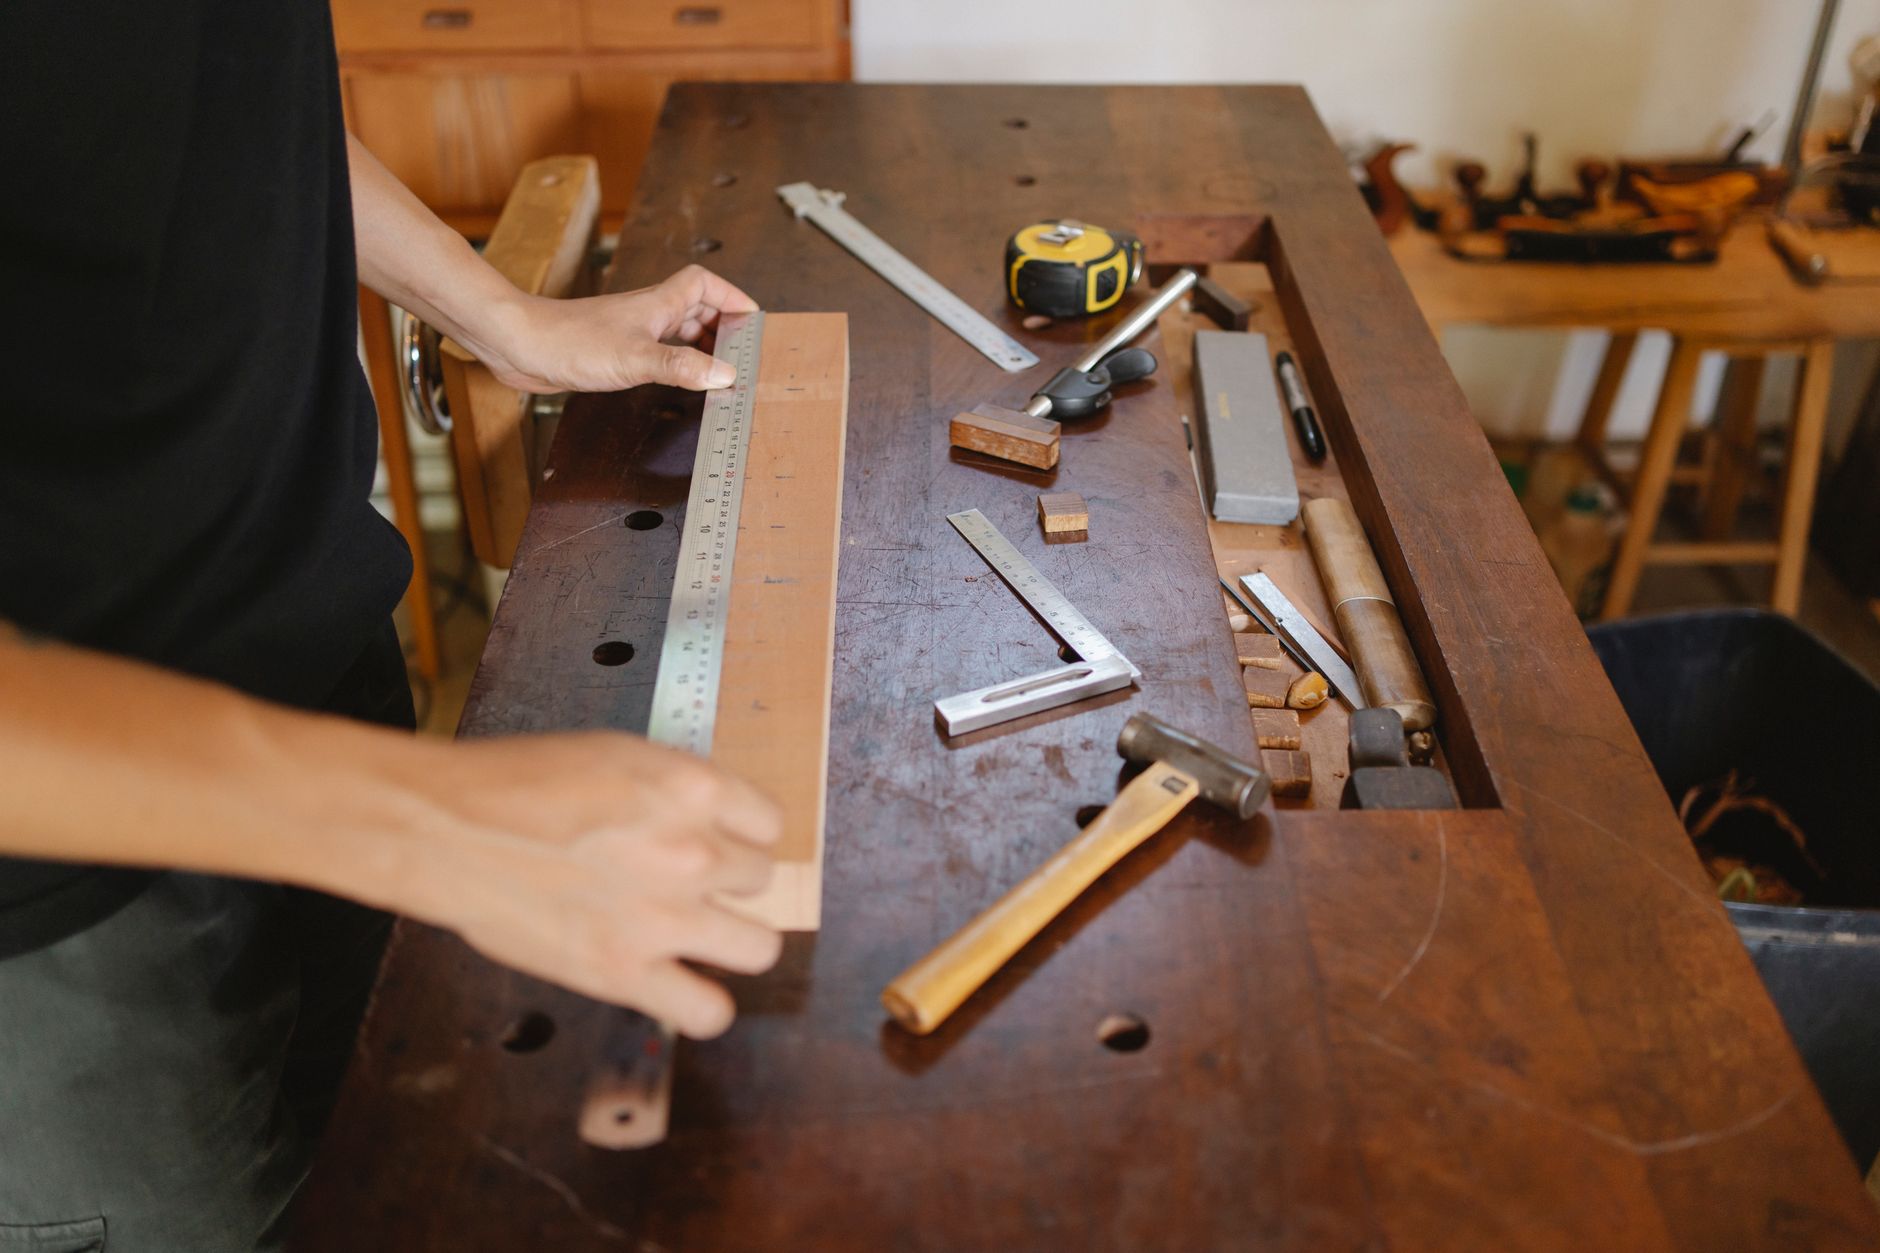
A robot takes the repeat legs, not the whole build. Fixed routes with mapped paths, reasonably level floors and clear loading docks suit the robot. Crates that need hand lifting, parts that need fitting and final placement at the booth still need people. Plan around the share of moves that repeat, not the total hours on a build.
The table below shows where hours usually sit and how the work changes with a robot. The only hour figure is the 2014 crate example, because no current per-task benchmark for exhibit work was found, so the other rows describe the pattern of work rather than measured time.
What changes the autonomous mobile robot ROI up or down?
Four factors move the number most: the route length, how often the same route repeats, how much freight moves per build, and how well the robot connects to the loading dock and freight elevator. Long repeat routes on clear paths raise the return. Short one-off moves and cramped spaces with heavy foot traffic lower it.
Shows and builds also set the calendar. A shop that builds steadily through the year keeps the robot busy. A shop that works in short spikes must plan for idle time, and the lease quote should reflect that schedule. Work through the checklist below before you decide.
How risky is material moving work for exhibit crews?
Material moving carries real injury exposure. According to the BLS occupational snapshot for Laborers and Freight, Stock, and Material Movers, Hand, the nonfatal incidence rate was 289.8 per 10,000 FTE workers in 2020, with 64,930 cases involving days away from work. Those are 2020 national figures, and BLS has moved nonfatal data to a biennial schedule, so a current rate for this occupation was not located for this page.
The fatal data covers a wider group. According to the BLS Census of Fatal Occupational Injuries, transportation and material moving occupations had 1,391 fatal work injuries in 2024, the most of any occupational group, and a fatality rate of 12.5 per 100,000 FTE, down from 13.6 in 2023. The National Safety Council, summarizing BLS data, counted 805,900 days away, restricted or transferred cases in that group for 2023 to 2024, which it put at 27% of the total.
For a robot, the safety question is how it shares the floor with crew and visitors. Route design, speed settings and clear rules for where people walk decide most of that risk. The robot does not remove the need for safe lifting habits, because the crew still handles the crates the robot does not take.

Where do robots win, and where do people still win?
Robots are strong at the repeat leg. They run the same mapped route in the same way and do not tire. People are better at anything that needs judgment, such as a changed route, a damaged crate or a fitting job at the booth. The comparison below is meant to be fair to both.
The best setup usually pairs them. The robot handles the freight legs between dock, storage and build area, and the crew handles placement, fitting and exceptions. That split also keeps the robot busy without pulling skilled people off booth work.
- Repeat route on a mapped path
Autonomous Mobile Robot
Runs the same route the same way, without breaks
Staff
Walks it well, but tires and loses time to breaks and handoffs
- Unexpected obstacle in the path
Autonomous Mobile Robot
Stops or waits until a person clears the path
Staff
Clears the path, reroutes and reads the floor
- Heavy or awkward loads
Autonomous Mobile Robot
Only within rated payload and a load shape it can carry
Staff
Can lift, tilt and balance odd shapes, within safe limits
- Hours covered in a day
Autonomous Mobile Robot
Runs repeat legs while the crew works elsewhere, within the site plan
Staff
Works set shifts and must be present for each move
- Fitting and placement at the booth
Autonomous Mobile Robot
Not suited to fine placement work
Staff
Places, fits and adjusts components on site
- Layout changes mid-build
Autonomous Mobile Robot
Needs a route update before it can run the new path
Staff
Adapts the same day without setup
What are the risks to the return, and how do you avoid them?
The biggest risk is a route that does not repeat. If the build plan changes every week, the robot spends its time waiting for new maps or human help. Map the routes first, count how many repeat legs they support, and then size the deployment. Starting with one unit on the busiest route is the safest way to test the case.
The second risk is idle time between builds. Lease terms should match the build calendar, and the service plan should name on-site dispatch and remote triage in writing. Ask whether a spare unit covers the busiest weeks, because a unit out of service during move-in leaves the crew back on manual freight.
The third risk is an untrained crew. Staff who do not know the exception steps create stops that look like robot failures. Build training into go-live, and keep one named contact for exceptions during the first builds.
How long from site assessment to payback, and how do you get a precise figure?
The timeline runs in four stages. First, a free site assessment maps the floor, routes, dock and freight elevator, and measures the crew hours on repeat moves. Second, the lease quote is built from those measurements. Third, the robot is deployed and integrated, staff are trained, and go-live support runs through the first builds. Fourth, payback is tracked against the crew log. Payback depends on the route count and the build calendar, so the quote sets the expected date rather than a generic promise.
The wider market supports this kind of deployment. According to A3, as reported by Robotics 24/7, North American robot orders grew 6.6% in 2025, and collaborative robots made up 19.6% of units ordered, 7,212 cobot units for the full year. According to A3, as reported by MDM, orders for the first half of 2025 rose 4.3% versus the first half of 2024, with 17,635 robots ordered. These figures cover all robot types, not AMR orders for exhibit work, so they show market momentum rather than what a shop will earn.
To get a precise figure, bring the last few builds' crew logs, crate weights, route plans and dock details to the free site assessment. The calculator on this page gives the starting range, and the assessment narrows it. The fixed robot lease payment then comes in the written quote, which you can compare directly with the hours the robot takes over.
Frequently asked questions
Want a warehouse robot at your trade show exhibit builder?
Tell us about your site. We will recommend the robot, quote the lease, and keep it serviced.
Sources
- US Bureau of Labor Statistics, Occupational Employment and Wage Statistics (OEWS May 2024)
- CEIR Q4 2024 Index results, via Facilities Online
- 2014 trade blog post on drayage and crate labor
- BLS occupational snapshot, Laborers and Freight, Stock, and Material Movers, Hand
- BLS Census of Fatal Occupational Injuries release
- National Safety Council injury facts, occupational profile
- ONET OnLine occupation trends, 53-7062.00
- Robotics 24/7 on A3 robot orders in 2025
- MDM on A3 first half 2025 robot orders