
The short answer
A cleaning robot ROI in Memphis, TN comes from the janitorial hours a robot takes off the shift, offset by the lease cost and by the share of the floor work it can realistically finish. The return is a range, not a promise, and it moves with floor area, shift length, cleaning frequency and how much detail work stays with staff. A free site assessment replaces those assumptions with your own hours and produces a lease quote for your building.
Key takeaways
- The return comes from floor hours your crew logs, offset by the lease cost and the share of work a robot can finish.
- According to Stacker, citing BLS data as of May 2024, the Memphis area had 400 janitors and cleaners, excluding maids.
- Route coverage and the detail work that stays with staff decide the number more than the robot itself.
- Replace published case study hours with your own shift logs and a free site assessment before deciding.
Run the numbers for your site
Auto-detected from your location - we use the real BLS wage here. Not right? Pick your city or state above.
What do you want to automate?
The robot runs the open floor overnight; your crew keeps detail and edges.
What return can a Memphis business expect from a cleaning robot?
The return on a cleaning robot ROI in Memphis, TN comes from janitorial hours. A scrubber that runs a mapped route overnight takes over repeat floor work that a crew would otherwise do on a shift. The saving is the value of those hours, offset by the lease cost and by the share of the work the robot can actually finish.
The government wage data on this page gives the local wage for this job, which is the rate we use to put a value on those hours. Use it with your own schedule, not against a generic benchmark. The hours that matter are the ones your crew logs on open floor work.
This page does not promise a number. It explains the inputs, shows where the hour figures come from, and points to the step that produces a real estimate for your building. The savings range on the calculator is built from those inputs and will change once measured hours replace assumptions.
Why does local labor matter for cleaning robot ROI in Memphis?
Memphis has a meaningful base of cleaning labor, but it is spread across many small employers. According to Stacker, citing BLS data as of May 2024, the Memphis area had 400 janitors and cleaners, excluding maids, or 0.65 per 1,000 area jobs. Stacker is a secondary aggregator rather than an official BLS table, so use that count as a sizing check, not a headcount for your site.
Small employers are the norm in this sector. According to Mewayz industry data, about 67,799 janitorial establishments with paid employees existed in 2023, up from 62,592 in 2019, and about 61% of them have 1 to 4 employees. A site run by a small contractor often has only a few people on floor work, so each departure leaves a gap that takes time to fill.
Nationally, the occupation is large and steady. According to the BLS Occupational Outlook Handbook, about 2,447,700 janitors and building cleaners held jobs in 2024, with projected growth of 47,800 jobs (2%) from 2024 to 2034, which is slower than the average for all occupations. The same source projects about 351,300 openings a year, mostly from replacement of workers who leave.
Turnover matters more than growth here. Replacement drives most openings, so a site that depends on a few janitors feels every resignation as lost hours plus training time. A robot does not resign, and its route runs the same way on a holiday as on a weekday.
Median hourly wage, Janitors and Building Cleaners
$3,552
Monthly cost of one full-time worker in Memphis, TN, at the median wage plus payroll costs (an estimate, not a quote).
How does the payback math work?
The core calculation has three parts. Start with the hours of floor work your crew logs each week. Convert those hours to the local wage for this job, and count only the share a robot can realistically take. Then subtract the fixed lease payment and any staff time that still has to be done by people.
The share is where estimates go wrong. A robot covers open floor surfaces on a mapped route, so a warehouse aisle or a long corridor counts for more than a lobby crowded with furniture or a restroom. We measure route coverage on site rather than assume a percentage, and we flag any zone the robot cannot reach.
Lease cost is quoted after the assessment, so the calculator uses a placeholder until then. A fixed lease payment, with maintenance included, keeps the cost predictable from one period to the next, which matters when you compare it with a schedule that changes. Count downtime too. If a unit stops mid-shift, dispatch and backup coverage decide whether the floor still gets done.
How many hours does a cleaning robot take off the shift?
Published hour figures are useful for direction and weak for precision. A 2023 hospital case study from a robot vendor reported that two floor technicians spent 8 or more hours scrubbing and dry mopping a 50,000 sq. ft. area, and that total manhours per night fell from 16 to 5 after deployment. That is roughly 11 of 16 hours, but it reflects one hospital, one floor plan and the vendor's own measurements.
Other vendor-reported results point the same way without settling the question. A grocery retailer case study reports 33,649 hours saved cumulatively across stores in 2024. A logistics case study reported in a trade publication cites more than 300 labor hours saved between summer 2020 and April 2021 compared with conventional cleaning. Neither is an independent study, and neither describes your floor.
Treat these as sanity checks. Ask for one week of your own shift logs, walk the route with a supervisor, and record the hours by task. That record is the only input that tells you how much of your crew's floor time a robot can take.
| Task | Today | With a robot |
|---|---|---|
| Scrub open corridors and aisles | hours logged on your shift sheet | scheduled route, with a staff check at start and end |
| Dry mop and sweep large open floors | crew time per night from your logs | scheduled sweep route, minimal staff time |
| Detail work: edges, corners, tight spots | staff time, unchanged | still done by staff |
| Restrooms, break rooms and entrances | staff time, unchanged | still done by staff |
| Route checks and shift reporting | supervisor time | route report and incident log reviewed by staff |
Hour figures for your site come from shift logs and the site assessment. Published case study figures on this page are vendor-reported or secondary and were not measured on your floor.
What raises or lowers the savings range?
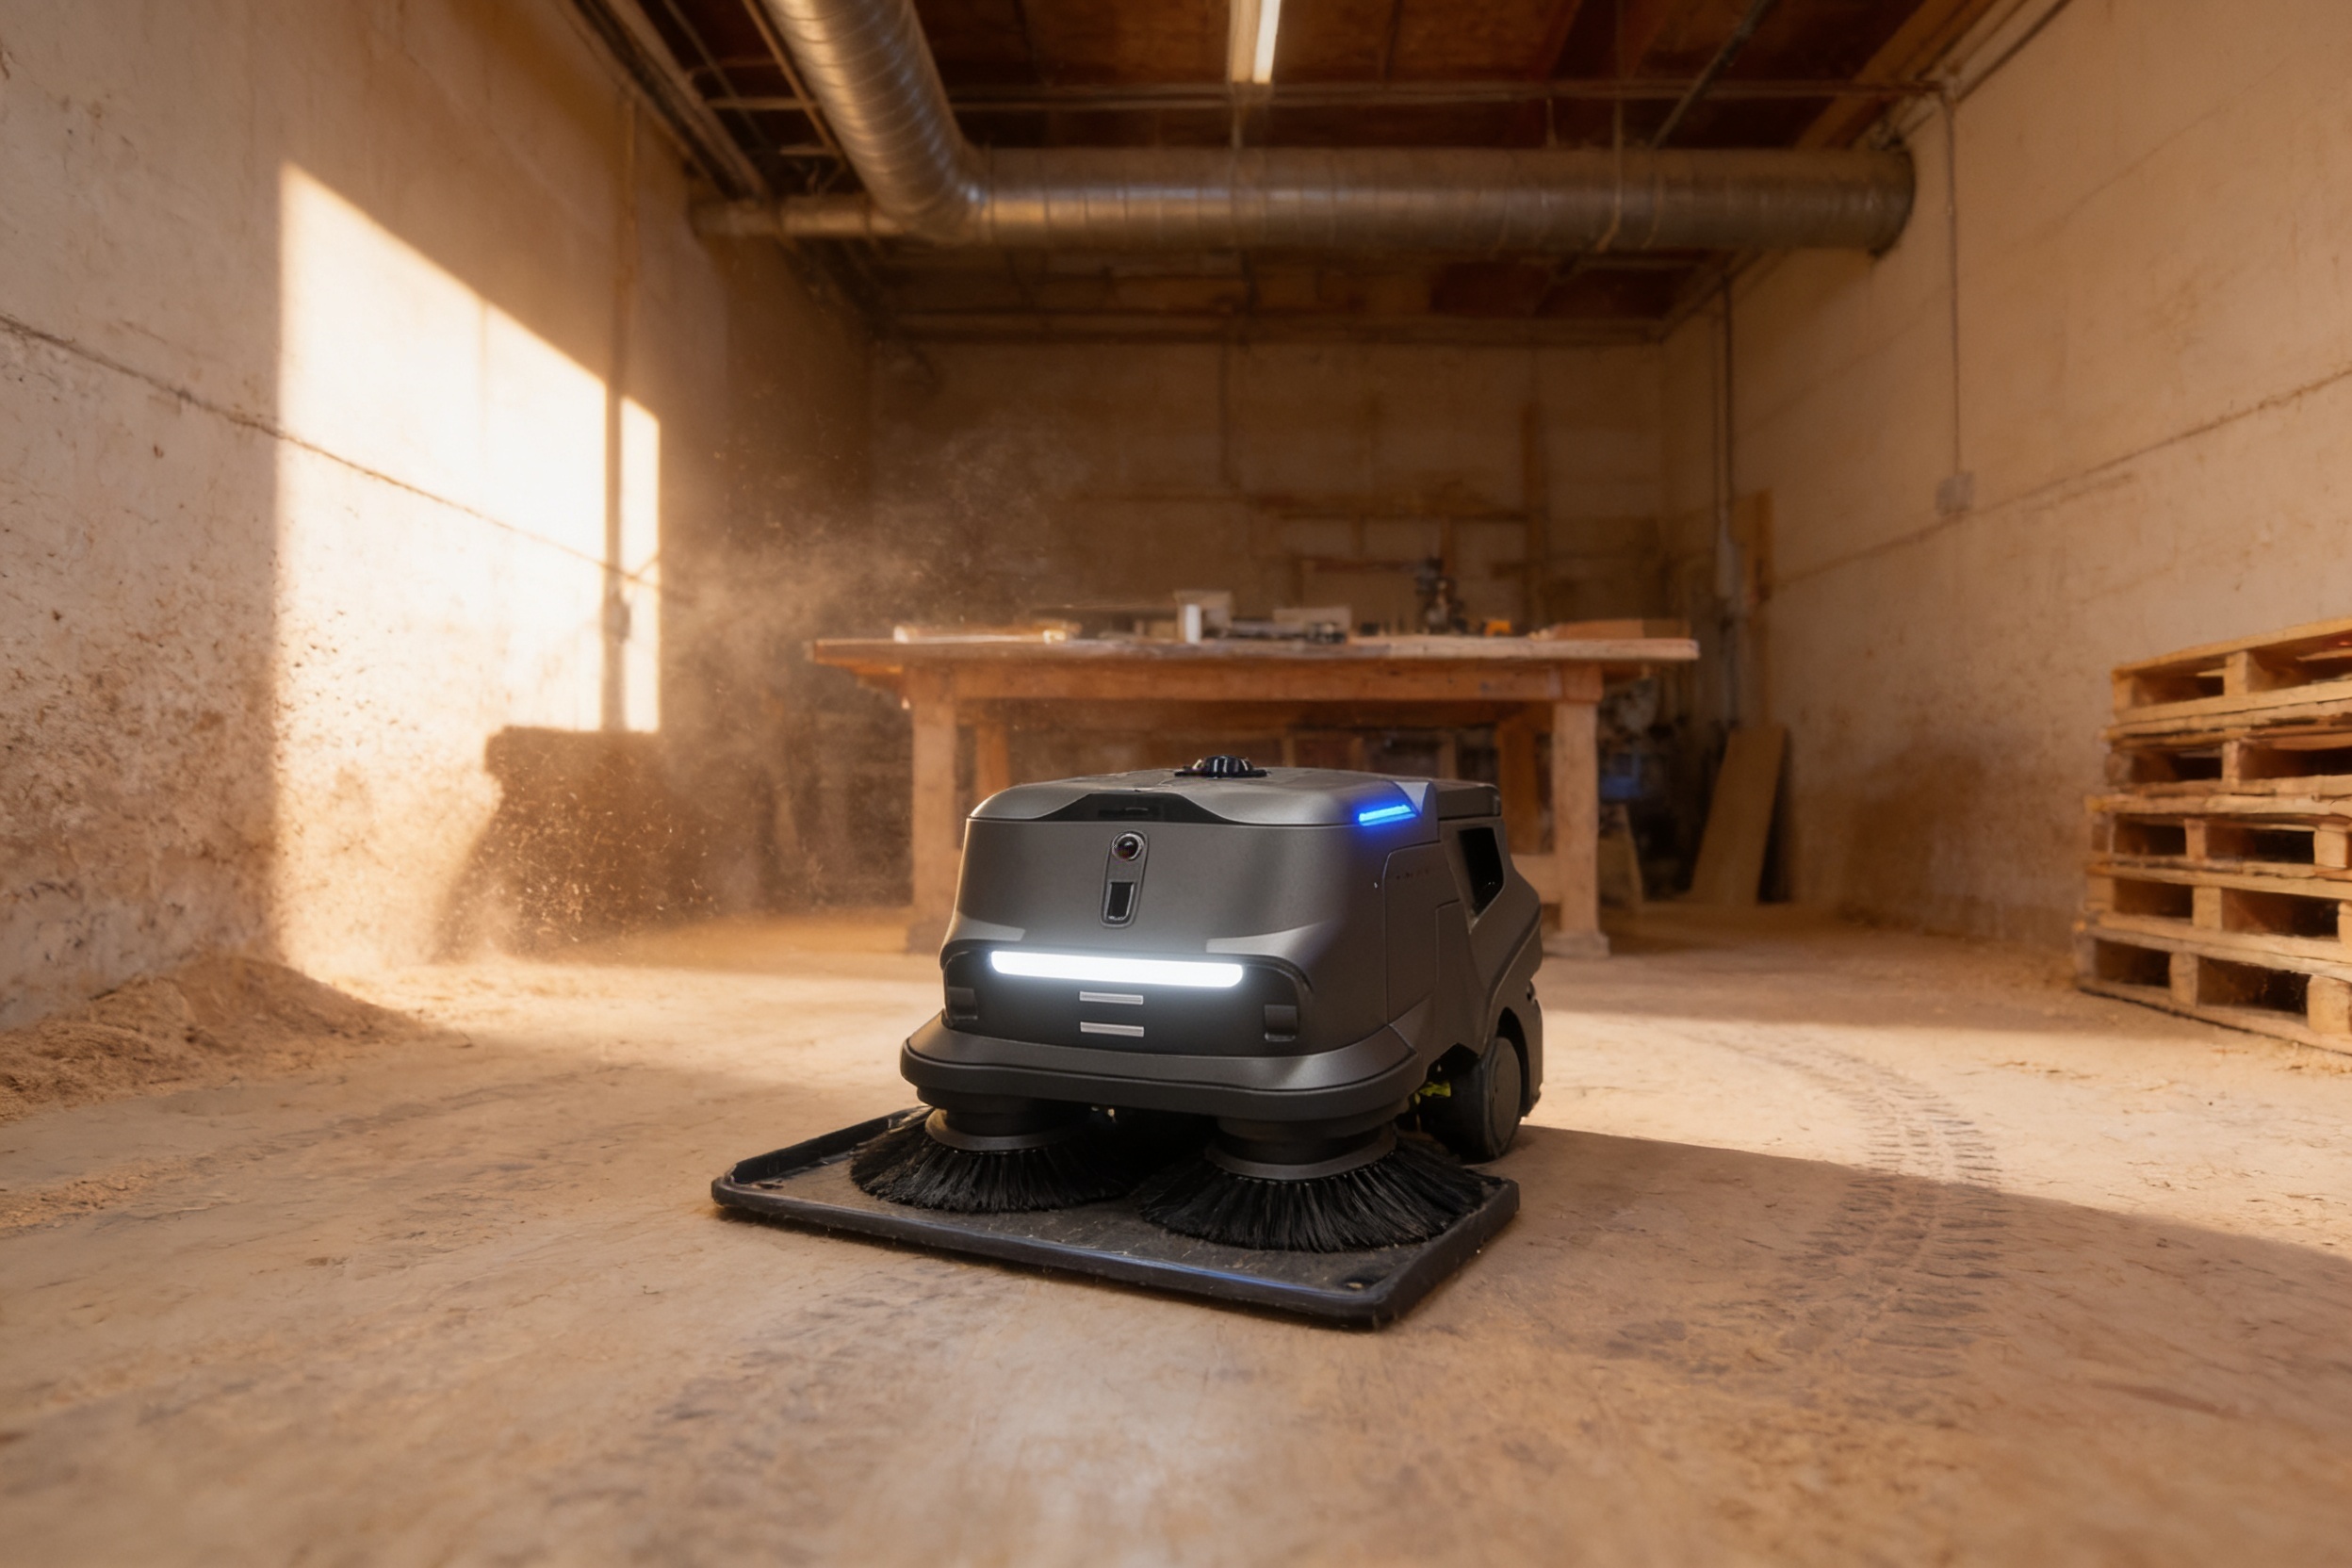
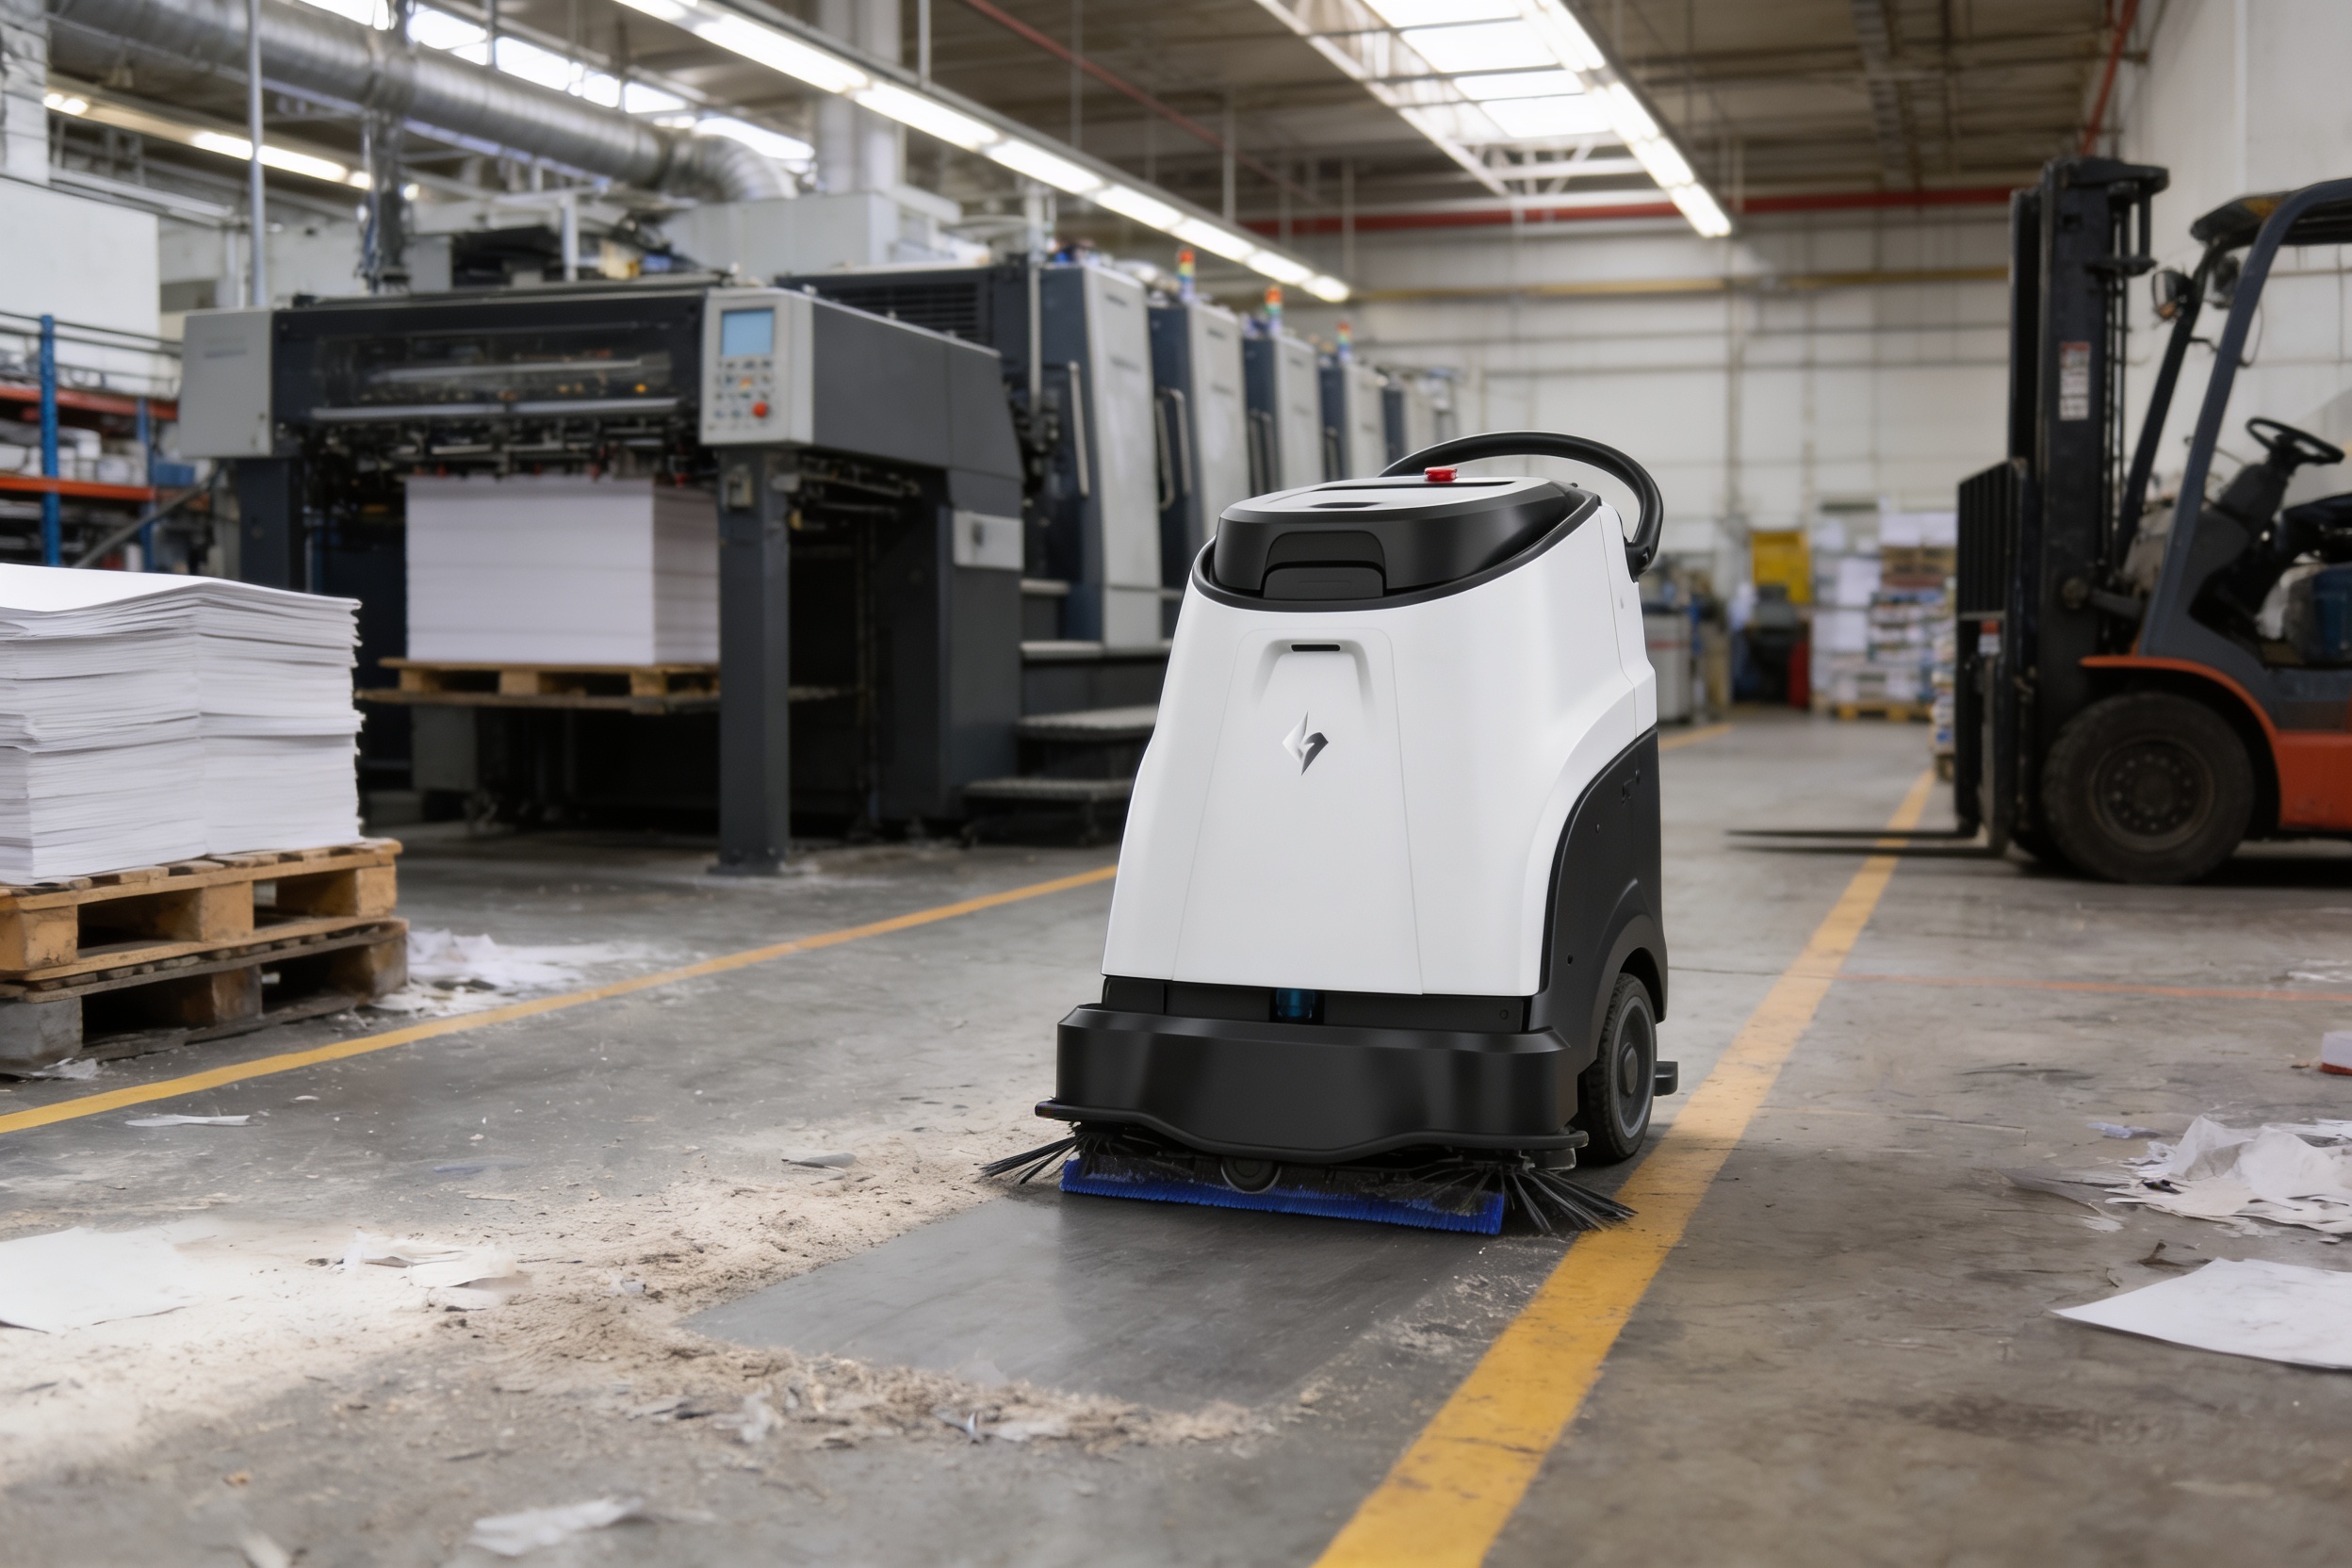
Floor area and route shape move the number most. Large open floors with few obstacles suit a scheduled route. A site with many small rooms, racks at varying heights or heavy foot traffic at night takes longer to map and covers less of the floor in each pass.
Shift length matters too. A robot that runs through the overnight window replaces staffed hours that would otherwise sit on the schedule. A short route that runs once a week replaces far less.
The mix of work matters. If your crew spends most of its time on open floor passes, the offset is large. If most of its time goes to edges, restrooms and spills, the robot takes a smaller share and the return shrinks. Cleaning frequency also changes the value, since a floor cleaned nightly absorbs more route time than one cleaned for a single event.
What are the risks to the return, and how do you avoid them?
The biggest risk to the return is overestimating the share of work the robot can finish. If the route is blocked on a regular basis, the crew ends up cleaning the same floor twice and the saving disappears. Map the route, clear the path where you can, and agree the covered zones in writing before signing.
Safety is the second area. According to the BLS injury and illness snapshot for 2016 to 2020, janitors and cleaners except maids and housekeeping cleaners recorded 21,100 nonfatal injury and illness cases with days away from work in 2020, and 42 fatal work injuries that year. The incidence rate rose from 157.4 per 10,000 full-time equivalent workers in 2019 to 191.6 in 2020.
Repetitive floor passes are the work most likely to move to a robot, but staff still handle spills, chemicals and detail work, which carries most of the hazard. A secondary source, WageDex, reports 3.5 injuries per 100 workers for this occupation, and we have not checked that figure against the original BLS table. Measure the return with the hazardous work still staffed, so the savings estimate does not depend on a shortfall in coverage.
Where do people still beat a robot?
A robot is not a straight swap for a person. The honest comparison shows where people still win, and most sites keep staff for those tasks.
Most sites keep a smaller crew after deployment, focused on detail work, restrooms, spills and checks, while the robot takes the repeat floor passes. That split is what the hours table on this page assumes.
- Repeat floor passes at night
Cleaning Robot
Runs the same mapped route each shift without breaks
Staff
Can do it, but needs breaks and a shift schedule
- Edges, corners and tight spots
Cleaning Robot
Limited to mapped, reachable surfaces
Staff
Handles corners, edges and cluttered spots well
- Spills and unexpected hazards
Cleaning Robot
Needs a person to respond on site
Staff
Responds on site and makes judgment calls
- Restrooms and high-touch surfaces
Cleaning Robot
Not its job
Staff
Does this work every shift
- Staffing changes
Cleaning Robot
No turnover to train around
Staff
Openings come from turnover, which takes time to fill
- Weekend and holiday coverage
Cleaning Robot
Scheduled regardless of the calendar
Staff
Depends on the rota and who is available
What is the timeline from assessment to payback?
A realistic timeline runs in stages. The site assessment comes first. Then the unit is selected for the floor, the route is mapped and tested, staff are trained, and the first weeks run with close checks. Payback depends on when the route reaches stable full coverage, not on the install date.
Plan the first weeks as a test. Compare the logged hours with the estimate each week, and adjust the route, zones and schedule before judging the return. A test period gives you a basis for that decision instead of an argument about the estimate.
After go-live, service decides how much of the savings holds. Remote triage and on-site dispatch keep stoppages short, and backup coverage is what keeps a night shift on track when a unit goes down.
How do you get a precise figure from a free site assessment?

A free site assessment turns the calculator range into an estimate for your building. We measure open floor area, map a candidate route, time the current crew by task and confirm overnight access. The lease is quoted after that assessment, and maintenance is included in the quote.
Ask the quote to show four things: the hours offset by task, the share of the route covered, the lease cost and the result if the route is stopped for a week. Compare it with your own shift logs, not with a sector average. Many sites start with one leased unit and expand once the numbers hold.
Our team selects the unit for your floor, leases it through financing, deploys and integrates it, trains staff and services it nationwide. The assessment is the place to test the fit before any commitment.
Frequently asked questions
Put a robot to work in Memphis.
We walk your site, learn the job, and recommend the unit that fits. Then we quote the lease, deploy it, and keep it serviced.
Sources
- US Bureau of Labor Statistics, Occupational Employment and Wage Statistics (OEWS May 2024)
- BLS Occupational Outlook Handbook: Janitors and Building Cleaners
- BLS injury and illness snapshot: Janitors and Cleaners, 2016 to 2020
- Stacker: lowest paying jobs in Memphis
- Mewayz: janitorial services industry data
- WageDex: janitors and cleaners