
The short answer
Cobot ROI for tortilla plants comes mainly from taking repetitive stacking and case packing hours off the line, so trained staff can cover the harder packing and quality work. The savings range depends on how many of those hours a robot can realistically take, the fixed lease payment, and how often the line stops for changeovers. A free site assessment is the only way to get a range that fits your plant.
Key takeaways
- The return comes from repetitive stacking and case packing hours, with staff kept on the work that needs judgment.
- Savings are ranges, and the share of work a robot can realistically take moves the number more than anything else.
- Strain on packing stations is a real cost, so injury data belongs in the case, but it should not be the whole case.
- The lease quote follows a free site assessment that measures your hours instead of estimating them.
Run the numbers for your site
Pick your city or state for a real regional number - we use the real BLS wage there. (On the live site this auto-detects from your location.)
What do you want to automate?
The cobot stacks the repetitive end-of-line pallets; your team handles changeover and QA.
What is cobot ROI for tortilla plants?
Cobot ROI for tortilla plants is the return a plant gets when a collaborative robot works beside its packing staff. It is measured as labor hours taken off the line, set against the fixed lease payment and the cost of running the cell. You can estimate it before any robot arrives, but only with your own line data.
The industry has many businesses, but the plant is the unit that matters for a packing cell. IBISWorld estimates 1,571 tortilla manufacturing businesses in the US as of 2026, and it counts businesses, not plants. A data summary of NAICS 31183, with the year not stated, lists 389 firms and 429 establishments. A trade article dated April 30, 2026 counts 21 plants in one large producer's tortilla and related products division.
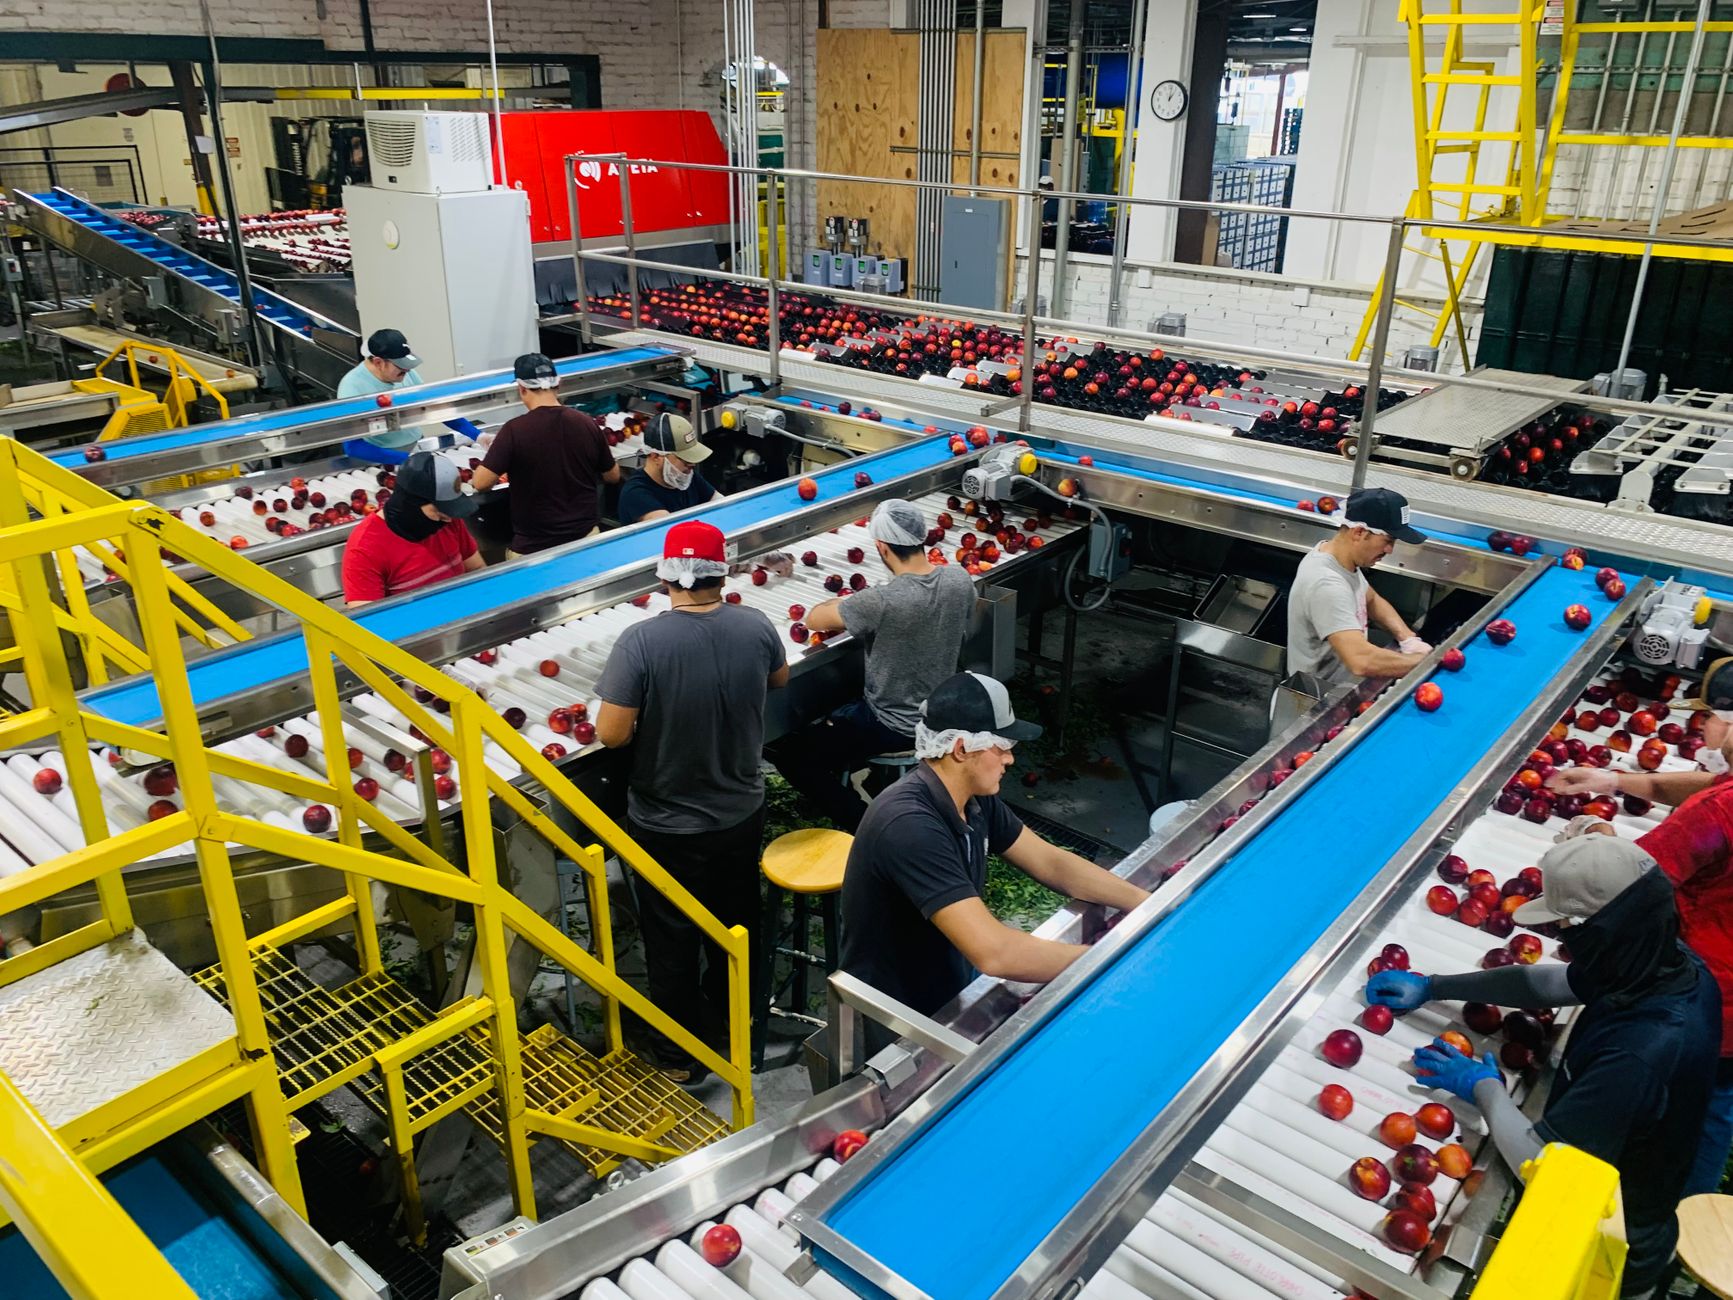
For a robot decision, the useful unit is the packing line. A single plant can run several lines, and the same stacking and case packing job repeats at the end of each one. Repetition is what makes that work a candidate for a cobot, and the rest of this page explains how to test it.
How many people work on tortilla packing lines?
Staffing is the starting point. Census figures for NAICS 311830 from 2002, summarized by Encyclopedia.com, show about 42 employees and about 30 production workers per establishment. The data is more than two decades old, so read it as a rough picture of plant size rather than a current staffing level.
The packing crew is a share of that total. Stacking and case packing happen at specific stations on each line, so a cell changes one part of the floor rather than all of it. That is why a cobot can be added beside the people already there.
Turnover is what makes the staffing question hard. An open station does not stay open on paper, because someone has to cover it, and covering it costs overtime, slower line speed or a shorter-staffed shift. The next section covers the turnover figures.
Median hourly wage, Laborers and Freight, Stock, and Material Movers, Hand
$4,380
Monthly cost of one full-time worker, at the median wage plus payroll costs (an estimate, not a quote).
Where does the return come from?
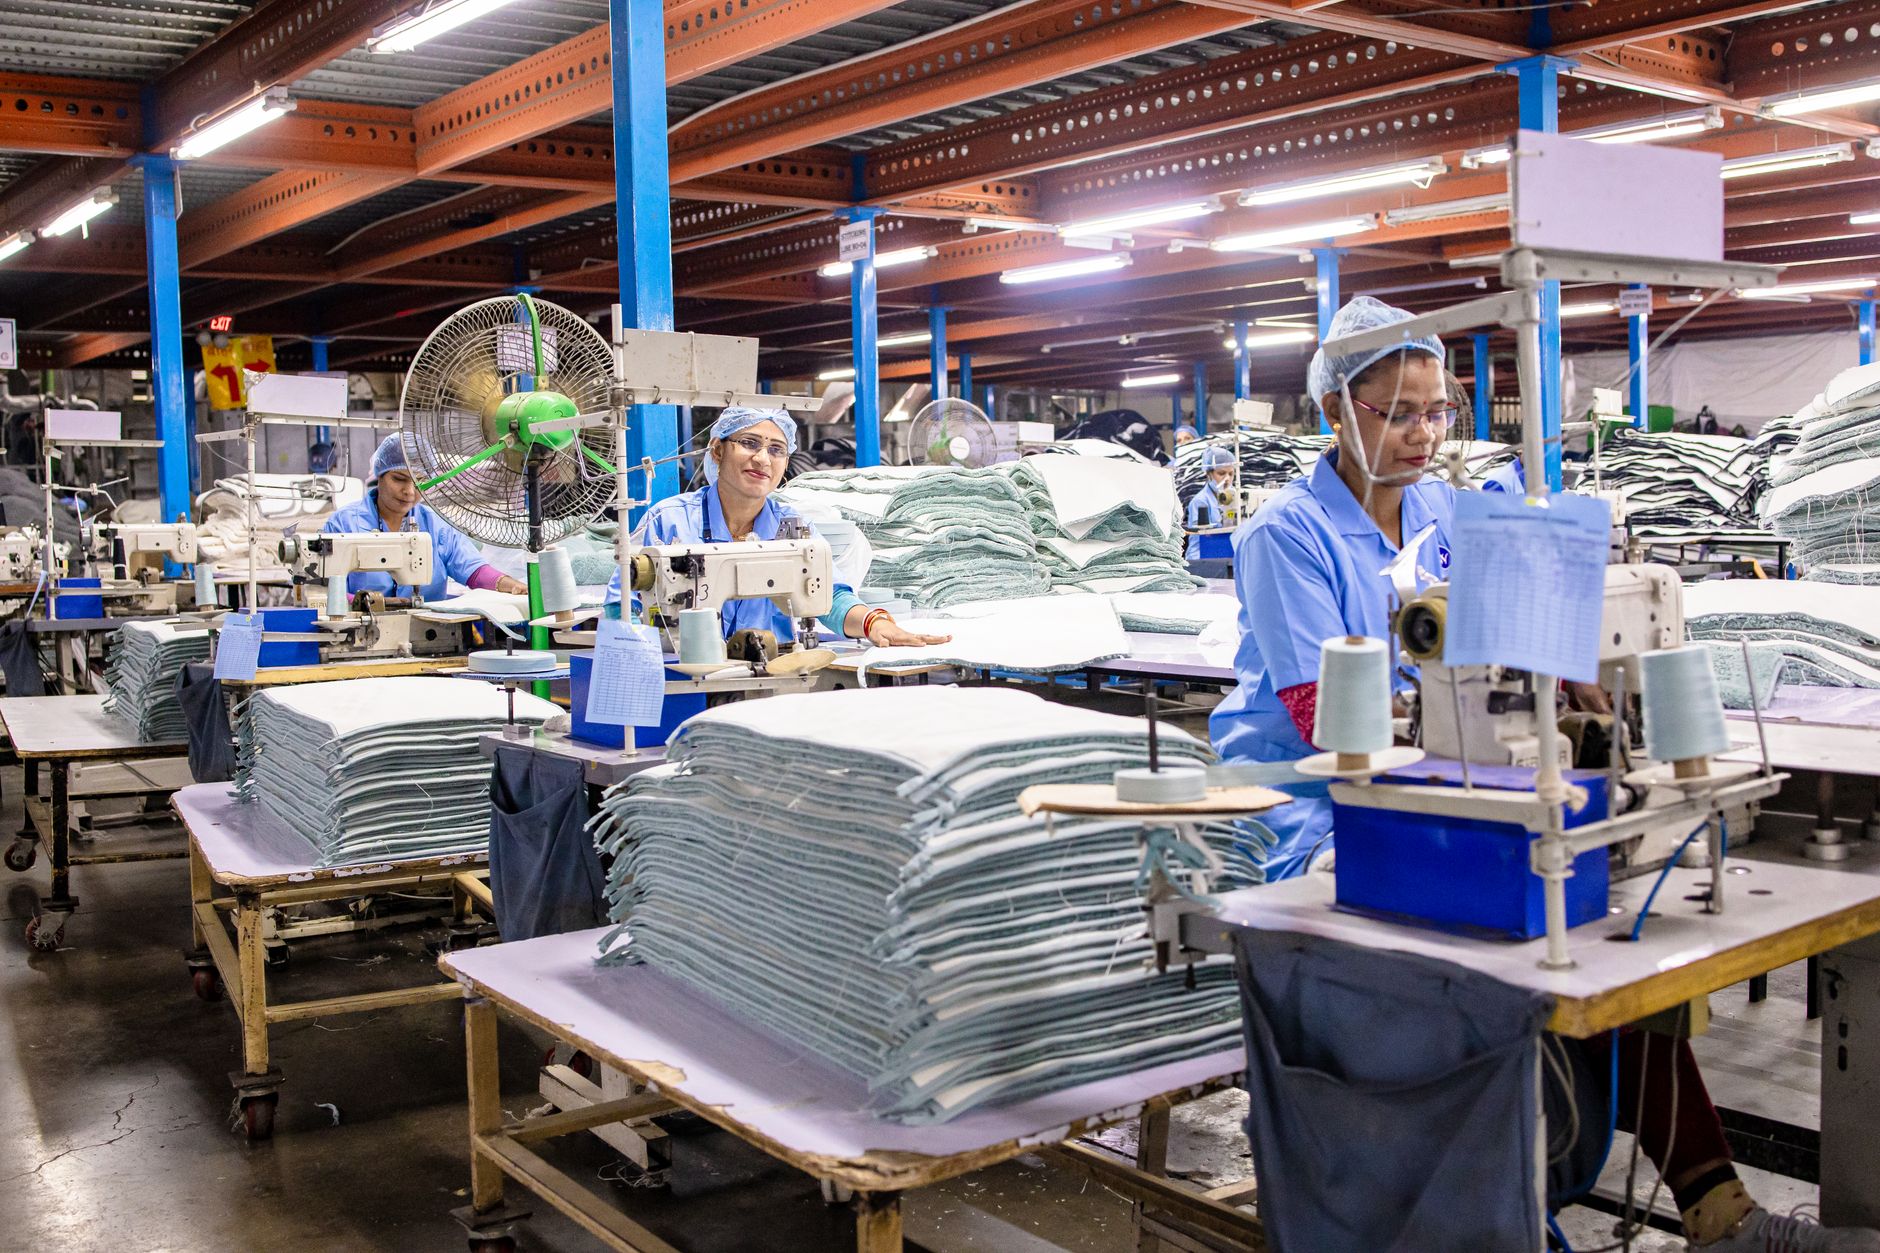
The return comes from three places: labor hours the robot takes over, fewer open stations and less overtime, and less recruiting and onboarding. The labor hours are priced at the government wage data on this page for Laborers and Freight, Stock, and Material Movers, Hand, which is the work a robot takes over at a stacking or packing station.
Turnover is why open stations keep coming back. According to a 2025 manufacturing jobs report summary that cites BLS data, monthly separations ran at 2.4 percent, which the summary annualizes to about 29 percent a year. Each departure restarts recruiting, onboarding and training, and the hours a robot takes over do not depend on filling that seat.
Strain is a real cost, though harder to price. According to a Food Safety News summary of BLS data, food manufacturing had 3.3 total injury cases per 100 full-time workers in 2024, and seafood product preparation and packaging had 5.0, the highest subsector rate that summary lists. Those are industry rates, not tortilla rates, and no tortilla-specific repetitive-motion figure was found, so injury reduction is a bonus to the hours math rather than its core.
How does the lease math work?
The math has a simple form. Take the labor hours per shift that the robot takes over, price them at the government wage data on this page, add the turnover and overtime costs you can measure, then subtract the fixed lease payment, service coverage and the cost of running the cell. The result is a savings range, and the range narrows as the line data firms up.
Leasing changes the timing of the cost, not the logic of the return. Lease financing spreads the cost across a fixed lease payment, so the plant does not carry a large upfront outlay. The lease quote is given after a site assessment, because the payment depends on the cell layout, the floor work and the service scope.
Hours offset is the number to check first. A robot that takes a small share of one station is worth a very different range than one that covers most of the station's hours. The site assessment measures this from timing studies and shift records instead of estimates, and every input is written down so the range can be checked.
- Pace on repeated placements
Cobot
Holds one pace through the shift once set up correctly
Staff
Varies with the person and the hour, and slows with fatigue
- Fatigue over a long shift
Cobot
Does not tire from the repeated motion
Staff
Tires, which is why people rotate stations to limit strain
- Switching to a new pack pattern
Cobot
Needs reprogramming or a gripper change, so changeovers take planning
Staff
Adapts quickly to a new format without programming
- Judgment on defective or off-shape product
Cobot
Limited, since it follows programmed picks and needs staff to judge defects
Staff
Strong, since people spot defects and handle odd product
- Exposure to turnover
Cobot
Lower, because the cell's hours do not depend on filling a particular seat
Staff
Each departure means recruiting, onboarding and training
- Covering a short shift
Cobot
Keeps its share running when staff are present to supervise
Staff
Can cover a short shift if people are available to do it
What changes the number up or down?
Five things move the range most: the share of repetitive work, line speed, how often formats change, the shift pattern, and uptime. A steady format on long runs pushes the range up. Frequent changeovers on a slow line pull it down, even when labor costs are the same.
Industry adoption shows that the cell design is proven, though it does not set your number. According to the International Federation of Robotics, US food processing reported a 30 percent surge in robot adoption, about 3,000 installations, for 2025, per its 2026 release. Peer adoption is a signal, not a forecast for your station.
Packaging is moving the same way. According to PMMI, as reported in Food Engineering in December 2025, cobot adoption in packaging automation is expected to double by 2027. Faster adoption means more plants will have working cells to learn from, but your own line still sets the number.
What are the risks to the return and how do you avoid them?
The main risk is downtime. A cell stopped while waiting for a part or a technician removes the hours it was meant to take, and the staff still need to be on shift. Service response is part of the return, so check the dispatch and remote triage plan before signing anything.
The second risk is under-use. A robot placed on a station that changes formats every week, or fed by an unsteady infeed, will show a smaller range than the plan. The fix is a site assessment that measures the share first, then a pilot with one leased unit before scaling to a second cell.
The third risk is the crew. Staff who understand what the robot does, and what they still own, keep the cell running. Train them before go-live, keep the same people on exception handling, and make sure supervisors know how to pause the cell safely.
What is the realistic timeline to payback?
A realistic timeline moves through stages: site assessment and mapping, a lease quote, integration and deployment at the station, staff training, go-live support, then measured results. Each stage depends on the floor and the line, so the assessment sets the schedule instead of a generic calendar.
Payback is measured, not assumed. After go-live, the plant logs the hours the robot takes and compares them with the assessment. If the hours match, the payback point lands inside the savings range. If the robot takes fewer hours than planned, the number moves, and the plant should know early.
Plan for a phased start. Starting with one leased unit lets the plant test the share, the changeover process and the service response on one station before adding a second cell. That keeps the return visible and the exposure limited while the numbers settle.
How do you get a precise figure from a free site assessment?
A free site assessment turns this page into your number. We are a commercial robot integrator. We pick the right robot for your site, lease it through financing, deploy and integrate it, train your staff and service it nationwide. The assessment starts with mapping the station and timing the stacking and packing work.
We pull shift and overtime records for the station, check line speed and changeover patterns, and measure the share of work that repeats. The labor side is priced at the government wage data on this page, and the lease quote follows the site survey, so the quote matches the cell that will actually be built.
You get a savings range with the assumptions written out, so finance and operations leads can check each input. When an input changes, the range moves, and the written assumptions show which ones matter most. A precise figure needs your floor, your schedule and your line data, and the assessment collects all three.
Frequently asked questions
Want a cobot at your tortilla plant?
Tell us about your site. We will recommend the robot, quote the lease, and keep it serviced.
Sources
- US Bureau of Labor Statistics, Occupational Employment and Wage Statistics (OEWS May 2024)
- IBISWorld, tortilla manufacturing businesses in the United States
- NAICS 31183 industry data summary
- Trade article dated April 30, 2026
- Census data for NAICS 311830, summarized by Encyclopedia.com
- Food Safety News summary of BLS injury data, 2024
- 2025 manufacturing jobs report summary citing BLS data
- International Federation of Robotics, 2026 US robot industry release
- Food Engineering, December 2025, citing PMMI