
The short answer
Cobot ROI in Denver comes from the repetitive hours a collaborative robot arm takes off the work of laborers and freight, stock, and material movers, hand, measured against the lease cost. The savings range is an estimate built from measured task hours, the share of the work the robot realistically handles, and the local wage for that job, not a promise. A free site assessment turns that estimate into a lease quote and a payback range for the specific site.
Key takeaways
- The return comes from repetitive hours of laborers and freight, stock, and material movers, hand type of work, offset by the share the arm realistically takes.
- Savings are ranges built from measured task hours, a realistic share, the local wage for the job, and the lease quote.
- High warehouse injury rates make repetitive loads a safety case as well as a labor case, if the site's own logs confirm it.
- A free site assessment is the route to a precise lease quote and payback range for your floor.
Run the numbers for your site
Auto-detected from your location - we use the real BLS wage here. Not right? Pick your city or state above.
What do you want to automate?
The cobot stacks the repetitive end-of-line pallets; your team handles changeover and QA.
What is cobot ROI in Denver and where does the return come from?
Cobot ROI in Denver is the labor return from putting a collaborative robot arm on work that people do by hand and repeat through a shift. The return comes from labor hours the arm takes over, priced in the hours of laborers and freight, stock, and material movers, hand type of work. It does not come from one headline saving, because the arm takes a share of those hours, not all of them.
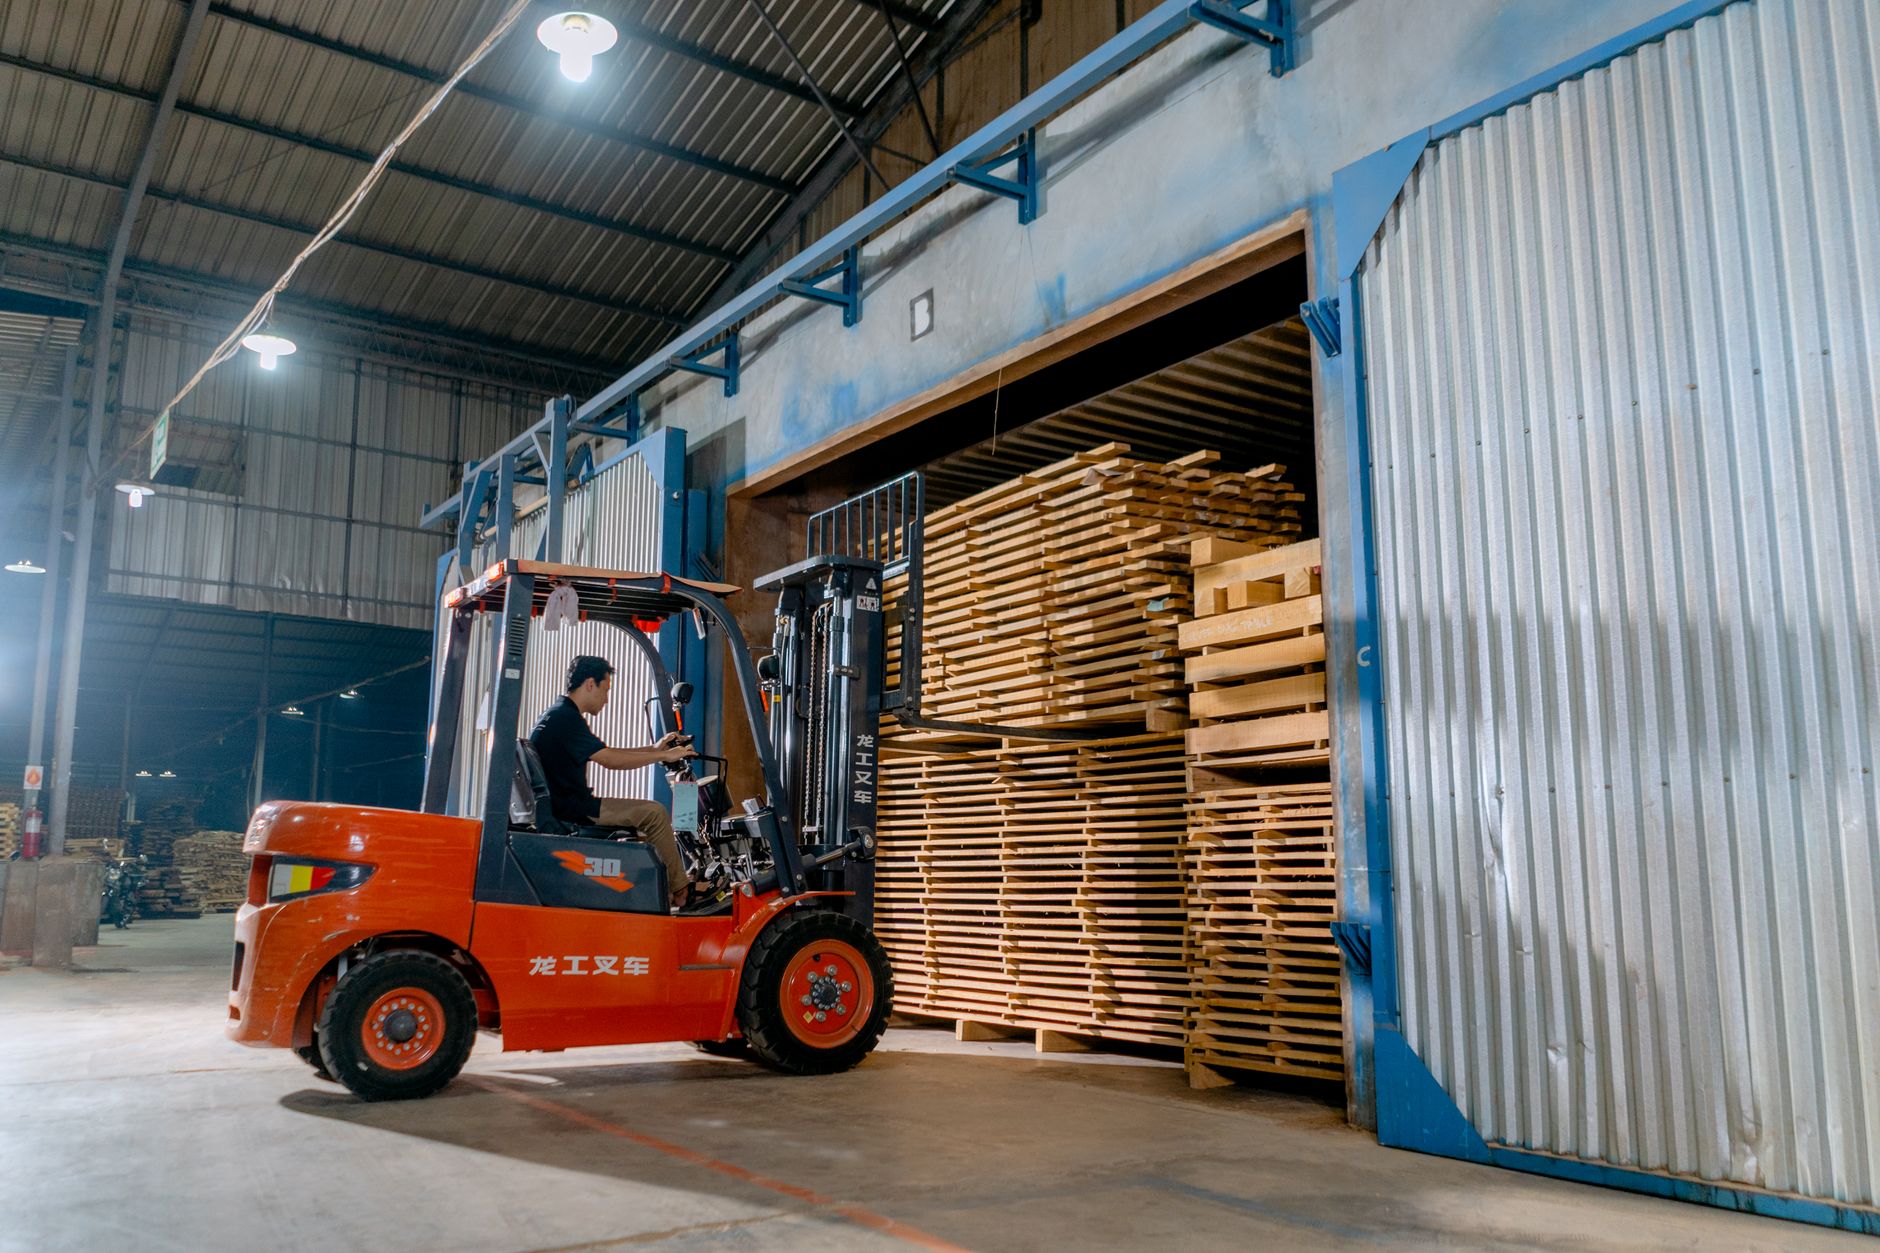
In Denver the usual sites for this are light manufacturing, packaging lines, and distribution staging. The same pick, place, stack, or load task repeats for hours. Where the task is one motion repeated for hours, the split between arm and staff is clean. Where the mix of motions changes every hour, the return is harder to predict and the assessment will say so.
Service Robot Co. is a US commercial robot integrator. We choose the arm for the site, lease it through financing, deploy and integrate it, train staff, and service it nationwide. The calculator on this page is pre-filled for Denver, and its output is a range, not a promise.
How large is the pool of people doing this work?
The occupation is large. According to the BLS Occupational Outlook Handbook, about 3.0 million people held hand laborers and material movers jobs in 2023, a detailed count of 3,004,800. O*NET reports 2,988,900 people employed in 2024, with 3,033,100 projected for 2034, which points to a pool that is holding steady.
Published counts differ by method, so read the national totals as scale rather than a Denver count. A Denver figure for this occupation was not verified for this page, and the number of people on a given line is counted during the site assessment, not taken from a regional average. The government wage data panel beside this text shows the local wage for this job, the rate the savings math uses.
Cobot adoption is growing alongside that labor pool. The International Federation of Robotics reports 66,000 new cobot installations in 2025 in preliminary figures, 11 percent of all industrial robot installations. More sites running these arms means the question for a given site is less whether the equipment works and more whether one specific task pays back.
Median hourly wage, Laborers and Freight, Stock, and Material Movers, Hand
$5,141
Monthly cost of one full-time worker in Denver, CO, at the median wage plus payroll costs (an estimate, not a quote).
What does the local wage change in the math?
The savings side is priced on the wage for laborers and freight, stock, and material movers, hand. The panel on this page shows the government wage data for that job in the Denver area from the May 2024 OEWS estimates. Only the hours of that kind of work are priced. If the people who mainly work the line hold another job, such as machine operator or shift lead, the arm takes the laborers and freight, stock, and material movers, hand type of work off their plate, and their own time is not priced here.
The labor hours offset is the central number. Take the hours per week that the repetitive task consumes, then multiply by the share the arm realistically handles. An arm that runs a palletizing cycle all shift but needs a person for every irregular load offsets less than the raw hours suggest, and the table below shows how that split is recorded.
The lease cost sits on the other side of the math. The lease is a fixed robot lease payment through financing, and the payment is quoted after a site assessment. The savings range is the value of the offset hours minus the lease and the service terms, shown as a band because the share and the hours both vary.
| Task | Today | With a robot |
|---|---|---|
| Stack cases onto pallets | logged from the site time log, by shift | arm takes the repeat stacking; staff handle irregular loads |
| Feed parts to a machine | logged from the site time log, by cycle | arm loads each cycle; staff clear jams and check parts |
| Pack finished items into cartons | logged from the site time log, by line | arm handles the repeat placement; staff run quality checks |
| Move staged loads to outbound lanes | logged from the site time log, by shift | staff set up the cell and clear exceptions |
No published hour figures for these tasks were verified for this page. The today column is filled from the site's own time log during the free assessment, and the withRobot column names the work that stays with people.
How does the savings math work, step by step?
Start with measured hours. Log the repetitive task for several shifts: minutes per cycle, cycles per shift, shifts per week. Use the site's own time, not a guess drawn from a job title, because the base is what everything else multiplies.
Next apply a realistic share. An arm rarely takes a whole task. It takes the repeat motion, while people keep the exceptions, jam clearing, quality checks, and changeovers. A conservative share keeps the range honest. Multiply the base hours by that share and by the local wage for the job, then subtract the lease and service terms.
Read the output as a band, low to high. The calculator returns a range because every input is a range, and a single number should prompt the question of which share produced it. Plan around the low end first, because a planning decision should still hold when the share comes in below expectations.
Do injury rates and turnover change the return?
Warehouse work carries high injury rates. According to an industry analysis of distribution center safety statistics citing BLS, warehousing and storage recorded 4.8 total recordable cases per 100 full-time workers in 2024, against 2.6 for all industries on the same page. GAO-24-106413 found that transportation and warehousing had the highest serious injury and illness rate of all 19 sectors reviewed for 2022, an estimated 3.8 per 100 workers.
These rates make repetitive lifting a risk to manage, and an arm that takes the most repetitive loads can reduce exposure on those tasks. The claim should still be checked against the site's own incident log, not assumed from a sector average. Ask the safety lead which tasks produce the most recordable incidents, and map those first.
Turnover works the other way. The BLS JOLTS annual release summary reports an economy-wide total separations rate of 3.3 percent for 2025. A sector quits rate was not verified for this page, so do not assume your turnover matches the economy. Each departure costs training time that lowers the output of the crew, and an arm in a fixed cell keeps the same pace through the shift.
Where does a cobot work on a Denver site?
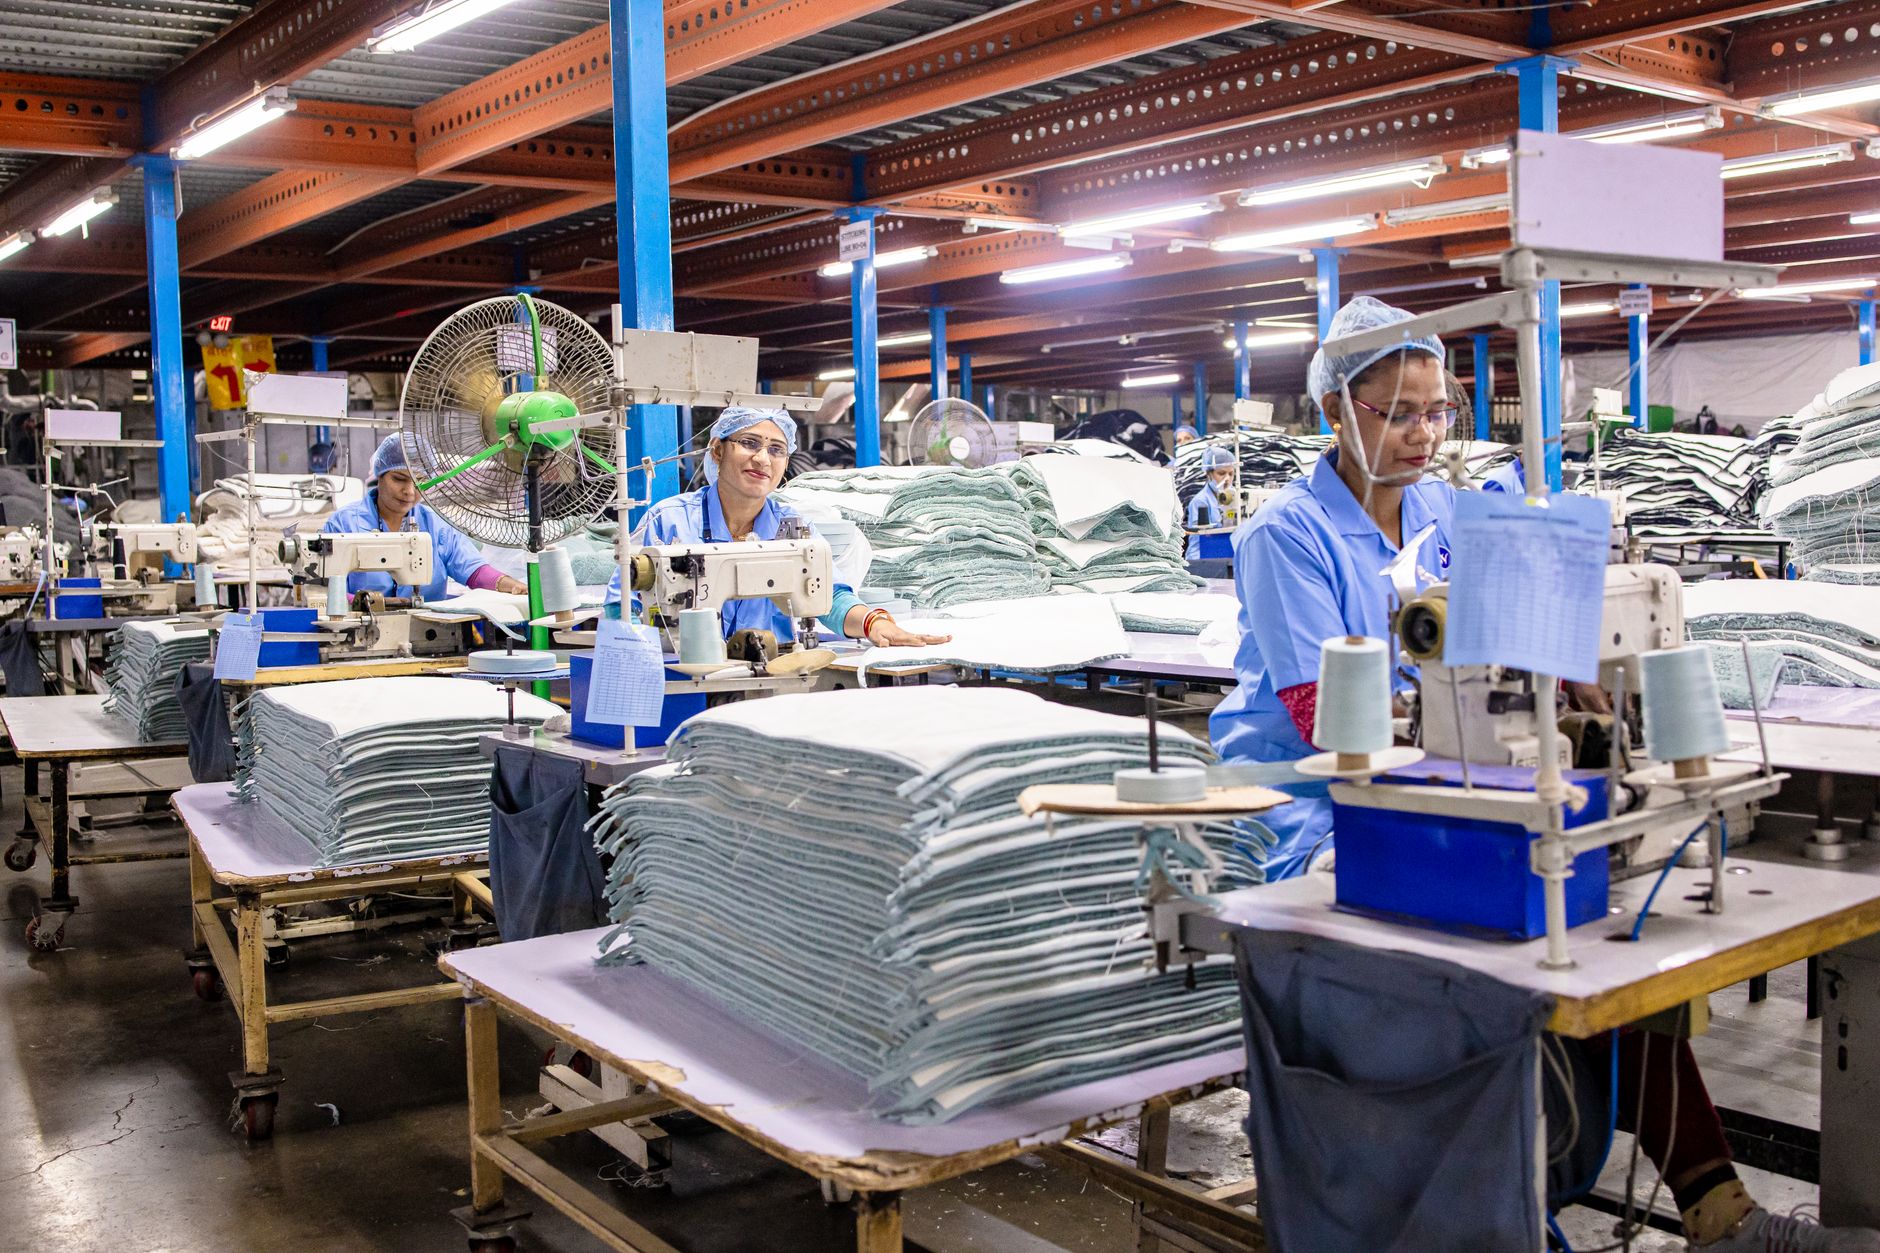
Cobots work at fixed stations rather than roaming the floor. The arm is mounted to a cell, table, or machine, and the work comes to it. That keeps the footprint small and the layout simple, which matters where floor space is tight. A palletizing cell, for example, is often the simplest to measure because the cycle is visible and the count is easy to log.
The six zones below cover the places where this return most often shows up. Each is a repetitive, measurable task. A site may have only two of them, and the assessment decides which ones pay.
Layout and safety come first. A cobot is designed to work near people, but each cell still needs a risk review, guarding decisions, and a clear handoff point where a person clears exceptions. The assessment maps the floor and those handoffs before any quote is drafted.
How fast is cobot adoption moving in North America?
A3 reports that North American robot orders reached 36,766 units in 2025, up 6.6 percent in units. Cobot orders were 7,212 units, 19.6 percent of all robots ordered and 10.7 percent of total revenue, according to A3 figures reported in trade press.
The quarterly count is sharper. According to Automate, A3 recorded 2,953 cobot units ordered in the fourth quarter of 2025, the highest quarterly volume since it began tracking cobots as a separate category in the first quarter of 2025, and 28.6 percent of fourth quarter robot orders.
Growth is uneven. The IFR report notes that cobot segment growth of 7 percent fell below overall robot market growth for the first time since tracking began, though the year is not clearly stated in that report. Total installation counts also did not agree across the sources reviewed, so this page uses only the cobot figures.
What are the risks to the return, and how do you avoid them?
The biggest risk is a task that looks repetitive but is not. If the load shape changes day to day, the arm stalls and people step back in, and the hours offset shrinks. Measure the variation for a few shifts before a share goes into the math. Watch for it after go live too, because it shows up as more manual intervention each shift.
The second risk is downtime. An arm out of service returns nothing while the lease continues. Ask how dispatch works, whether a spare unit is available, and how remote triage handles a fault. Service Robot Co. services units nationwide, and the response terms are written into the quote, so they can be checked before signing.
The third risk is scope creep. Starting with one cell and proving the hours is safer than planning the whole line on paper. A phased start also replaces the estimated share with a measured one, which is what narrows the range.
- Repeat motion across a full shift
Cobot
Holds pace and placement without fatigue
Staff
Slows over a long shift and needs breaks
- Irregular loads and exceptions
Cobot
Stalls or waits when the load shape changes
Staff
Adjusts by hand and keeps the line moving
- Judgment and quality checks
Cobot
Checks only what it is set to check
Staff
Spots defects and decides what to do with them
- Coverage of changeovers
Cobot
Needs staff to set up and reset the cell
Staff
Handles changeovers and troubleshooting
- Reaction to a changed layout
Cobot
Needs setup and a retaught path
Staff
Adapts within the same shift
What is a realistic timeline from assessment to payback, and how do I get a precise figure?
The sequence runs in order. The free site assessment maps the floor, times the task, and selects the arm for the site. A quote with the lease terms follows. After signing, the unit is deployed and integrated, staff are trained, and go live support covers the first production runs. Payback is measured from go live, using the hours the arm actually takes over. Teams often spend the first stretch after go live tuning the handoff, so early numbers are rough.
Payback time depends on the share, the lease term, and the service costs, so no single timeline is honest without site data. Track the hours offset through the first months of operation and compare it with the lease payment. If the measured share falls short of the plan, the range moves, and the calculator should be rerun with the real figures.
For a precise figure, book the free site assessment and bring your task log, shift count, and any incident records you already keep. Service Robot Co. returns a lease quote with the range the site supports. Nothing on this page replaces that quote.
Frequently asked questions
Put a robot to work in Denver.
We walk your site, learn the job, and recommend the unit that fits. Then we quote the lease, deploy it, and keep it serviced.
Sources
- US Bureau of Labor Statistics, Occupational Employment and Wage Statistics (OEWS May 2024)
- BLS Occupational Outlook Handbook, Hand Laborers and Material Movers
- O*NET OnLine, Laborers and Freight, Stock, and Material Movers, Hand
- Industry analysis of distribution center safety statistics citing BLS
- GAO-24-106413, workplace safety and health report
- International Federation of Robotics, 2026 president's report
- A3 full-year 2025 North American robot orders, as reported in trade press
- Automate, robot orders grow 6.6 percent in 2025
- BLS JOLTS annual release summary