

The short answer
Cobot ROI in Detroit comes from the labor hours a robot takes over from laborers and freight, stock, and material movers, hand work, offset against a fixed lease payment that is quoted after a free site assessment. The return is strongest where that work is repetitive, runs on long or extra shifts, and is hard to staff, and it shrinks when the robot takes only a small share of the task. The savings range from the calculator on this page is a starting estimate that the site assessment narrows.
Key takeaways
- The return depends on the hours a robot actually takes over, not on the hours it could theoretically run.
- According to the BLS, the Detroit-Warren-Dearborn metro had 11,600 workers in this occupation in May 2024, a deep local labor pool.
- The realistic share of the task sets the savings range, because people keep the exceptions and the changeovers.
- The lease cost is quoted after a free site assessment, so no figure on this page replaces measuring your own floor.
- Injury exposure and turnover strengthen the case, but they are not a measured return on their own.
Run the numbers for your site
Auto-detected from your location - we use the real BLS wage here. Not right? Pick your city or state above.
What do you want to automate?
The cobot stacks the repetitive end-of-line pallets; your team handles changeover and QA.
Cobot ROI in Detroit: where does the return come from?
The return on a cobot in Detroit comes from one place: labor hours. A cobot is a collaborative robot arm or mobile unit that takes repetitive handling work off the people who do it today, so the real question is which hours it takes and what those hours cost the business. For this page, the labor side is priced on the wage of laborers and freight, stock, and material movers, hand, the occupation that this kind of work falls under. The government wage data panel on this page gives the local wage for that job.
The Detroit-Warren-Dearborn metro is a large labor market for this work. According to the Bureau of Labor Statistics May 2024 Occupational Employment and Wage Statistics chart, the metro had 11,600 workers in laborers and freight, stock, and material movers, hand, ranking fifth among metro areas behind Chicago, Los Angeles, New York and Phoenix. A deep pool means hiring is possible, but it does not mean the work is easy to keep staffed.
Returns should be measured against that local labor, not against a national average. A business that is short on people or pays a lot of overtime sees the offset sooner than one with a full crew working straight time.
How many people do this work in the Detroit area?
The local count is the first thing to check, and the sources do not agree on every detail. The May 2024 BLS figure is the cleanest number available. A Stacker listing puts 5,930 first-line supervisors of transportation and material moving workers in the Detroit-Warren-Dearborn area, but it gives no year, so treat it as context rather than a current count. We did not find a 2025 Detroit metro figure for material moving workers.
Two cautions apply. The May 2024 release moved to new metro definitions based on the 2020 census, and the Detroit-Warren-Dearborn metro now includes Lapeer, Livingston, Macomb, Oakland, St. Clair and Wayne counties, so older comparisons may not be like for like. The national picture is much larger. The BLS Occupational Outlook Handbook reports about 7.0 million jobs in 2024 for hand laborers and material movers, and lists 2,988,900 jobs for the laborers and freight, stock, and material movers, hand group.
No published source we found gives a typical number of these workers at one site of this kind of business. The typical headcount on this page, four people, is a planning assumption for a single site and not a published count. The site assessment replaces it with the number of people doing this work at your building.
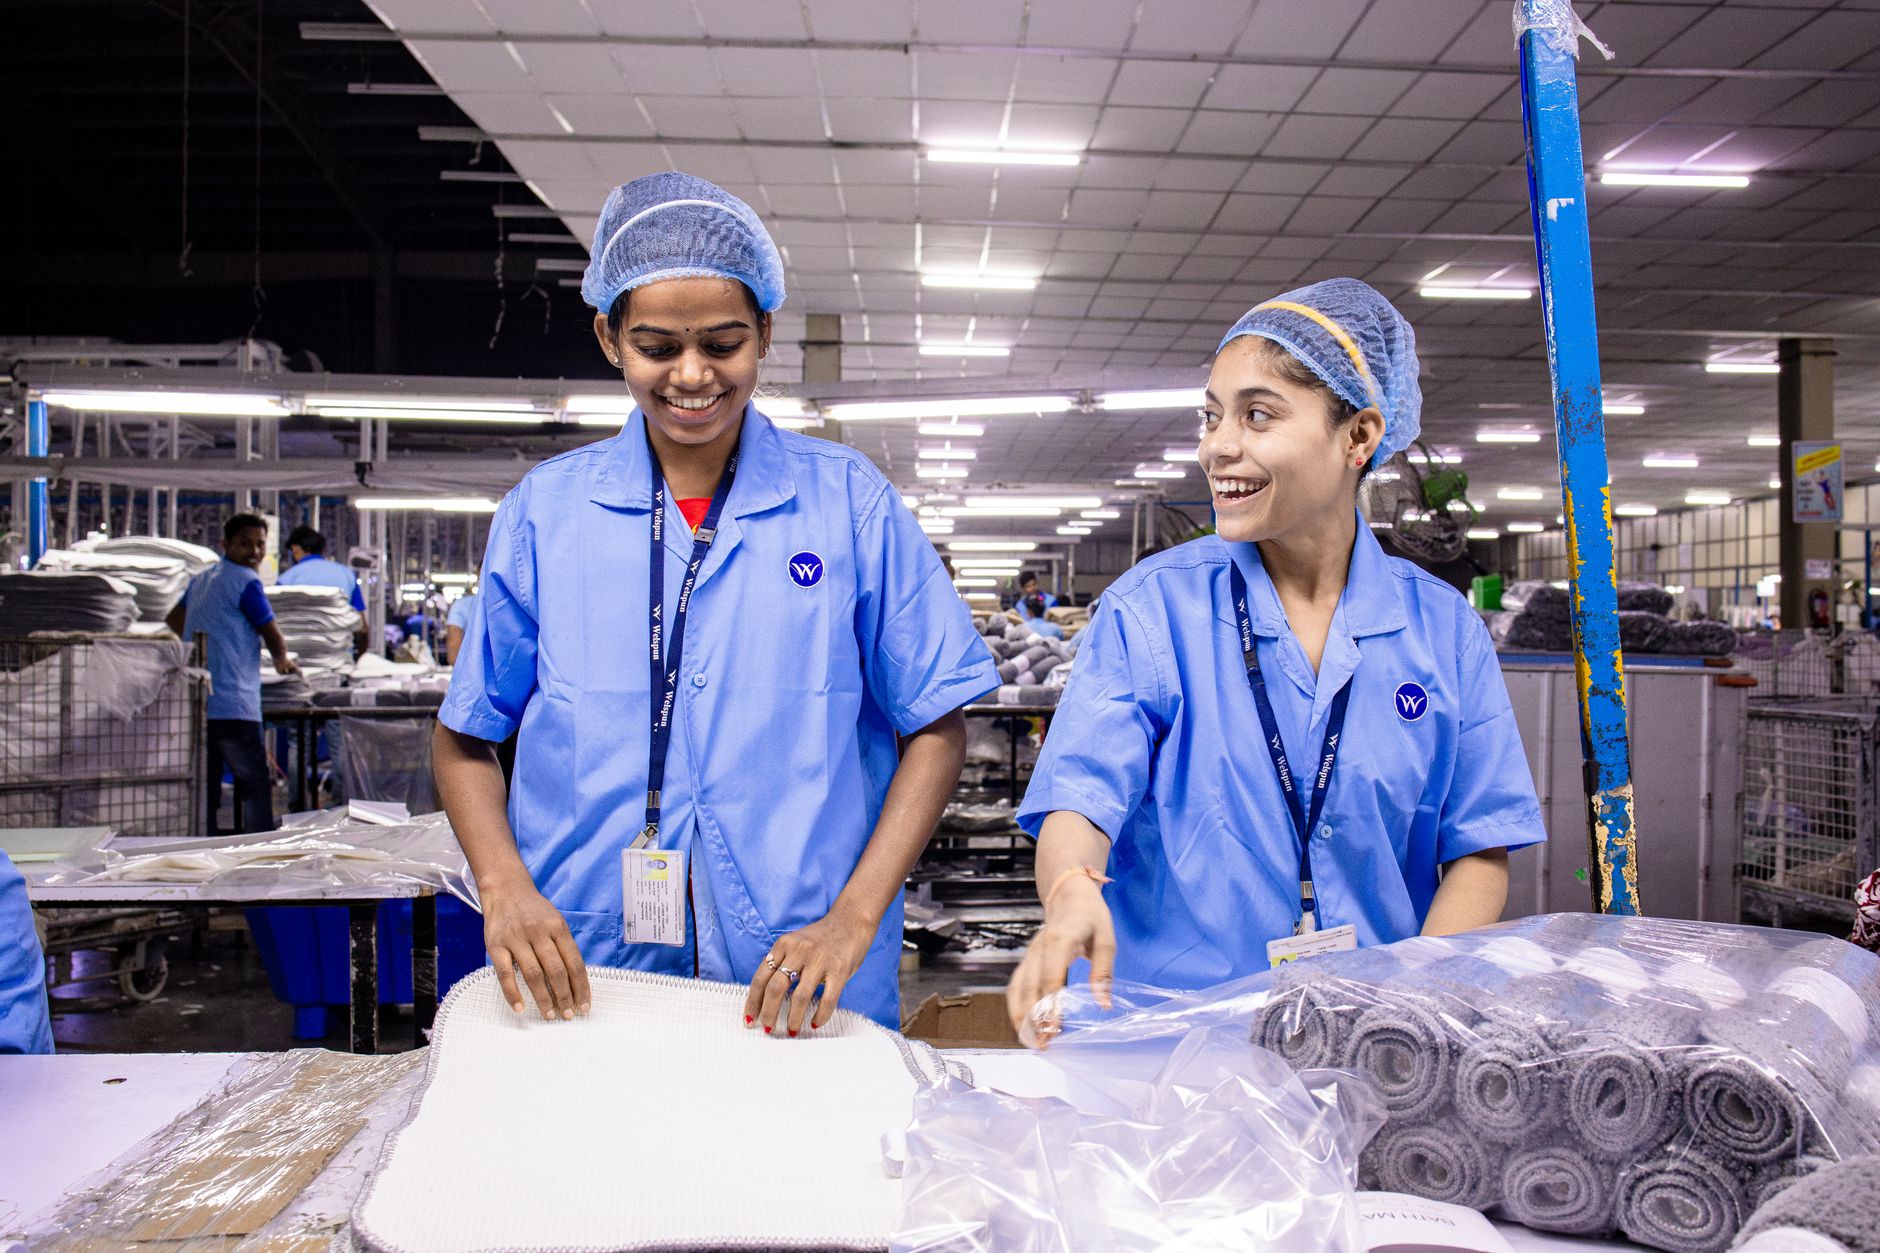
Median hourly wage, Laborers and Freight, Stock, and Material Movers, Hand
$4,476
Monthly cost of one full-time worker in Detroit, MI, at the median wage plus payroll costs (an estimate, not a quote).
How does the cobot payback math work?
The math has four inputs. The first is the hours per week that the work takes today, measured on the shifts the robot would cover. The second is the share of those hours a robot realistically takes, which is almost never all of them. The third is the labor cost of those hours, priced on the local wage for laborers and freight, stock, and material movers, hand from the government wage data on this page. The fourth is the lease cost, a fixed lease payment set after the free site assessment.
The offset is simple to state. Hours taken over, multiplied by the loaded labor cost of those hours, gives the labor saving. Subtract the lease cost and any costs outside the lease, and what remains is the net return. The calculator on this page runs that arithmetic with the local wage and returns a savings range rather than a single figure. The range is wide when the inputs are rough and narrows once the site assessment measures them.
Two details matter more than people expect. Overtime and open shifts count at the rate the business actually pays, which can be higher than the base wage. Hours the robot does not take still have to be staffed, so the saving is the set of hours removed from the schedule, not the headcount on paper.
Where do the hours actually go in this work?
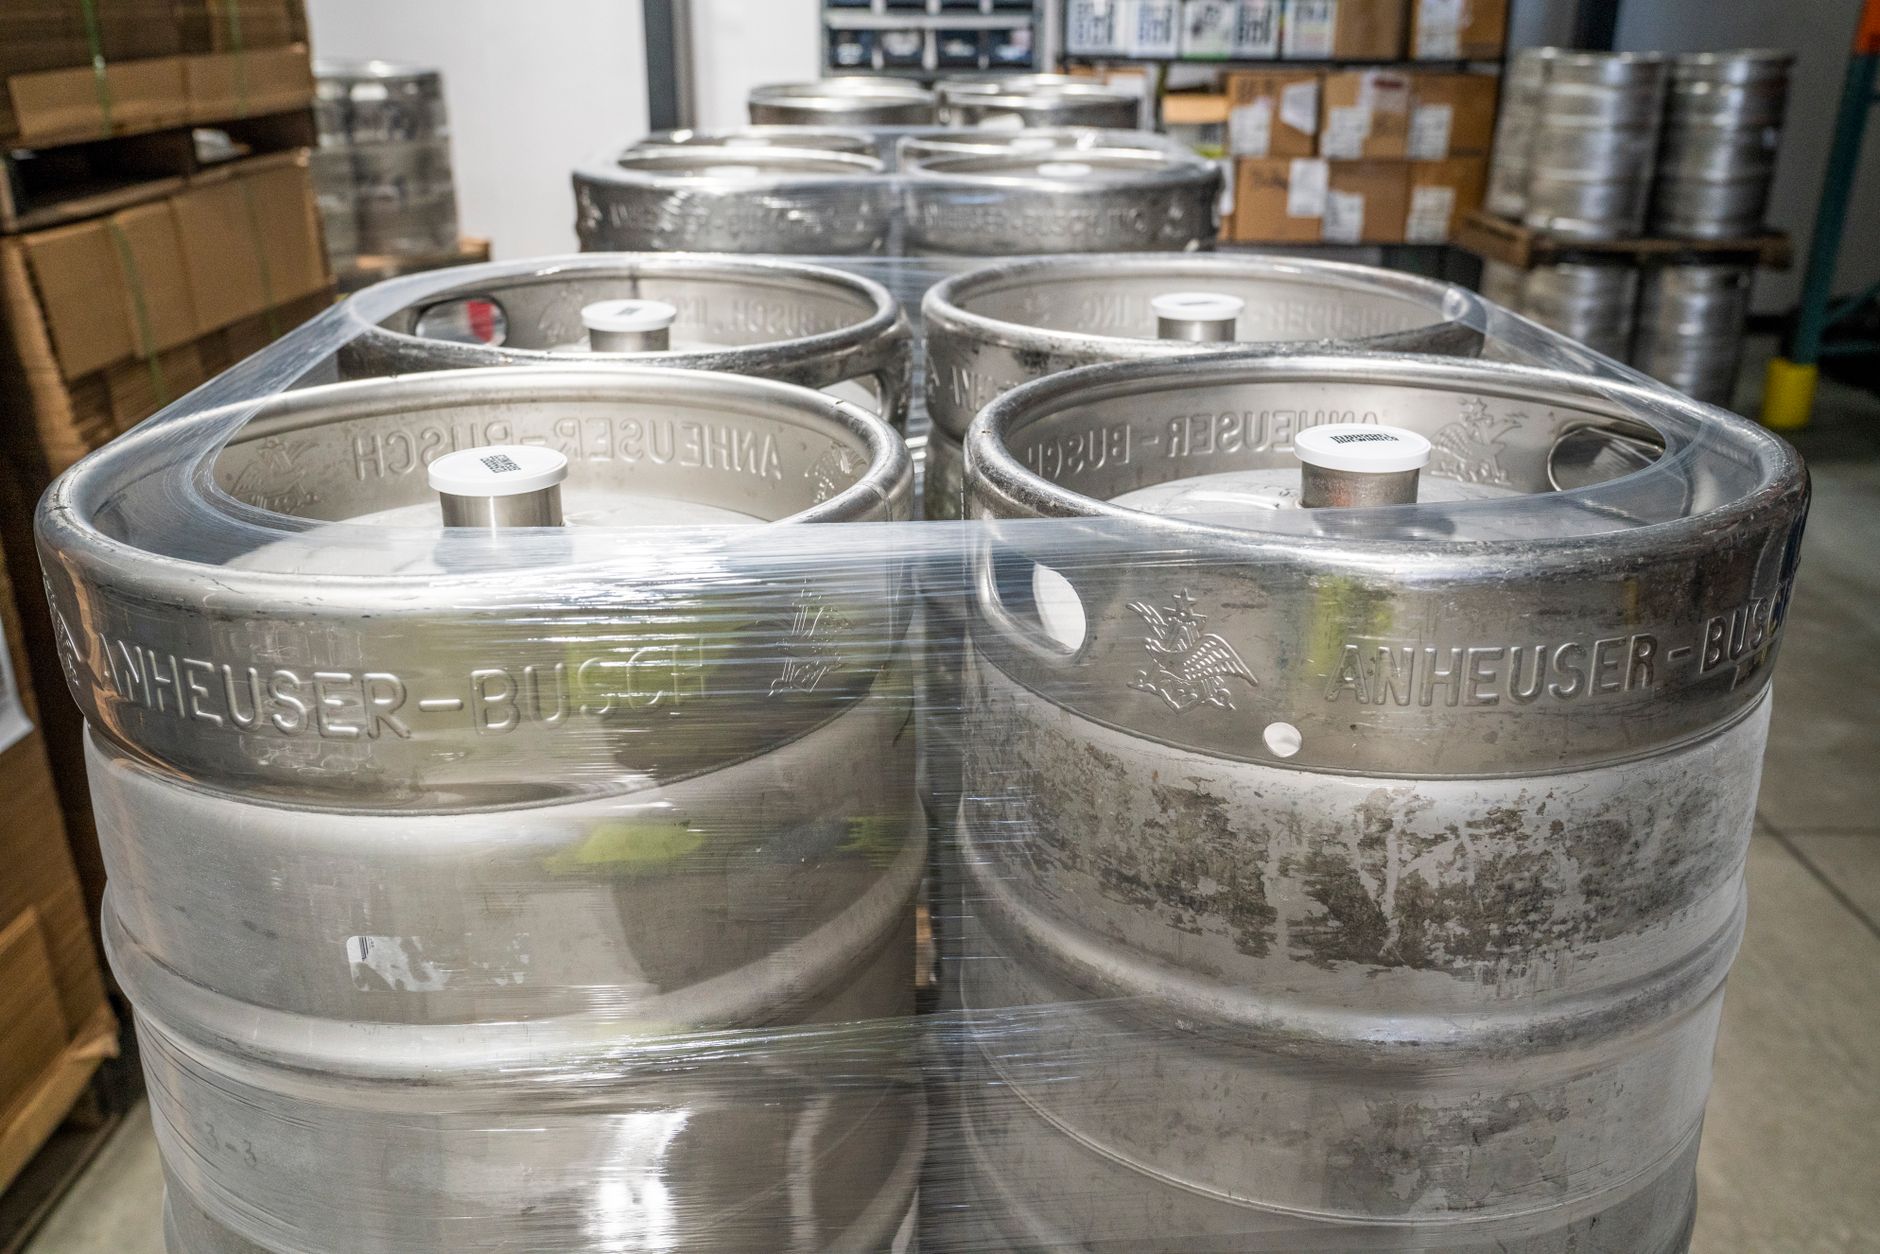
Most of the hours in this kind of work sit in a few repeatable moves: staging, carrying cartons or totes between points, feeding a process, and clearing the same route over and over. A cobot arm suits the fixed-station moves, and an autonomous mobile unit suits the travel between points. Neither covers the whole shift.
The table below names the work and what changes, rather than giving hour counts. The research did not turn up verified per-shift hour figures for this setting, so the actual hours should come from a time study during the site assessment, not from a published average.
What share of the work can a robot realistically take?
The realistic share is the number that decides the return. A robot that takes the steady middle of a task, with people keeping the exceptions, the changeovers, the damaged loads and the judgment calls, produces a return that holds up. A plan that assumes the robot takes everything usually fails in the first weeks of running.
The market has moved this way. According to A3, North American companies ordered 36,766 robots in 2025, up 6.6 percent in units and 10.1 percent in revenue from 2024, and non-automotive orders surpassed automotive orders. The International Federation of Robotics reported that the global operational stock of industrial robots rose 9 percent to a record 5 million units in 2025.
Collaborative robots were a meaningful part of those orders. A3 reported 7,212 collaborative robot units ordered in 2025, or 19.6 percent of robots ordered in units. That shows the category is established, but it does not show the share any single site will realize, which only the assessment can measure.
What changes the cobot return up or down?
Several things move the number, and most of them can be checked before anything is signed. Shift length and idle time matter most. A line that runs two shifts on the same repetitive move gets a return sooner than a single shift that is only busy at peak.
The checklist below lists what to check before deciding. Each item moves the savings range in one direction, and the assessment tests each one on your floor.
Do injury and turnover risks add to the cobot case?
Labor cost is not the only exposure. The Bureau of Labor Statistics reports that warehousing and storage recorded 4.8 total recordable cases per 100 full-time workers in 2024, and cases with days away alone were 1.5 per 100 full-time workers. Those are industry-wide rates for warehousing and storage, not Detroit figures, so they show the category's exposure rather than a local rate.
Turnover adds a second cost. The FRED series for quits in transportation, warehousing and utilities, from BLS JOLTS data and not seasonally adjusted, rose from about 128,000 in March 2025 to about 187,000 in November and December 2025. It is an industry-wide measure, not a Detroit figure, and it does not isolate laborers. Still, a shift that loses people often costs training time and overtime, and a robot does not quit.
These effects are real but hard to pin to one site. Count them as a reason to look at the case, and keep them out of the core savings range unless your own records show them.
What are the risks to the return, and how do you avoid them?
The main risks are a robot sized for the wrong task, a site that has not been mapped, and a staffing plan that never changed. A cobot that is too small for the load, or a mobile unit that cannot clear a doorway, stalls and leaves people doing the same work by hand. Mapping the route and the stations before any lease is signed prevents most of that.
The second risk is that savings never come out of the schedule. The hours a robot frees have to be removed from shifts, moved to other work or used to cover open positions. Without that step, the labor cost is still there and the return never shows.
The third risk is downtime. A unit out of service for repair should not stop the line, so the service arrangement and any spare unit coverage need to be settled before go live, not after the first failure.
What is a realistic timeline from assessment to payback?
The timeline runs in phases. First comes the free site assessment, where the route or stations are mapped, the work is timed, and the hours and the share a robot can take are measured. Next comes the lease quote, followed by installation, integration with the existing process, staff training and go live support.
After go live, the return depends on how fast the hours come out of the schedule. Payback is reached when the cumulative labor offset passes the lease and the costs outside it, so the first months matter most. The useful checkpoint is the hours actually removed from the schedule, not robot uptime alone.
We do not publish a fixed number of weeks for this, because it depends on the size of the site, the complexity of the route and how quickly the staffing plan changes. The assessment gives the timeline for your site.
How do I get a precise figure from a free site assessment?
A precise figure comes from measuring your site, not from a published average. Bring the shift schedule, the current hours for the repetitive moves, the overtime and open-shift record, and a rough floor plan. The assessment turns those into a savings range and a lease quote.
We pick the right robot for the site, lease it through financing, deploy and integrate it, train the staff and service it nationwide. The lease payment is quoted after the assessment, so the number reflects your floor and not a generic estimate. You can run the calculator on this page first to see how the range moves with your inputs.
The zones below show where this kind of robot typically works, so the assessment has a clear map to start from.
Frequently asked questions
Put a robot to work in Detroit.
We walk your site, learn the job, and recommend the unit that fits. Then we quote the lease, deploy it, and keep it serviced.
Sources
- US Bureau of Labor Statistics, Occupational Employment and Wage Statistics (OEWS May 2024)
- BLS OEWS May 2024 occupation area employment chart
- BLS Occupational Outlook Handbook, Hand Laborers and Material Movers
- BLS Industry Profile, Warehousing and Storage
- FRED, quits in transportation, warehousing and utilities (BLS JOLTS)
- The Robot Report, North American robot orders 2025 (A3)
- New Equipment Digest, robot orders and collaborative robots 2025 (A3)
- International Federation of Robotics, five million robots press release
- Stacker, most common jobs in Detroit