
The short answer
Delivery robot ROI in Bridgeport comes from the food running hours a robot takes off the floor, valued at the local wage for waiters and waitresses on the government wage data. Savings are always a range, set by how many runs per shift the robot realistically handles and by the lease cost quoted after a free site assessment. This page shows how that range is built so you can check each input against your own ticket and schedule records.
Key takeaways
- The return comes from food running hours the robot takes over, valued at the local wage for this job.
- Savings are a range, not a promise, and it moves with runs per shift, route length and peak timing.
- The lease quote follows a free site assessment, so this page carries no robot figure of its own.
- Your logged ticket and trip data count for more than any industry average.
Run the numbers for your site
Auto-detected from your location - we use the real BLS wage here. Not right? Pick your city or state above.
What do you want to automate?
The robot walks the repetitive trays; staff stay with guests and tables.
How much return can a delivery robot in Bridgeport bring?
A delivery robot earns its return in a Bridgeport restaurant by carrying food on runs a server would otherwise walk. The return only holds where those runs are frequent, predictable and long enough to matter. A counter-service room with short walks gives the robot little to do, while a full-service dining room with a long kitchen-to-table route gives it steady work every shift.
The delivery robot ROI in Bridgeport depends on three inputs: the food running hours on your floor, the share of those hours the robot realistically takes, and the lease cost for the unit. The government wage data shown beside this text supplies the labor side through the local wage for waiters and waitresses. We do not give a savings number before a site assessment, because the same robot returns very varied results in buildings of different layouts.
Read everything on this page as a method, not a forecast. The calculator turns your inputs into a range, and that range is only as firm as the counts behind it.
Where does the labor return come from?
Most of the time a robot can take is small, repeated trips: plates from the pass to a table, empty dishes back to the dish area, and the forgotten side a server walks back to the kitchen for. Each trip looks minor, but a busy room runs many of them in one shift, and the server time spent on them is time the restaurant pays for. The robot takes this waiters and waitresses type of work off the floor, so the labor it takes is valued at the local wage for that job.
The return does not come from removing a person from payroll. Most restaurants keep their servers, who handle guests, upsells and problems a robot cannot. The return comes from hours redirected: a server who is not walking a plate to a table is at the table, taking the next order or resetting it. That is why the labor side is a range rather than a fixed figure. It depends on how much walking really happens on your floor.
Median hourly wage, Waiters and Waitresses
$4,151
Monthly cost of one full-time worker in Bridgeport, CT, at the median wage plus payroll costs (an estimate, not a quote).
How does the savings math work?
Start with food running hours per shift, taken from your ticket and trip logs rather than estimates. Multiply that by the share of those hours the robot can realistically handle, which is always lower than the total, because some runs need a person: fragile glassware, special orders, a table with a problem. Value the robot's share at the local wage for waiters and waitresses, then subtract the lease cost and any service costs for the same period.
The result is a range. The low end assumes fewer runs go to the robot and more of the day is slow. The high end assumes steady runs at peak hours on a clear route. The fixed robot lease payment is the main recurring cost in the math, and it is quoted after the site assessment, so the calculator is only as accurate as the counts you enter.
For planning, we assume four people do food running per shift at a typical site of this kind. That is our working assumption, not a published count, so replace it with your own schedule before you use the range.
What does the national labor picture look like?
According to the Bureau of Labor Statistics Occupational Outlook Handbook, there were 2,329,700 jobs for waiters and waitresses in 2024. The projected decline from 2024 to 2034 is 16,300 jobs, about 1%, so the count is expected to edge down rather than grow. The same source says food services and drinking places account for 85% of this employment, which puts most of this work in the kind of business this page covers.
The Occupational Outlook Handbook projects about 456,700 openings a year on average over the decade, and that matters more than the net change. Total employment is roughly flat, but staffing still has to fill those openings every year, and each open shift is hours someone else must cover. A robot does not fill those openings, but it does reduce how many food running hours fall on the staff who are on shift. The Bureau of Labor Statistics job openings and labor turnover release for November 2025 put the overall quits rate at 2.0%, or 3.2 million people, and according to the same release, quits in accommodation and food services rose by 208,000 that month.
According to the National Restaurant Association 2025 State of the Industry pocket guide, the industry has more than 1 million locations, and more than seven in ten restaurants run as a single unit. That count is a headline figure, not an exact one. The same guide forecasts 15.9 million employees for 2025, and the association February 2025 press release expected about 200,000 jobs to be added that year. Most operators here run one building, so the case has to work for a single site.
Which restaurants get the most from a food running robot?
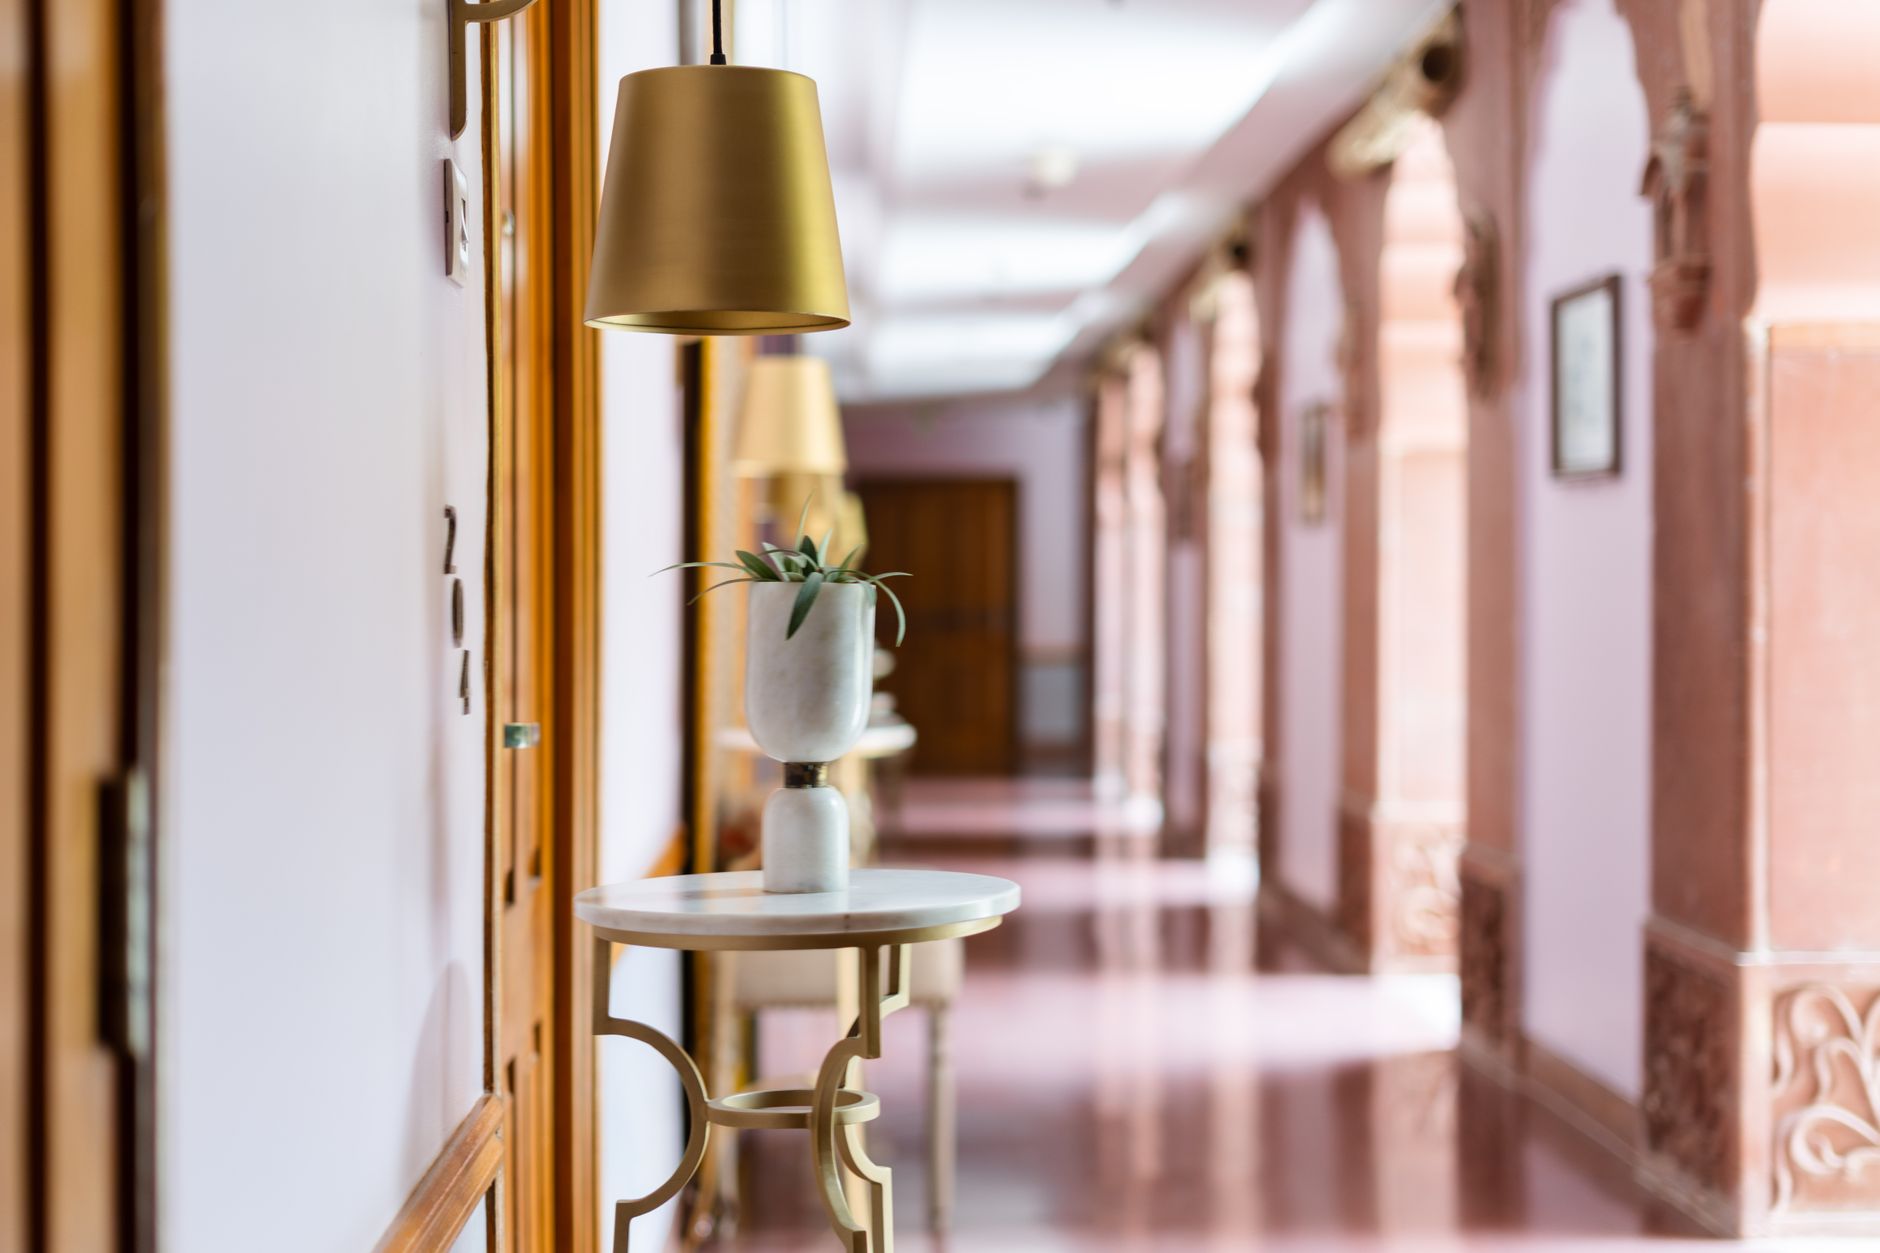
The best fit is a room with a long, clear route from the kitchen pass to a cluster of tables, and enough covers that runs queue during service. Full-service dining rooms, banquet spaces and rooms with a steady flow of plates give a robot more work than a counter-service room where food is handed over at close range. The route is the key: a clear line of travel with few stops is easier to run than a maze of tight corners.
Some formats fit less well. A small room with short walks, a floor that changes every night, or a service pattern where staff already hand food over at close range leaves the robot with few runs. A site with brief service or irregular hours also gives the calculator fewer hours to measure, so the range is narrower and less certain.
Operators with more than one location should assess each building separately. The same robot can serve a long dining room in one building and sit underused in a compact one nearby, so one site's result does not carry over to the next.
What changes the number up or down?
The biggest swing factors are the ones you can measure before you sign. Run volume, route length and peak timing move the labor side, and the local wage for waiters and waitresses sets what each hour is worth. Lease terms and service coverage move the cost side, so a quote with clear downtime support changes the net result as much as any staffing change.
Layout changes after launch matter too. If the floor is rearranged often, the route must be mapped again, and the robot does no work while that happens. The checklist below lists what to verify before the assessment, so the range you get reflects your building and not an average from somewhere else.
What are the main risks to the return?
The first risk is an inflated hour count. If the savings are built on estimated runs rather than logged ones, the range looks better than the floor will deliver. The second is downtime at peak. A unit that stops during the busiest hour leaves the server doing the work anyway, so the return depends on uptime and a plan for the stoppage.
The third risk is acceptance. Guests who expect quick service can resent a slow machine, and servers who see the robot as a threat may route work around it. Avoid both by setting runs so the server stays in the section, and by training staff on what the robot does and does not do. Protecting the return also means reviewing the figures every quarter, not once at launch, and adjusting the route when the menu or floor changes.
A fourth point concerns safety claims. The Bureau of Labor Statistics reports that food services and drinking places had 4.7 thousand illness cases in 2024, a rate of 6.4 per 10,000 full-time workers. Those are illness cases, not an injury rate for carrying trays, and the research behind this page did not verify an injury rate for this work, so do not credit the robot with a safety saving in your calculation.
How does a robot compare with a server on food running?
The robot wins on repetition. It takes the same route at the same pace, and it does not drift off the route for a missing napkin unless it is routed to. A server wins on judgment, speed on unusual requests and anything involving a guest, including a complaint, an allergy question or a table that needs a second look. The comparison below covers the food running task only, not the whole job.
The practical split is simple: the robot takes the repeated trips, and people keep everything that needs a guest's attention. Rooms with many unusual or fragile orders give the robot a smaller share, and the calculator should reflect that.
- Repeated kitchen-to-table runs
Delivery Robot
Same route and stops, with no fatigue over a long shift
Staff
Takes any run and adjusts to the order in hand
- Peak-hour pace
Delivery Robot
Holds pace on the route, limited by route length and traffic
Staff
Speeds up when needed, but slows as a long rush wears on
- Guest interaction
Delivery Robot
No conversation, and it cannot read a table or handle a complaint
Staff
Reads the room and handles questions, complaints and upsells
- Fragile, hot or unusual items
Delivery Robot
Limited to what its tray and handling allow
Staff
Carries anything and adjusts grip and timing
- Schedule coverage
Delivery Robot
Runs the route on the set schedule, with no sick calls
Staff
Depends on the schedule, breaks and turnover
What is a realistic timeline from assessment to payback?
The timeline runs through a few steps: a site assessment that measures runs and floor, a mapping step that builds the route, staff training, a go-live period with support on site, and then steady operation where the range can be checked against actual results. We agree the length of each step in the quote, because mapping and training depend on the building and the staff schedule.
Payback is reached when cumulative labor value covers the lease and service costs over the same period. You measure it rather than guess it. Track runs, hours of work taken and uptime from go-live, and compare them with the baseline set during the assessment.
If the early months show fewer runs than planned, revise the range before the next decision. Learning that in the first weeks is far cheaper than learning it at the end of a lease term.
How do I get a precise figure from a free site assessment?
A free site assessment turns the range into a figure for your building. We map the route, count food running trips from your logs or a short observed period, confirm the schedule and peak hours, and check the floor for obstacles. We then recommend the robot that fits the site and quote the lease through financing, with a fixed lease payment set after the assessment.
We are a commercial robot integrator. We pick the robot for the site, lease it through financing, deploy and integrate it, train your staff and service it nationwide, so one partner carries the work from assessment through support.
To prepare, gather any ticket data you have, a floor plan that is up to date, your staff schedule and your peak hours. Bring those to the assessment and the range becomes a figure you can check against your own operation.
Frequently asked questions
Put a robot to work in Bridgeport.
We walk your site, learn the job, and recommend the unit that fits. Then we quote the lease, deploy it, and keep it serviced.
Sources
- US Bureau of Labor Statistics, Occupational Employment and Wage Statistics (OEWS May 2024)
- Bureau of Labor Statistics, Occupational Outlook Handbook, Waiters and Waitresses
- National Restaurant Association, 2025 State of the Industry pocket guide
- National Restaurant Association, February 2025 press release on the 2025 industry outlook
- Bureau of Labor Statistics, Job Openings and Labor Turnover news release for November 2025
- Bureau of Labor Statistics, nonfatal illness by industry subsector chart, 2024