
The short answer
Delivery robot ROI in Fresno comes from serving hours that a robot takes off the floor, not from cutting a team. The return is a savings range set by the share of runner and bussing work the robot realistically handles, the government wage data for this job in Fresno, and the lease cost quoted after a free site assessment. The range is an estimate, not a promise, and the exact figure depends on your floor plan and service hours.
Key takeaways
- Returns come from serving hours a robot takes over, not from removing a whole shift.
- The realistic share of runner and bussing work sets the low and high ends of the range.
- Federal data show Fresno food service employment rising from 2021 to 2025, so staffing gaps are a real cost.
- Falls, slips and trips caused thousands of injuries at full-service restaurants in 2018 data, and a robot does not remove that risk.
- A free site assessment turns the range into a lease quote for your floor.
Run the numbers for your site
Auto-detected from your location - we use the real BLS wage here. Not right? Pick your city or state above.
What do you want to automate?
The robot walks the repetitive trays; staff stay with guests and tables.
How does delivery robot ROI in Fresno work?
The return on a delivery robot in a Fresno restaurant comes from one source: hours of walking and carrying that people no longer have to do. Runners carrying plates from the kitchen pass to tables, bussers clearing used dishes, and servers making extra trips for drink refills all take time a robot can take over. The saving is not a headcount cut. It shows up as staff time released for guest contact, steadier service on busy nights, and fewer hours lost to repeat trips.
We calculate the range from four inputs: the labor hours the robot can offset each week, the share of that work the robot realistically takes, the government wage data for the waiters and waitresses type of work in Fresno, and the lease cost. The calculator on this page is pre-filled for Fresno and shows the range from those inputs. Nothing on this page is a fixed savings figure.
Read the output as a band. The low end assumes a conservative share of tasks and a slow ramp. The high end assumes a clean floor plan, steady service hours and a robot working through most of the runner routes. The site assessment narrows the band for your building.
How big is the server labor pool in Fresno?
Restaurant counts put the US at well over 700,000 restaurants, according to a restaurant point-of-sale vendor citing National Restaurant Association state data. Within that market, the Bureau of Labor Statistics reports about 2.3 million jobs for waiters and waitresses in 2024, according to its Occupational Outlook Handbook. That employment is projected to decline 1 percent from 2024 to 2034, about 16,300 jobs, while the same source projects about 456,700 openings per year on average over the decade. Hiring for this job is therefore ongoing, not occasional.
The handbook also says food services and drinking places employ about 85 percent of these workers, and that workers typically learn the job on the job. Training is a repeated cost for the restaurant, not a one-time event.
In Fresno, the Federal Reserve Bank of St. Louis series for food services and drinking places employment in the metro rose from 29.9 thousand jobs in 2021 to 33.2 thousand in 2024 and 33.9 thousand in 2025. That series covers the whole sector, not only servers. A jobs analysis of BLS data for the Fresno metro counts about 4,500 people employed as waiters and waitresses in May 2024. The government wage data on this page gives the local wage for this job, and the labor side of the math uses that rate.

Median hourly wage, Waiters and Waitresses
$3,744
Monthly cost of one full-time worker in Fresno, CA, at the median wage plus payroll costs (an estimate, not a quote).
Which serving tasks does a delivery robot take over?
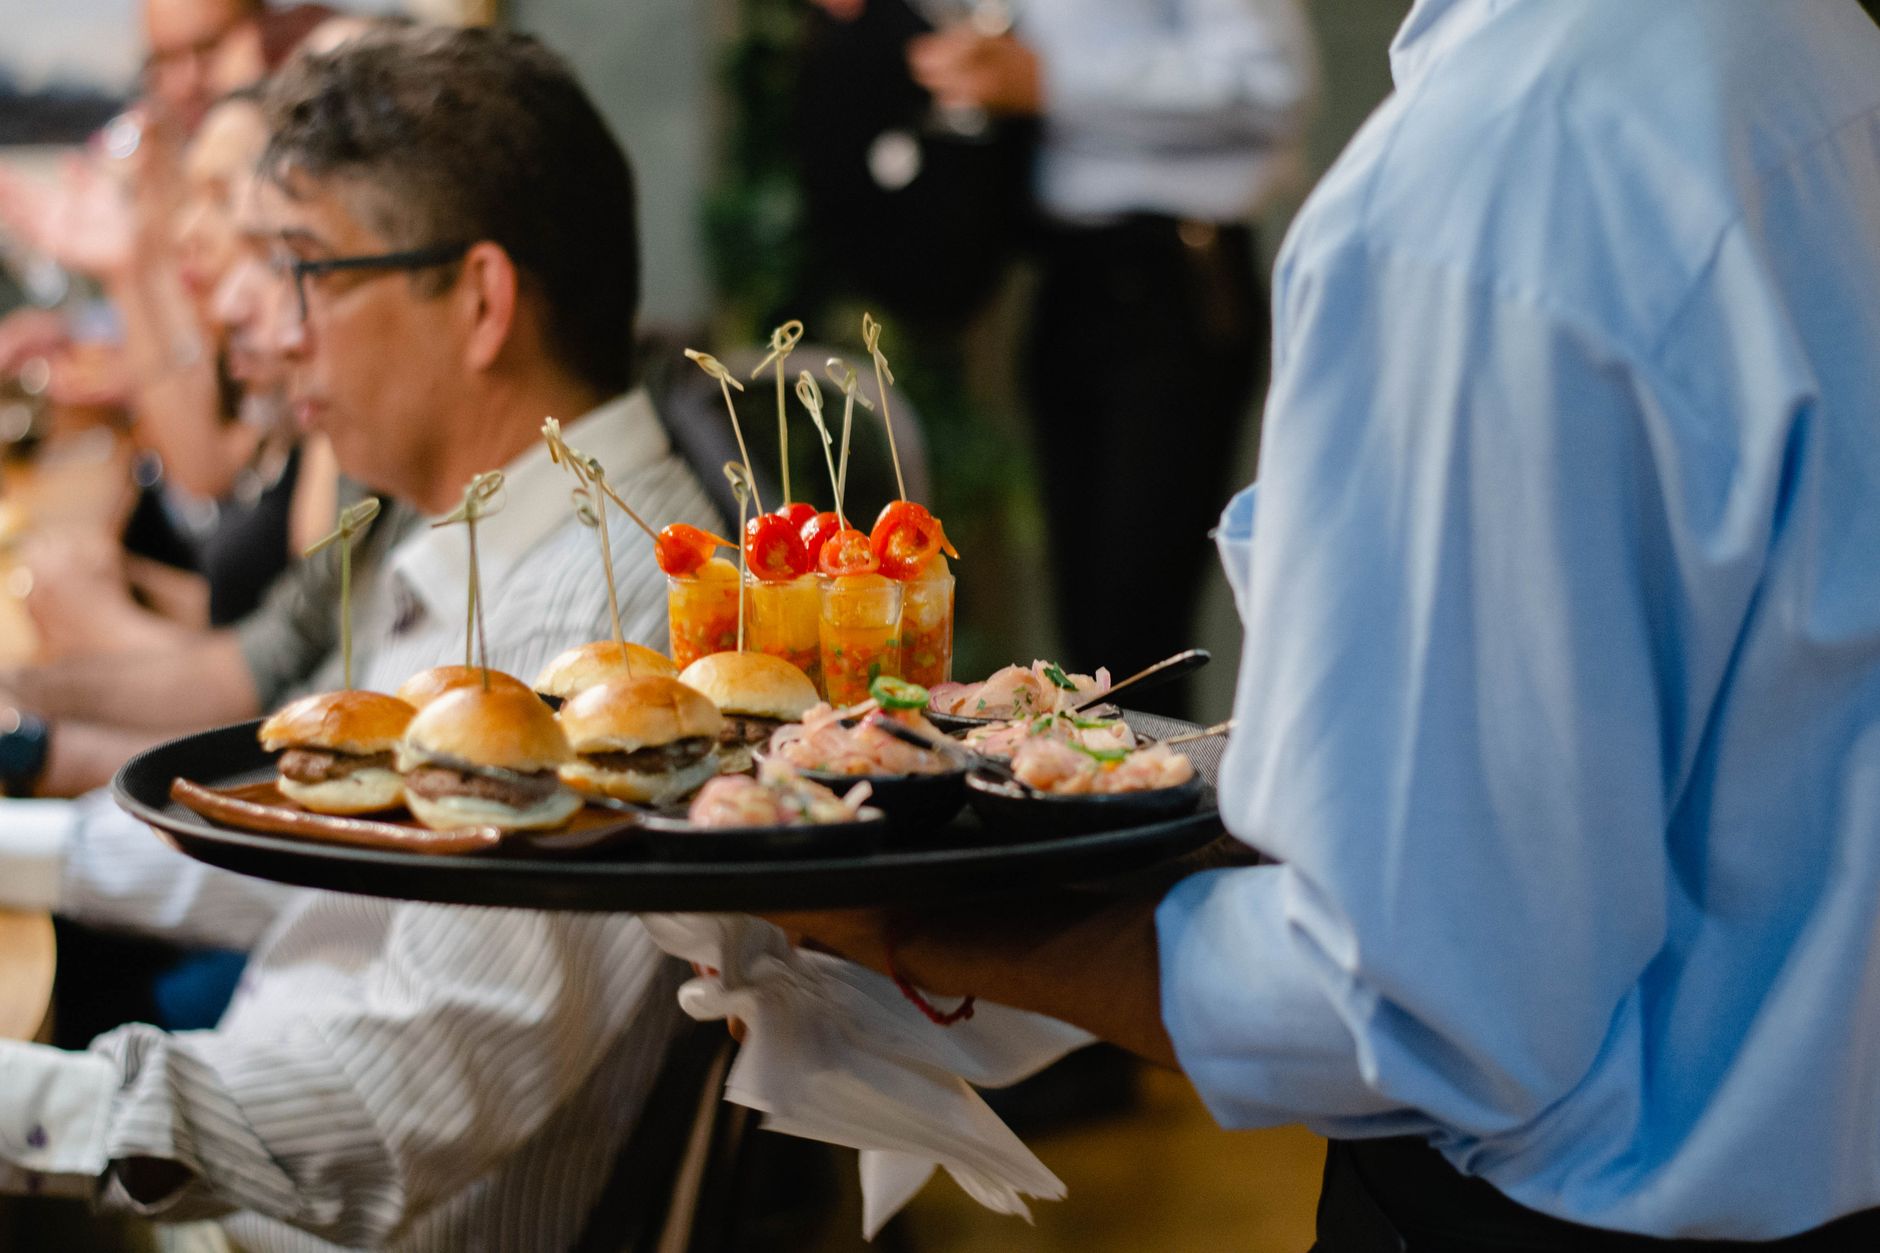
A delivery robot works on the repeatable movement in the dining room. The clearest tasks are food running from the pass to a table, carrying used dishes back to the wash area, and moving drinks or side items between stations on a fixed route. These are long walks that repeat across every shift, and they are where route planning pays off most.
Tasks that need judgment stay with staff. Taking an order, reading a table, handling a complaint, or adjusting a dish for a guest with a dietary need are work a person still does. This split is why the robot takes the waiters and waitresses type of work off the floor rather than replacing the team.
The hour figures in the table below are set during the site assessment from your covers, floor plan and service hours. The sources we used do not give a per-shift hour figure for a restaurant floor, so the table describes the work by type. We use a planning assumption of four people doing this work at a typical site. That is not a published statistic, and the assessment replaces it with your own staffing.
- Dining room runs
Delivery Robot
Follows fixed, mapped routes between the pass and tables
Staff
Changes route on the fly when tables move or aisles clog
- Guest interaction
Delivery Robot
Does not take orders, read a table or handle a complaint
Staff
Takes orders, reads the table and resolves problems
- Peak hours
Delivery Robot
Keeps running on a clear route, but a blocked aisle stops it
Staff
Covers several stations and adapts within the rush
- Changes to layout
Delivery Robot
Needs trained staff to update routes and mapping
Staff
Adjusts to a new layout after a short verbal briefing
- Uneven floors and thresholds
Delivery Robot
Needs flat, mapped routes and clear thresholds
Staff
Steps over thresholds and handles stairs and patios
- Learning the job
Delivery Robot
Staff learn loading, controls and basic checks
Staff
Workers typically learn the wider role on the job
How is the lease cost and payback calculated?
The payback math is simple in structure. Take the labor hours the robot offsets in a week, convert them to cost using the government wage data for this job in Fresno, and multiply by the share of that work the robot realistically takes. Compare the result with the lease payment over the same period.
The lease cost is a fixed robot lease payment through financing, quoted after a site assessment. Robots are leased, so the restaurant has no upfront capital to commit at the start. Maintenance and service are part of the lease program, and the quote states what is covered. The calculator shows the payment and the offset side by side so you can see the gap for your own hours.
Check the arithmetic with a simple test. If the offset is smaller than the lease payment, the robot does not pay back on labor alone, and the case has to rest on something else, such as faster turns. The calculator flags that outcome rather than hiding it.
- Labor hours the robot offsets in a week
- Times the local wage for this job from the government wage data on this page
- Times the share of that work the robot realistically takes
- Compared with the lease payment over the same period
Why does staff turnover change the return?
Turnover is a real cost in this job. According to the Bureau of Labor Statistics JOLTS series, the quits rate for accommodation and food services was 3.5 percent in August 2026, down from 3.9 percent in August 2025. That is a national rate for the whole sector, not a Fresno figure. A lower quits rate means fewer training cycles, but it does not remove the need for trained staff on the floor.
Turnover affects the return in two ways. A robot takes repeat runs during peaks, so service stays steady while a new hire is still learning the floor. It also means fewer hours are lost when a runner calls out. Neither effect is a fixed figure in the calculator. The site assessment estimates them from your own schedule records if you have them.
Do not count turnover savings twice. If the offset already includes runner hours, adding a separate training saving inflates the range. Keep the labor side tied to the hours the robot takes over.
What are the risks to the return and how do you avoid them?
Injuries are the first risk to plan for, and a robot does not remove the largest share of them. The Bureau of Labor Statistics fact sheet for full-service restaurants, using 2018 data, estimated 7,850 injuries from falls, slips and trips, of which 5,170 were falls on the same level. A robot takes some of the walking, but staff still move through the same aisles with hot plates. Route design and floor care are the controls that matter.
A Montana state analysis covering 2015 to 2024 counted about 12,600 food and beverage service injuries and found that cuts were the most common type, not falls. That mix means knife handling and dish areas deserve the same attention as the aisles.
The second risk is adoption and readiness. A survey of 359 US restaurant operators, fielded from late 2024 to early 2025, found 34 percent had adopted AI technology and 48 percent planned to in 2025. That survey covers AI, not service robots, so treat it as a sign of general readiness rather than a benchmark for robots. The third risk is downtime. Keep spare units and on-site dispatch in the lease so one failure does not remove a whole shift of offset.
How long does it take to reach payback?
The timeline runs in stages, and the payback clock starts at go-live, not at signature. The first stage is the free site assessment, where we map the floor, record blocked points and set the hour and share inputs. The second is the lease quote, then deployment and integration of the robot with your service flow. The third is training staff and a go-live period in which routes and loading are tuned.
The ramp matters more than the first week. Early weeks often carry a smaller share of work, because staff are still learning the routes and the robot is still learning the room. Plan on the low end of the band during the ramp and move toward the middle once routes run clean. We cannot give a fixed payback month for every restaurant, so the timeline in your quote is the one to plan around.
A pilot with one leased unit is the lowest-risk way to test the band. You measure the hours taken and the share of work in your own dining room before expanding.
How do I get an exact figure from a free site assessment?
A free site assessment turns the range into your number. We map the dining room and the routes between kitchen, pass and tables, count covers and service hours, and record blocked points such as thresholds, steps and crowded corners. The result is a route plan and a realistic share of runner work the robot can take, which replaces the planning assumptions on this page.
We pick the robot that fits the floor, lease it through financing, and deploy and integrate it with your service flow. We train the staff who will load and supervise it, and we service it nationwide with on-site dispatch and remote triage. The lease quote states the payment and what is covered, so you can compare the offset with the cost on one page.
Bring your schedule, a floor plan and your present staffing notes. The assessment is the step that produces the precise figure for your restaurant.
Frequently asked questions
Put a robot to work in Fresno.
We walk your site, learn the job, and recommend the unit that fits. Then we quote the lease, deploy it, and keep it serviced.
Sources
- US Bureau of Labor Statistics, Occupational Employment and Wage Statistics (OEWS May 2024)
- U.S. Bureau of Labor Statistics, Occupational Outlook Handbook: Waiters and Waitresses
- Federal Reserve Bank of St. Louis economic data: food services and drinking places employment, Fresno metro
- U.S. Bureau of Labor Statistics, The Economics Daily: quits rate in accommodation and food services, August 2026
- U.S. Bureau of Labor Statistics injury fact sheet: full-service restaurants, 2018
- Jobs analysis of BLS data for Fresno lowest-paying occupations
- Restaurant count citing National Restaurant Association state data
- Montana Department of Labor and Industry research newsletter on food and beverage service injuries
- Restaurant technology trade news on a survey of 359 US operators