

The short answer
For a Des Moines business, delivery robot ROI comes from the labor hours a robot takes over, meaning the walking, carrying and table runs that waiters and waitresses do on each shift. The savings range on this page is built on that work, offset by the share of runs a robot realistically handles and by the fixed lease cost, so it is a range, not a promise. A free site assessment turns the range into a figure for your own floor.
Key takeaways
- The return depends on how many food running trips a robot can take over, not on the robot alone.
- Local wage data sets the value of those hours, and the savings range shows that value as a range.
- A robot covers part of the shift, so the realistic take rate matters more than any headline number.
- Route layout, run length and staffing levels move the payback more than anything else.
- A free site assessment replaces the default assumptions with a lease quote and a payback date for your floor.
Run the numbers for your site
Auto-detected from your location - we use the real BLS wage here. Not right? Pick your city or state above.
What do you want to automate?
The robot walks the repetitive trays; staff stay with guests and tables.
What is delivery robot ROI in Des Moines, and how large is the return?
Most Des Moines restaurant operators who ask about delivery robot ROI in Des Moines want a plain answer: how many hours of server work does the robot take over, and what does that work save against the lease. The return is a range, and its width depends on how the room runs. A quick service counter, a full service dining room and a hotel banquet floor each move food differently, so the same robot can pay back faster in one setting than in another.
The government wage data on this page sets the value of each hour the robot takes over. The calculator on this page is pre-filled for Des Moines and values that work at the local wage for waiters and waitresses. The robot does not replace a whole position. It takes a defined share of food running, so the saving comes from fewer hours of that work, not from fewer names on the schedule.
Read the savings range as a planning tool. It shows what the numbers look like under realistic defaults for this metro, and it changes once a site assessment swaps those defaults for your floor plan, shift pattern and menu.
Where does the return come from in a Des Moines restaurant?
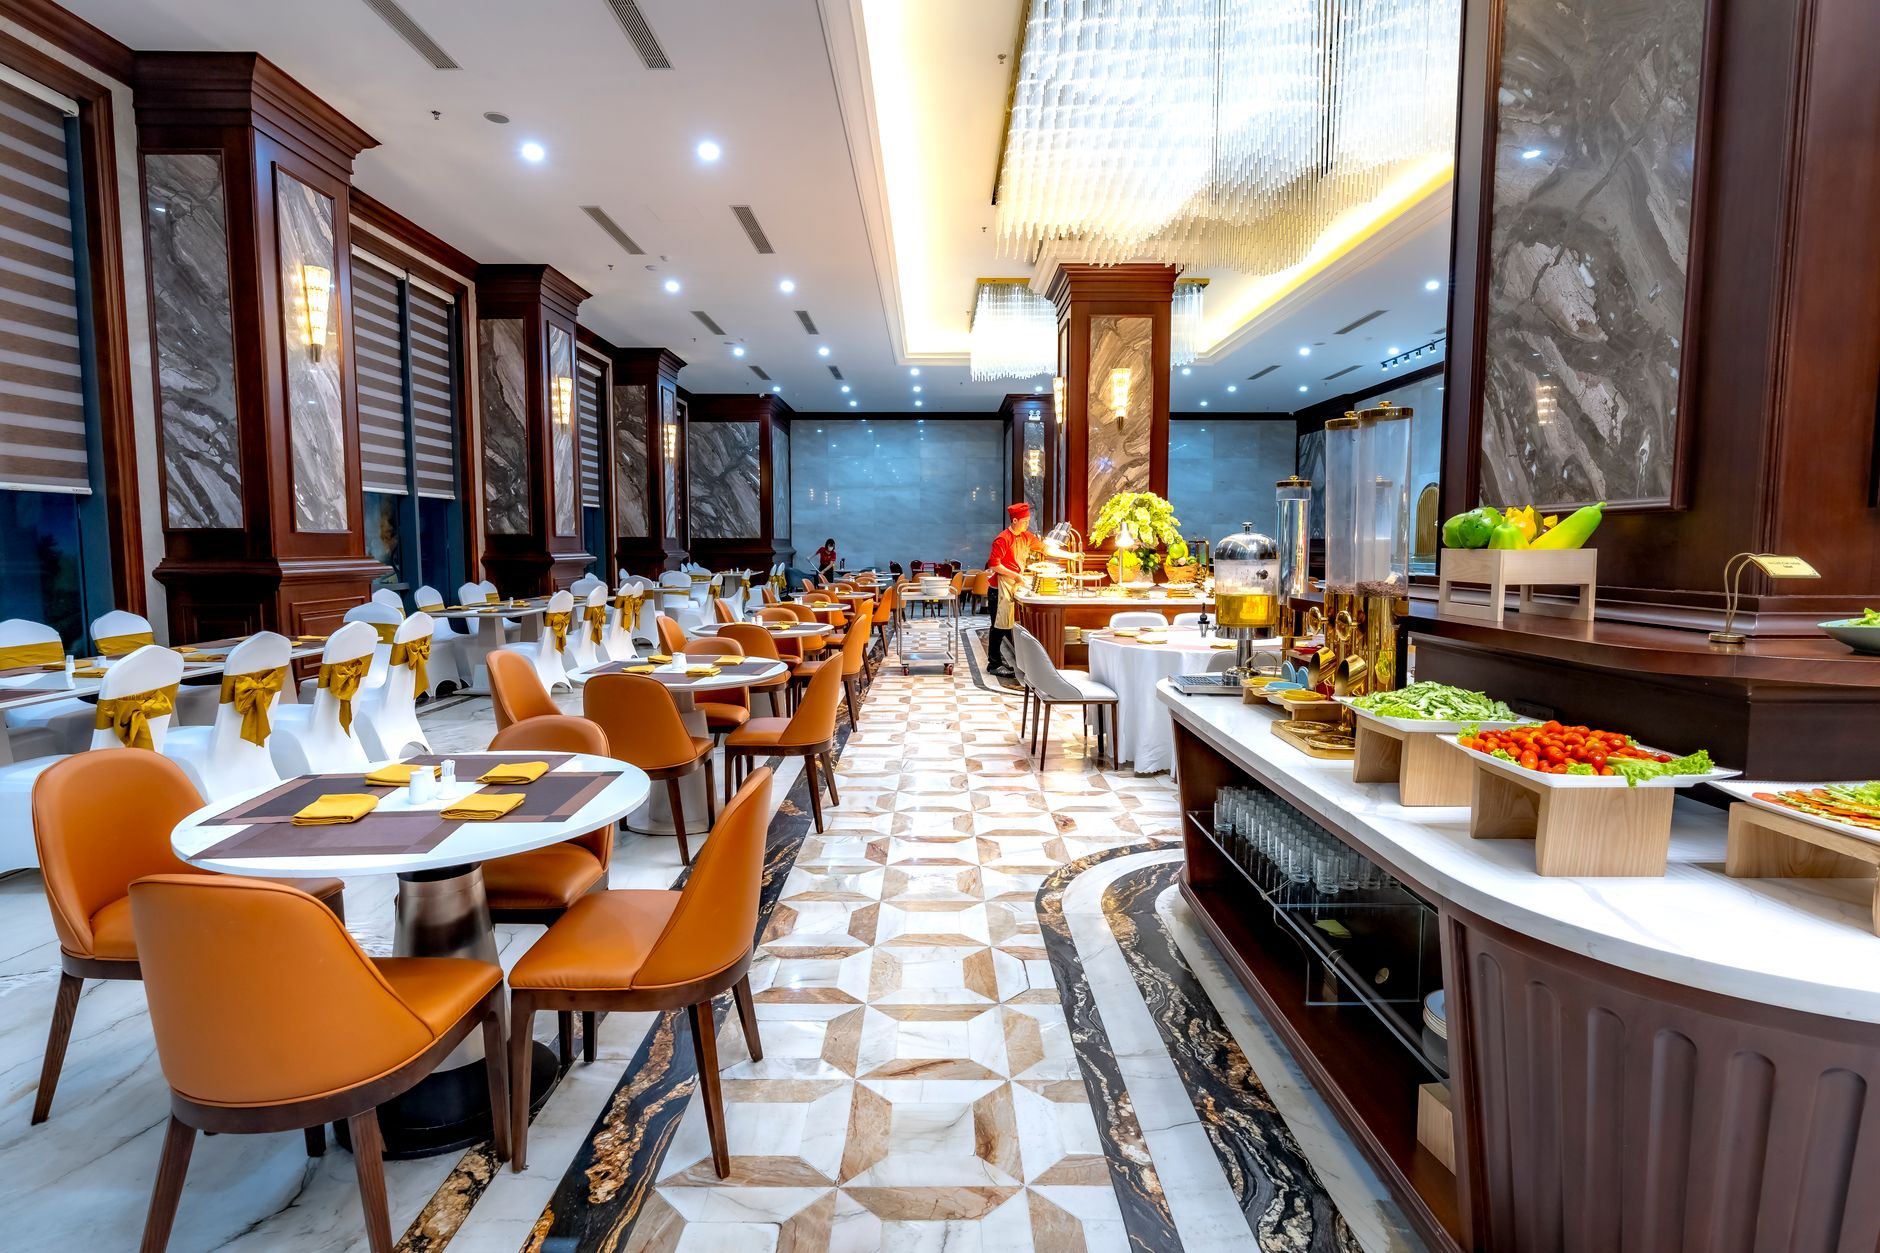
Iowa has a large base of food service sites. According to the National Restaurant Association's Iowa state fact sheet, using 2023 data, the state had 6,558 restaurant locations and 148,600 restaurant and foodservice jobs. Those are statewide counts, but they show how many rooms share the same pattern of runs between kitchen pass, dining room and dish area.
Within the Des Moines metro, WageDex, a third-party site citing May 2025 OEWS data, lists about 6,250 waiters and waitresses, about 850 hosts and hostesses and about 2,200 bartenders. The waiter and waitress group is where most of the food running hours sit, so it is the group the calculator prices. WageDex is secondary to the official tables, so use it for scale rather than for an exact count.
The return comes from three places: the food runs themselves, the trips that carry used dishes back to the dish area, and the short trips for drinks, condiments and refills. The first is the largest. A robot does not need to take every run to matter. It needs to take enough of them to cut the back and forth on a busy shift.
Median hourly wage, Waiters and Waitresses
$3,246
Monthly cost of one full-time worker in Des Moines, IA, at the median wage plus payroll costs (an estimate, not a quote).
How does the payback math work?

Start with labor hours. Count the food running work per shift that a robot can cover, multiply it by the local hourly value of that work from the government wage data on this page, and multiply by the number of operating days in a year. That gives the gross labor value of the hours the robot could take.
Then apply realism. A robot does not run every trip. It takes runs on clear, mapped paths, such as the main dining room to the kitchen pass. Runs into crowded corners, through doors without sensors or up to private rooms with thresholds usually stay with staff. The calculator applies a default share, and the site assessment replaces it with a measured one.
Subtract the fixed robot lease payment and any support costs, and the remainder is the net return for each period. The fixed robot lease payment is quoted after a site assessment and stays the same for the lease term. Payback is the point where accumulated net return covers deployment and training costs.
What changes the number up or down?
Shift length and service rhythm are the biggest levers. A room with long, steady food runs across lunch and dinner gives the robot more trips to take. A room that serves in short bursts gives it fewer clean windows in which to work.
Layout matters just as much. Clear, level and wide paths with few steps tend to produce a higher take rate. Thresholds, elevator transfers between floors and crowded patios reduce it, though some multi floor setups still work with the right equipment and route plan.
Staffing conditions shape the value side. Hard to fill shifts make covered hours more valuable, while a site with stable staffing and low turnover gets a smaller labor offset. The turnover data in the next section explain why the same site can look different from one year to the next.
What are the risks to the return, and how do you avoid them?
The biggest risk is over-scoping. A robot asked to run every trip, including the hard ones, will spend time stuck at the difficult parts of the floor, and the take rate drops. Start with the runs that already follow clear routes, then widen the route map as the numbers prove out.
The second risk is downtime during service. A robot out of service during dinner returns those hours to the staff, plus the cost of a missed route. Put spare coverage, remote triage and on-site dispatch into the lease before go live, and confirm response times in writing. Safety also matters. The national private industry rate for nonfatal injuries and illnesses was 2.3 per 100 full-time workers in 2024, according to a Nevada state release of BLS data, so keep routes clear and train staff on where the robot moves.
The third risk is staff adoption. Servers who see the robot as a rival tend to route around it, which cuts the hours the calculator assumed. Train staff on loading and routing, give them a clear role for the hours it frees, and review route data every few weeks.
What is a realistic timeline from assessment to payback?
Expect the timeline to run in stages. The free site assessment comes first. It produces a floor map, a route plan and a fixed lease quote. Financing approval and the lease agreement follow, and then deployment and integration begin.
Deployment covers route mapping, tests with real loads, staff training and go live support. Phased rollouts keep one station running while another is trained, so service does not stop. The go live date depends on approval timing and the size of the site, so ask for a dated plan in the quote.
Payback follows go live. Early weeks often show a lower take rate while routes are tuned, so the first few months are a calibration period. Measured results replace the default share, and the payback date moves to match the real take rate.
- Free site assessment, floor map and route plan
- Lease quote and financing approval
- Lease signed, deployment and integration
- Staff training and go live support
- Measured take rate and payback review
What does the local labor market tell you about covering hours?
The Bureau of Labor Statistics projects a change of -1% for waiters and waitresses from 2024 to 2034, a loss of about 16,300 jobs, according to its Occupational Outlook Handbook. The same handbook lists about 456,700 openings per year on average, mostly from workers leaving and being replaced. That churn is why covering hours through hiring is slow and unreliable.
The turnover data show the pressure. According to FRED, which publishes BLS JOLTS data, the total separations rate for accommodation and food services was 6.1 in January 2026 and 5.4 in February 2026, both seasonally adjusted. The job openings rate for the same sector was 6.4 in August 2025.
A restaurant industry survey cited in Indianapolis Business Journal coverage found that 62% of operators say they lack enough staff to meet demand. That survey's date is not verified and it does not address robots, but the pattern matches the BLS and FRED data. Hiring takes time that the floor does not have, which is where a robot can cover predictable runs.
Robot or person: what does each do best?
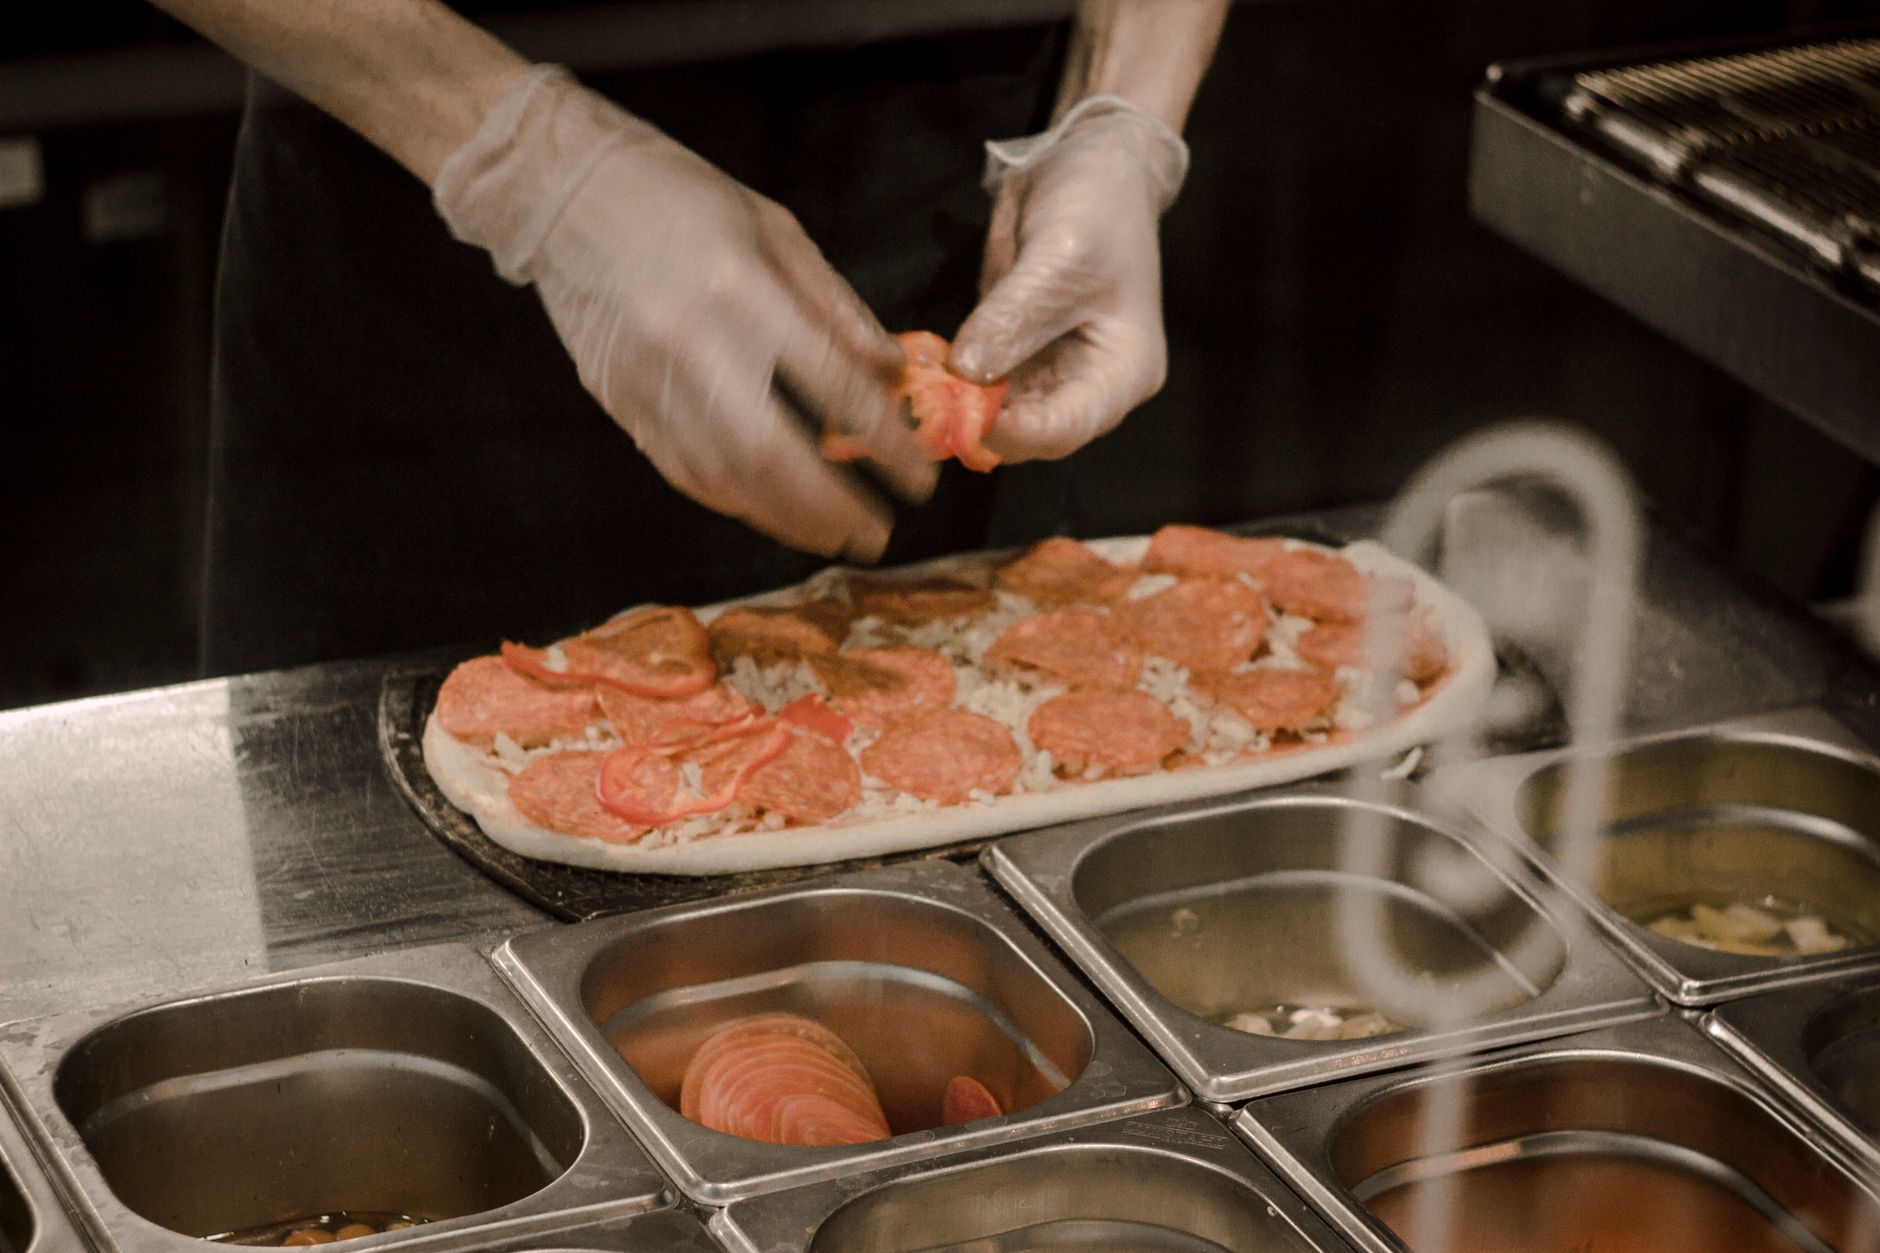
A robot is consistent. It runs the same route with the same load on each trip, and it does not get pulled into table talk or forget a path. It can keep a steady pace through a shift, while a person's pace usually slows as the shift wears on.
Staff win where the work needs judgment. They read the room, handle a spill, change an order, notice a guest who needs help and move through crowded corners. Those are hours the robot should not try to take, and the hours staff gain from fewer food runs are better spent on guests.
The right setup uses both. The robot takes steady, predictable runs, and staff keep hospitality work. A robotics vendor's use-case page reports a 40% reduction in busser labor hours across one hotel pilot, but that figure is self-reported and anonymized, so read it as a sign of what is possible rather than a benchmark.
- Steady runs on mapped paths
Delivery Robot
Strong: same route and load on every trip
Staff
Good, but pace usually slows as the shift wears on
- Peak rush
Delivery Robot
Holds a set pace while the route stays clear, limited by congestion
Staff
Flexible: carries more per trip and reroutes around crowds
- Reading the room
Delivery Robot
Weak: no judgment about mood, spills or special requests
Staff
Strong: handles spills, order changes and guest needs
- Breaks and fatigue
Delivery Robot
No fatigue, but needs charging and service windows
Staff
Needs breaks and shift rotation
- Setup and recovery
Delivery Robot
Needs route updates and dispatch when it faults
Staff
Adjusts within minutes without outside support
How do you get a precise figure from a free site assessment?
Ask for a free site assessment before using any figure in a budget. We map the route from the kitchen pass to the dining room, dish area and bar, measure path widths and thresholds, and log the runs staff actually make during service. That replaces the default share with one based on your floor.
We lease the robot through financing, deploy and integrate it, train the staff and service it nationwide, so the quote covers the full picture. The fixed robot lease payment comes in the quote after the site assessment, not before. We are a vendor neutral integrator, so the robot is chosen for the floor rather than for one manufacturer's line.
Bring your shift schedule, peak service times, menu layout and a sample week of staffing. The calculator assumes four waiters and waitresses on a typical shift at a site of this kind, a planning assumption that no source we checked verifies, so replace it with your own roster. Sharper inputs narrow the savings range and make the payback date more honest. Use the result to decide whether to start with one leased unit and measure before scaling.
Frequently asked questions
Put a robot to work in Des Moines.
We walk your site, learn the job, and recommend the unit that fits. Then we quote the lease, deploy it, and keep it serviced.
Sources
- US Bureau of Labor Statistics, Occupational Employment and Wage Statistics (OEWS May 2024)
- BLS Occupational Outlook Handbook, Waiters and Waitresses
- FRED, total separations rate, accommodation and food services (JTS7200TSR)
- FRED, job openings rate, accommodation and food services (JTS7200JOL)
- National Restaurant Association, Iowa state fact sheet
- WageDex, waiters and waitresses, Des Moines-West Des Moines, IA
- Nevada state release of BLS 2024 nonfatal injuries and illnesses incidence rates
- Robotics vendor use-case page, restaurant automation (self-reported)
- Indianapolis Business Journal, restaurant robot coverage citing industry staffing survey