Key takeaways
- Robot analytics transform operational data into actionable insights for efficiency and cost savings.
- Fleet management platforms are shifting from simple tracking to predictive, data-driven strategic tools.
- Analyzing metrics like square feet cleaned or items delivered provides tangible proof of ROI.
- A vendor-neutral integrator can unify data from a diverse, multi-manufacturer robot fleet.
- Predictive maintenance, powered by robot data, significantly reduces costly, unplanned downtime.
From Raw Data to Smarter Operations
Your service robots are more than just automated workers. They are powerful data-gathering tools. Every square foot a robotic floor scrubber cleans, every item a delivery robot transports, and every patrol a security robot completes generates a stream of valuable operational data. The key is knowing how to use it.
By analyzing this data, you can move beyond simple automation to genuine operational optimization. Robot analytics allow you to identify hidden bottlenecks, fine-tune schedules for maximum efficiency, and demonstrate the tangible return on investment (ROI) of your autonomous fleet. This data-driven approach is how you extract the full value from your robotics program.
The industry is seeing a clear trend. A 2026 outlook from Wheels highlights data-driven optimization as a primary focus for fleet managers. Modern fleet management platforms are evolving from simple location tracking to sophisticated analytics engines that enable strategic decisions. It's a shift from knowing where your assets are to understanding precisely how well they are performing. According to Intangles, this move toward predictive analytics is what drives real operational improvements and can reduce costs by up to 30 percent.
What Key Metrics Do Service Robots Provide?
The specific data points available depend on the robot's function, but they generally fall into several key categories that offer a window into your operations.
For cleaning and maintenance robots, the data is all about coverage and uptime. You can expect detailed reports on:
* Area Covered: precise measurements of square footage cleaned per shift or per hour.
* Time in Operation: how long the robot was actively working versus charging or idle.
* Consumable Usage: tracking of cleaning solution, water, or other materials used.
* Battery Health: data on charge cycles, battery life, and charging times, which is critical for scheduling.
For logistics and delivery robots in warehouses, hospitals, or hotels, the focus is on throughput and efficiency:
* Tasks Completed: the number of deliveries, material transports, or specific jobs finished.
* Travel Distance: total distance covered, which helps in analyzing route efficiency.
* Wait Times: time spent waiting for elevators, doors, or human interaction.
* Payload Data: information on the weight or type of items being transported.
How Does This Data Pinpoint Operational Bottlenecks?
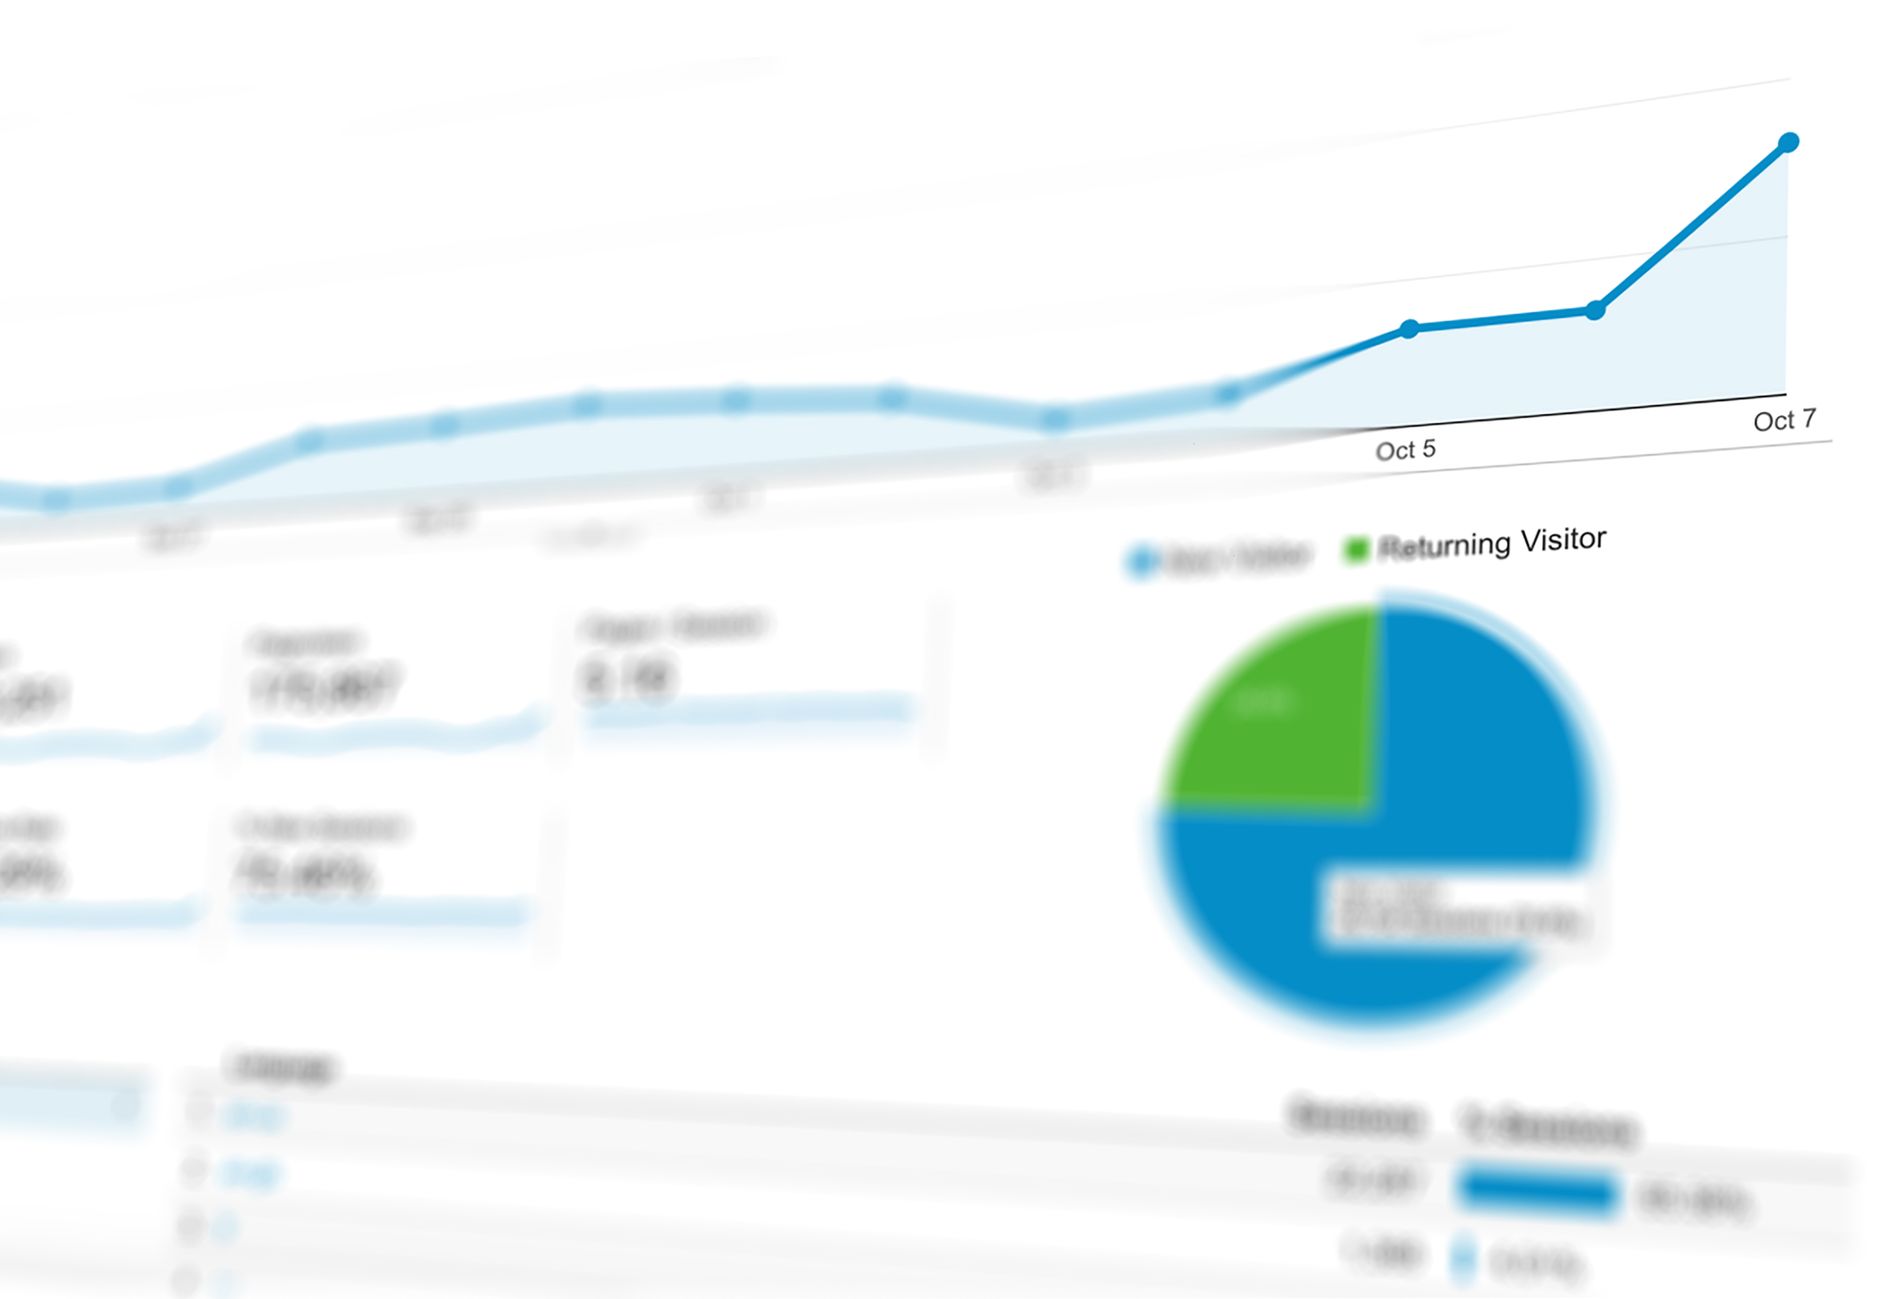
Raw numbers become powerful when you use them to spot inefficiencies that would otherwise be invisible. Robot analytics software centralizes and visualizes this data, making it possible to identify patterns and problem areas.
Imagine a fleet of autonomous mobile robots (AMRs) in a distribution center. By analyzing their travel data, you might discover that multiple robots are consistently delayed at a specific intersection or doorway. This points to a physical bottleneck in your facility's layout. Without the robots' collective data, this might have been dismissed as random occurrences. Now you have a clear, data-backed reason to reroute traffic or change the physical environment.
Similarly, data from a hospital's medication transport robots could reveal that delivery times to a particular wing are consistently longer. Is it a slow elevator? Is the route inefficient? The data gives you a starting point for investigation. By using analytics to uncover these usage patterns, you can make informed decisions to streamline the entire operation.
Optimizing Schedules and Proving ROI

Once you understand where the inefficiencies lie, you can use the data to build better schedules. For instance, data from a robotic floor scrubber in a large retail store might show that it cleans aisles most efficiently between 2 a.m. and 4 a.m., when restocking is complete. This allows you to schedule its work for maximum productivity with minimal interference.
This is also where you build an undeniable case for your robotics investment. The proof is in the numbers. You can directly compare the square footage cleaned by a robot overnight to what a human crew could accomplish. You can calculate the labor hours saved by automating repetitive material transport. According to PwC, some AI-driven systems can perform tasks with 90–95% accuracy, significantly reducing errors and rework costs.
This tangible proof of performance, measured in hours saved, tasks completed, and areas covered, moves the conversation about robots from a perceived expense to a proven asset. It provides the hard data needed to justify expanding your fleet or automating new areas of your business.
The Power of a Unified Fleet Management Platform
Managing the data from a handful of identical robots is one thing. The challenge grows when you operate a diverse fleet with units from different manufacturers, each with its own software. This is a common scenario for businesses that select the best robot for each specific job.
This is where the value of a vendor-neutral integrator like Service Robot Co. becomes clear. We specialize in bringing your entire fleet, regardless of the original manufacturer, under one unified dashboard. Instead of juggling multiple systems, you get a single source of truth for all your robot analytics.
This centralized view is critical for true fleet-level optimization. It allows you to compare the performance of different types of robots, allocate resources more effectively, and make strategic decisions based on a complete operational picture. With one partner and one number to call, Service Robot Co. provides the turnkey robot deployment and management that simplifies complexity and maximizes the value of your data.
Moving from Reactive to Predictive Maintenance
One of the most significant advantages of continuous data collection is the ability to shift from a reactive to a predictive maintenance model. Fleet management systems are increasingly using AI and analytics to predict system failures before they happen. This is a defining factor in optimizing uptime.
Instead of waiting for a robot to break down, the system analyzes data on motor temperature, battery performance, and sensor feedback to flag potential issues early. For example, analytics might detect that a specific wheel motor is drawing more power than usual, suggesting it needs service before it fails and halts operations. According to a 2026 report from Fleetio, 40.1% of fleet maintenance is unscheduled, leading to costly downtime. Predictive analytics directly addresses this challenge.
This proactive approach significantly reduces unexpected service interruptions and their associated costs. It allows maintenance to be scheduled during planned downtime, ensuring your fleet remains productive and reliable.