Key takeaways
- High robot utilization can hide wait time at pick faces, chargers, and intersections rather than productive loaded travel.
- Segment mission logs into travel loaded, travel empty, queue, blocked, and charging before you approve another capital request.
- Intersection heat maps and blocked-path counts usually reveal whether traffic rules or layout fixes will beat another unit.
- Charger utilization above nameplate capacity during peak shifts is a congestion signal, not proof you need more robots.
- A short digital twin or replay simulation can show throughput flattening when fleet size rises without rule changes.
Do you need more robots or better flow?
Fleet leaders feel throughput pain long before finance sees a capital request. Orders age at pack stations, totes stack at handoffs, and supervisors ask whether another autonomous mobile robot will clear the backlog.
Often the answer is no. Missed moves frequently trace to queues, blocked intersections, slow handoffs, and release rules that dump too many missions into the same aisle at once. Adding units without fixing those constraints can make congestion worse.
Treat expansion as a diagnosis problem first. Measure whether capacity is starved by too few carriers or by traffic physics on your floor. Only after you quantify wait versus work should you size the next purchase.
What should mission logs show before you buy?
Fleet management systems already record mission start, pickup, drop-off, exceptions, and fault codes. The gap is segmentation. A single utilization percentage cannot tell you if robots are moving loads or circling a choke point.
Operations teams that run mature intralogistics programs often split time into traveling loaded, traveling empty, waiting for assignment, waiting on source availability, blocked by traffic, charging, and faulted states. That view turns a vague slowdown into a named bottleneck.
Pull two weeks of logs across day and night shifts before any expansion meeting. Compare cycle time by task type, not fleet averages. A replenishment loop that doubled in queue time while travel held flat is a traffic problem, not a headcount problem.
- Completed missions per hour by zone and shift
- Median queue time before pickup and after drop-off request
- Exception rate per 100 missions with reason codes
- Task aging against your internal service targets
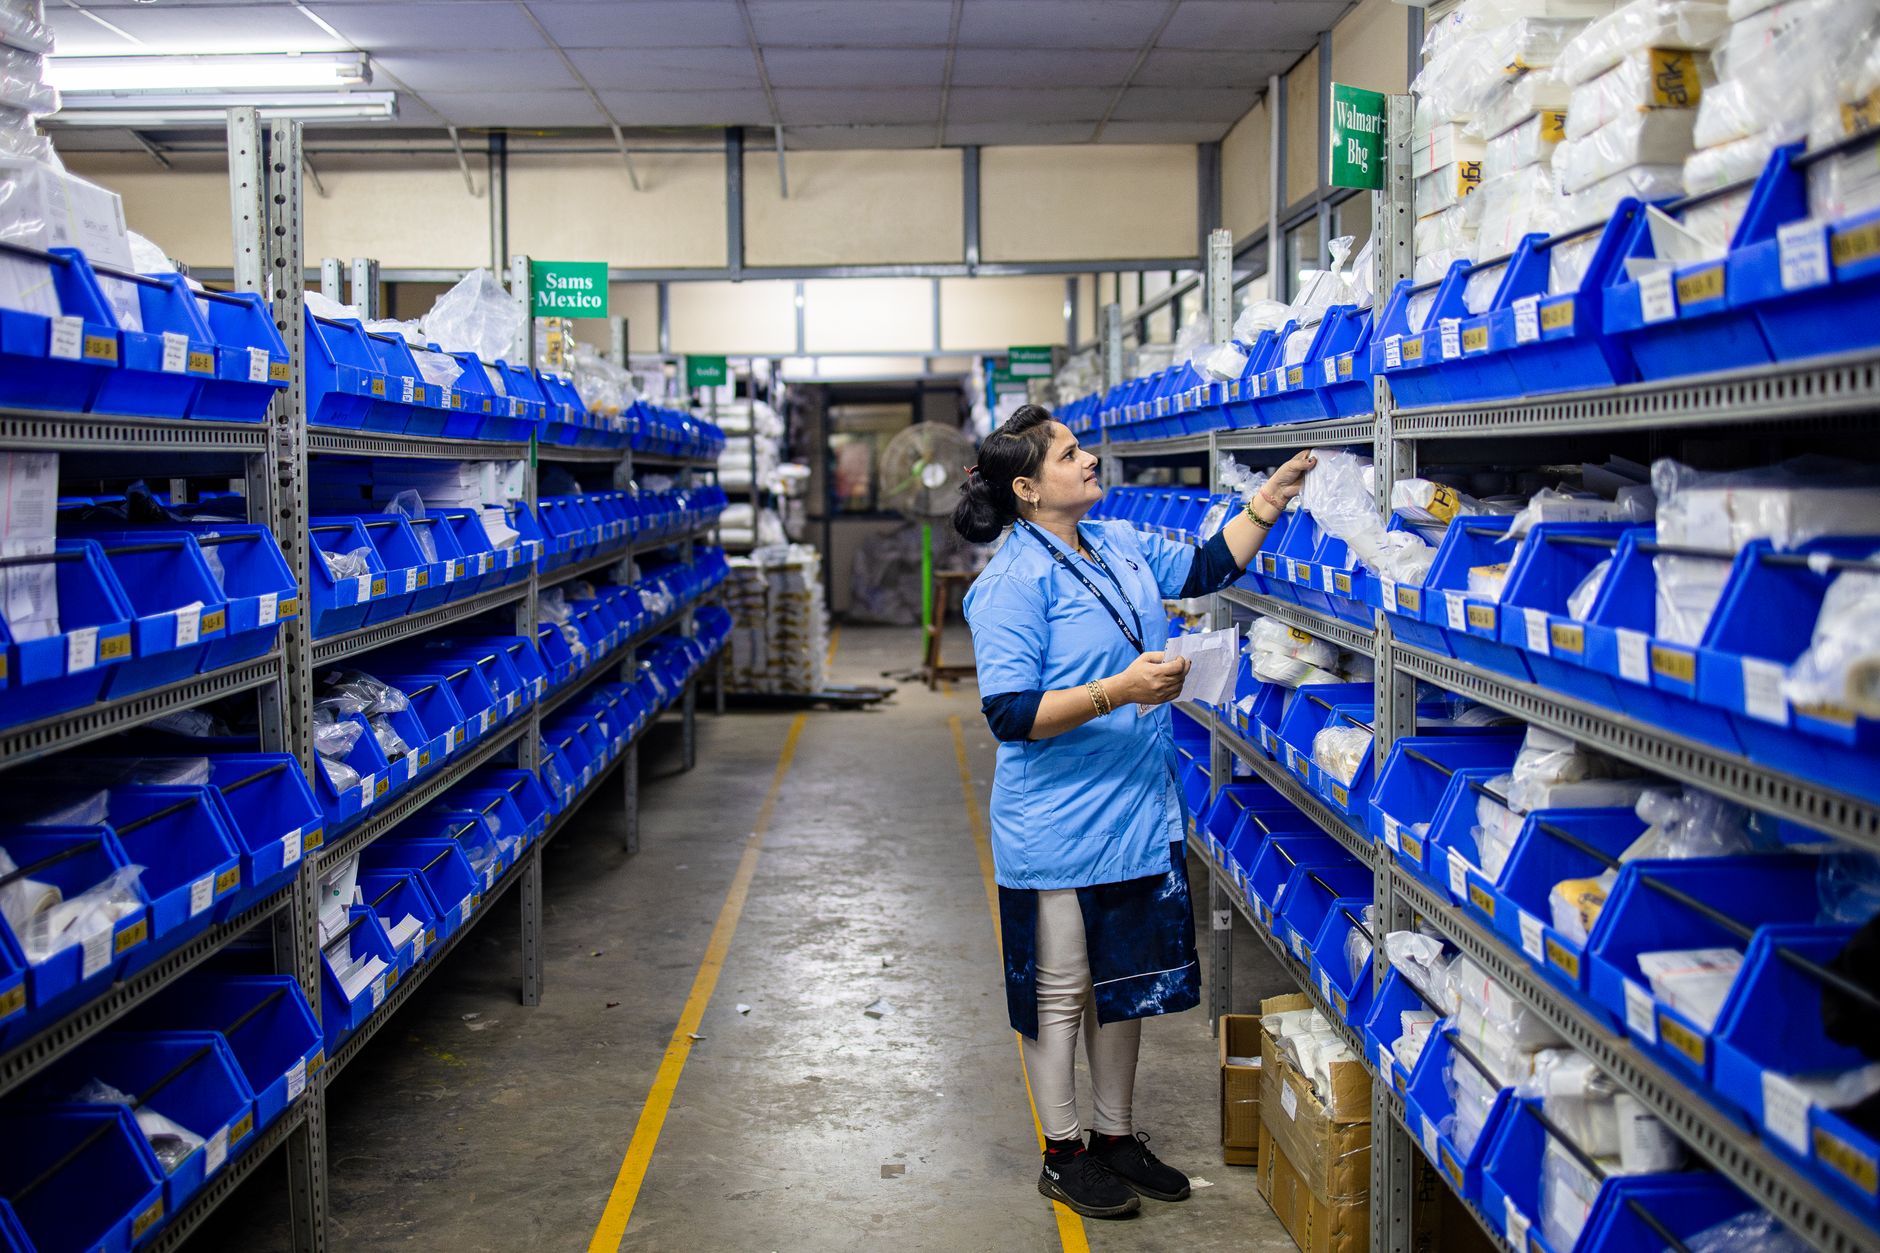
Which wait metrics prove congestion instead of demand?
Queue persistence matters more than a single long backup. Watch whether delays propagate upstream into idle robots, starving lines that never appear in the original ticket.
Published intralogistics benchmarks often cite average wait at shared intersections under about five seconds and path conflict rates below about three percent of segments per hour when traffic rules are healthy. Once robot density rises in tight aisles, those numbers climb and utilization can fall by ten to twenty points even while every unit looks busy.
Pair queue time with station dwell. If pick or induction stations hold robots longer than the labor standard, fixing handoff geometry or WMS release timing may recover more throughput than a new vehicle.
How do intersection heat maps change the conversation?
Location traces become useful when you aggregate them. Plot cumulative minutes robots spend stopped within grid cells or along route segments. A single intersection that collects dozens of robot-minutes per hour is a design issue visible on a heat map, not on one robot status screen.
Facilities analytics teams sometimes flag zones where cumulative wait crosses a few minutes inside a fifteen minute window because upstream stations begin to starve. That pattern justifies a traffic rule change before it justifies capex.
Heat maps also show whether bidirectional aisles are the culprit. Conflicts cluster where forklifts, pedestrians, and AMRs share the same pinch point. One-way loops, passing bays, or time windows for mixed traffic often cost less than another robot fighting for the same tile.
What does charger utilization really tell you?
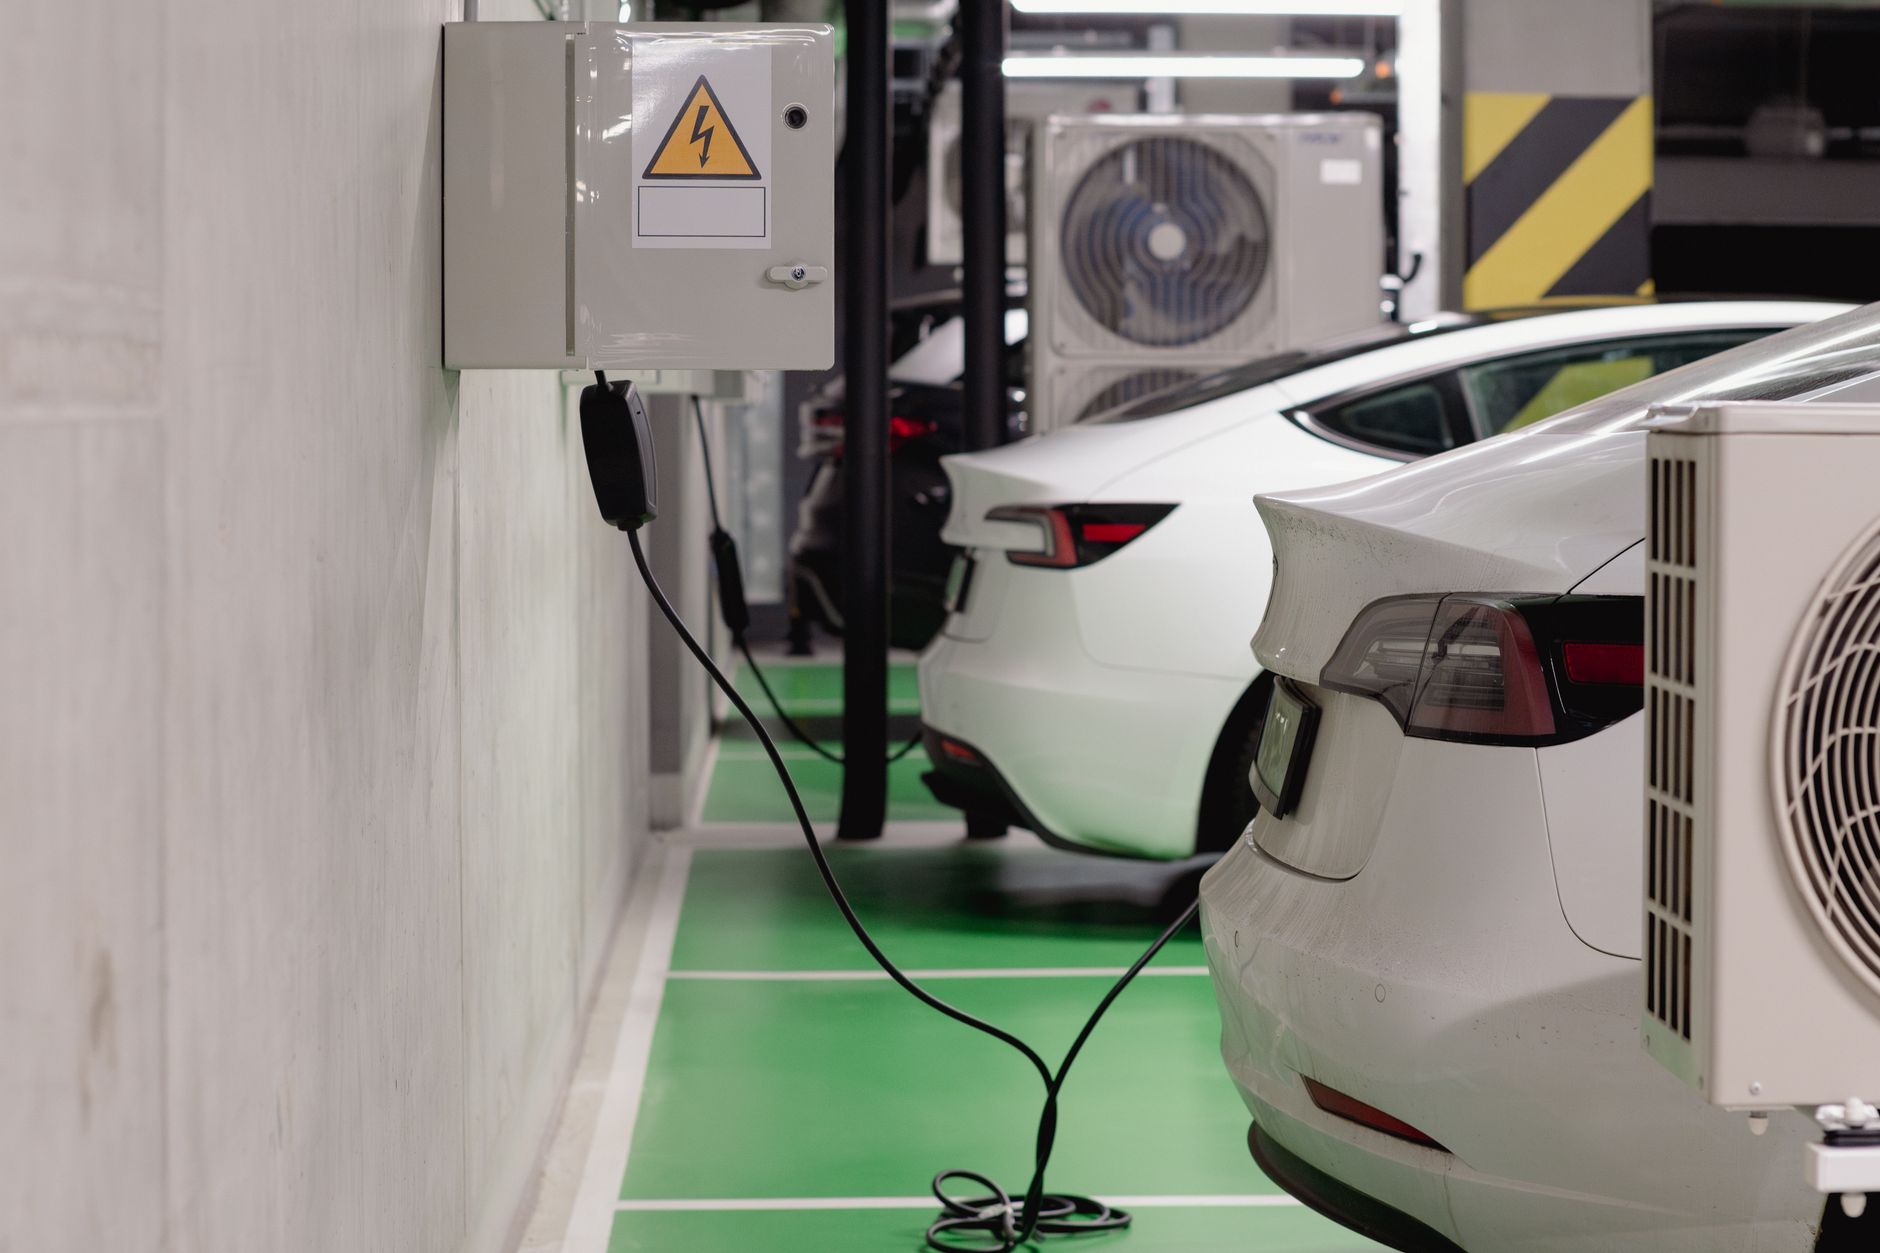
Charging looks like downtime, so finance teams skim past it. In congested sites, robots queue at chargers the same way they queue at pick faces. High charger occupancy during peak can mean insufficient energy capacity, poor opportunity charging rules, or robots parking in the lane because the floor has nowhere else to wait.
Chart state of charge distribution across the fleet each hour. If multiple units sit below your dispatch threshold simultaneously while missions backlog, you may need staggered releases or an extra charge point, not necessarily another transport robot.
Separate charging dwell caused by traffic blocks from true battery limits. A robot that arrives at a dock but cannot enter because another unit is staged ahead is a congestion event recorded as charging time in some systems.
When should you simulate fleet size instead of guessing?
Replay simulations and digital twin models let you add virtual robots against historical demand without moving steel. Academic factory layout studies have shown effective active time for automated carriers falling from about ninety percent with one vehicle to about forty-two percent with four vehicles in narrow corridors when traffic rules stay fixed.
Run scenarios with your actual mission mix: add one robot, then two, then three while holding layout constant. If throughput gains flatten while blocked-path events rise, you have found the congestion knee of the curve.
Simulation also tests cheap mitigations first. Staggered mission release, directional aisles, buffer slots at handoffs, and reservation logic at blind corners frequently move the knee more than hardware.
Labor context still matters. The U.S. Bureau of Labor Statistics reported about 12.8 million manufacturing employees on payroll in April 2025, so even small material-handler gaps during peak shifts push teams toward automation before congestion math is complete.
What traffic rule changes beat another robot?
Before capital, tune orchestration. Cap concurrent missions per aisle, enforce priority classes for line feeding over bulk storage moves, and separate empty return routes from loaded delivery routes.
Assign one owner for cross-system tuning among warehouse execution, fleet software, and floor supervision. Congestion is a systems problem. Robots inherit whatever release cadence the WMS allows.
Document rule changes with the same rigor as hardware installs. A one-way loop that recovers five missions per hour per shift is an asset you can defend in the next budget cycle.
Where does Service Robot Co. fit the expansion decision?
Service Robot Co. is a full-service commercial robot integrator for U.S. businesses. We stay OEM-neutral across AMR platforms, then finance, deploy, integrate, train, and service fleets through a nationwide network of regional service engineers.
When a site debates another AMR, we often start with a rental pilot and a two-week log review rather than a purchase order. That surfaces whether queues or handoffs are the real limiter on your aisles.
If logs show healthy flow with headroom, we size the add with measured throughput targets. If logs show congestion, we fix traffic rules and layout first so the next robot ships productive on day one.