
The short answer
Autonomous mobile robot ROI for textile mills comes from taking over the repeated bobbin and material runs between spinning and weaving, work that people now push by hand or on carts. The return is a range built from the hours the robot realistically takes, the government wage data on this page for laborers and freight, stock, and material movers, hand, and the lease cost quoted after a free site assessment. Measured route by route, the number is far more precise than any published average.
Key takeaways
- The return comes from repeatable bobbin and material runs between fixed areas, not from the whole mill.
- Labor hours taken over are valued at the government wage data on this page for laborers and material movers.
- No verified public figure exists for hours per shift, so the free site assessment times your actual routes.
- The result is a range that moves with route share, shift pattern, floor layout and service coverage.
- Vendor-reported paybacks of 14 to 24 months are a guide only, not textile mill results.
Run the numbers for your site
Pick your city or state for a real regional number - we use the real BLS wage there. (On the live site this auto-detects from your location.)
What do you want to automate?
The robot takes the repetitive cart and pallet moves off the heaviest motion.
What is autonomous mobile robot ROI for textile mills?
Autonomous mobile robot ROI for textile mills is the return a mill gets when a driverless cart takes over material moves that people repeat every shift. The return is a range, built from hours of work moved off the floor, the government wage data on this page for laborers and freight, stock, and material movers, hand, and the lease cost. It is not a promise, and no single number applies to every plant.
The industry is large, and its headcount has been slipping slightly. According to the U.S. Bureau of Labor Statistics, textile mills employed about 84.5 thousand people in December 2025, a preliminary figure, down from 85.4 thousand in September 2025. Average weekly hours were 41.4 that month, also preliminary. According to IBISWorld, a proprietary market research estimate and not a Census count, there were 5,712 textile mill businesses in the United States in 2026, down 1.6% from 2025.
Longer-run figures point the same way. According to the FRED economic data series for textile mill employment, indexed to 2017 = 100, the index read 86.563 in 2022, 79.156 in 2023 and 80.534 in 2024. According to Data USA, about 10,960 workers were employed in fiber, yarn and thread mills in 2024, the group that includes yarn spinning. Its establishment rankings, labeled 2022, put North Carolina and Georgia at the top.
Adoption figures are mostly forecasts. A vendor page citing a survey by MHI and Deloitte says 58% of organizations plan to increase AMR adoption over the next two to three years. That is a plan figure, not a measure of how many mills run these robots, and it covers all industries rather than textiles alone.
Where does the return come from in a textile mill?
The return sits in the material runs between fixed production areas. Bobbins and bulk materials leave spinning and travel to weaving on routes that repeat every shift. Those routes are predictable, so they suit a robot that follows a mapped path, and each run the robot takes is one a person no longer pushes or pulls.
Handling damage is part of the case. According to a trade article on bobbin transport from the Indian Textile Journal, roving bobbins are easily damaged during manual transport, and a bobbin transport system protects them. A savings figure built only on labor hours misses that protection, so the site assessment should count how often bobbins are damaged today.
Textile World, citing a textile technology institute, says the bobbin transport system is where automation investment is most easily justified in spinning mills. That points the first assessment at the spinning to weaving bobbin route rather than the whole plant.
Median hourly wage, Laborers and Freight, Stock, and Material Movers, Hand
$4,380
Monthly cost of one full-time worker, at the median wage plus payroll costs (an estimate, not a quote).
How much labor time does a robot take over?
The hours figure is the hardest number in the model, and no public source gives one for a mill. We did not find a verified count of hours spent moving bobbins or materials per shift in textile mills, so this page does not state one. The site assessment times each route in your building and turns those timings into hours per week.
Think of the work as a set of runs. A run has a load, a start point, a stop point and a return trip. Each run takes clock time, including the wait for a person to finish another task. The robot takes a share of those runs, and that share is what the model needs, not the total hours on the floor.
Robots rarely take every run. Irregular moves, jams, loads outside the unit's design, and runs that cross areas the robot cannot enter stay with people. The hours that count are the ones on repeatable routes, and the assessment separates those from the rest.
| Task | Today | With a robot |
|---|---|---|
| Bobbin runs, spinning to weaving | to be timed on site; no verified public figure | robot takes repeatable runs; staff handle exceptions |
| Bulk material runs between areas | timed on site during the assessment | scheduled runs on the same mapped route |
| Empty carts returned to the start point | timed on site during the assessment | robot returns empties on its own route |
| Waiting for a person to finish another task | logged during the assessment | runs queue on a schedule, with no wait for a person |
| Staff exception handling | not applicable to manual runs | staff time per exception, measured during the pilot |
No hour figures on this table are verified. Each today entry is measured during the free site assessment, and each withRobot entry is set during the pilot.
How does the savings math work?
The core is simple. Hours of material moving taken over, multiplied by the local wage for this job, gives the labor side. The model uses the wage for laborers and freight, stock, and material movers, hand from the government wage data on this page, not the pay of the operators who run the machines.
Subtract the cost of leasing and running the robot to get a net figure. The lease cost comes as a quote after a free site assessment, and it covers the unit, financing and service for the term. Maintenance and software terms belong in that quote, not in the hours estimate, so ask for each one in writing.
The result is a range. The low end assumes fewer hours taken and a slower ramp. The high end assumes stable routes and a full set of repeatable runs. Neither end is a promise, and this page does not reduce the range to one number.
What changes the number up or down?
Staffing is a major lever. A local survey in Rowan County, North Carolina, of 106 firms in 2020 reported a 55% turnover rate for textiles. No national turnover rate for textile mills was found in this research, so that survey is the only turnover figure here, and it is local and dated. Still, high turnover makes open shifts and retraining costly, and a route that stays the same when a worker leaves keeps the hours steady.
Route length and frequency move the number most. A long bobbin run that repeats every half hour offers more hours than a short, occasional move. Layout matters too. A plant that has been reconfigured often needs its routes remapped, which takes time and belongs in the quote.
Shift count moves it as well. A mill that runs one shift has fewer hours to offset than one running around the clock. Confirm the shift pattern before reading the range, because a robot that runs more shifts spreads its lease cost over more working hours.
Where does a robot fit poorly in a textile mill?
A robot is a poor fit for work that does not repeat. Mixed loads, one-off moves and areas with frequent obstacles keep people busy. A robot also cannot replace skilled roles at the machines, such as tenders and inspectors, and this page does not claim it does.
Injury data needs a careful reading. According to the Bureau of Labor Statistics page for textile mills, the rate for cases involving job transfer or restriction was 1.0, though the year is not clear in the source. For textile product mills, a related group, BLS reports a total recordable case rate of 2.1 per 100 full-time workers for 2024, with the label partly cut off in the source. BLS also notes a series break starting with 2023 data because of the 2022 industry coding change, so older and newer rates should not be compared directly.
Robots reduce lifting and pushing on repeatable runs, but they add hazards around moving equipment that staff must be trained to manage. Count those training hours when you set the rollout plan.
- Repeatable route, same path each run
Autonomous Mobile Robot
Holds a fixed path and schedule without drift
Staff
Works well on a known route but tires over a long shift
- Irregular or mixed loads
Autonomous Mobile Robot
Struggles with loads outside its design
Staff
Adapts on the spot to odd loads
- Care with bobbins on each run
Autonomous Mobile Robot
Moves at a consistent speed along the mapped path
Staff
Brings attention and judgment to each handling step
- Night and off-hour runs
Autonomous Mobile Robot
Runs on schedule with no shift premium
Staff
Needs staffing for off-hours
- Judgment about a damaged load
Autonomous Mobile Robot
Flags the problem but does not judge it
Staff
Decides what to do next
What are the risks to the return and how do you avoid them?
Three risks matter most. First, the robot takes fewer hours than modeled because routes are irregular or the layout blocks them. Second, a unit sits idle during a repair, and the labor it was meant to offset returns to the floor. Third, maintenance and software costs run above what the quote shows. Each shortens the return, and each can be managed before signing.
Vendor figures come from the vendors' own case studies and guides, so they may assume results a mill does not get. A vendor case study from a consumer goods plant with 50 mobile robots reports a 14-month payback and a 16-week rollout, but that result includes a throughput gain, which is a separate assumption from labor savings. A vendor guide on pallet transport fleets gives an 18 to 24 month payback and a 60 to 70% labor cost reduction on pallet moves. Neither covers a textile mill, and the pallet figure is for a different job, so treat both as a sense of range only.
Ask for the spare unit plan, the on-site dispatch terms and the stated response time in writing before you sign. Those terms protect the hours the model counts, because a unit that is down for a week removes its labor offset for that week.
What is a realistic timeline from assessment to payback?
The timeline starts with the assessment. Expect the site visit, floor mapping and route timing first, then the quote. After the lease is signed, deployment and integration follow, then staff training and go-live support. The vendor case study cited on this page reports a 16-week rollout for a fleet of 50 units at a consumer goods plant, which gives a sense of scale.
A smaller first deployment is usually shorter, and the assessment sets the real schedule for your floor. Payback follows go-live, so the first months measure the hours the robot actually takes. The vendor-reported range of 14 to 24 months depends on hours taken over and on lease terms, and it does not come from textile mills.
A mill that starts with one unit on its busiest route learns its real hour figure before it commits to more units. That is the cheapest way to replace an estimate with a measurement.
How do you get a precise figure from a free site assessment?
The free site assessment replaces the estimates on this page with your own measurements. It records the routes, distances, loads, shift pattern and the local wage for this job. It also maps the floor so the robot's path and charging points fit the layout.
We run the assessment ourselves. We pick the unit that fits your floor, lease it through financing, deploy and integrate it, train your staff and service it nationwide. The quote comes after that work and includes the lease terms, service coverage and go-live plan.
Bring the records you already keep. Logs of bobbin and material moves, shift schedules, damage logs and turnover figures all help. The more accurate the route times, the tighter the range.
- Route list: start and stop areas for each repeatable run
- Timed runs: how long each run takes, over several shifts
- Shift pattern: hours the mill runs, including night and weekend shifts
- Damage log: how often bobbins or loads are damaged in transport
- Floor limits: doorways, ramps and aisles the robot must clear

How do the robot and the staff share the floor?
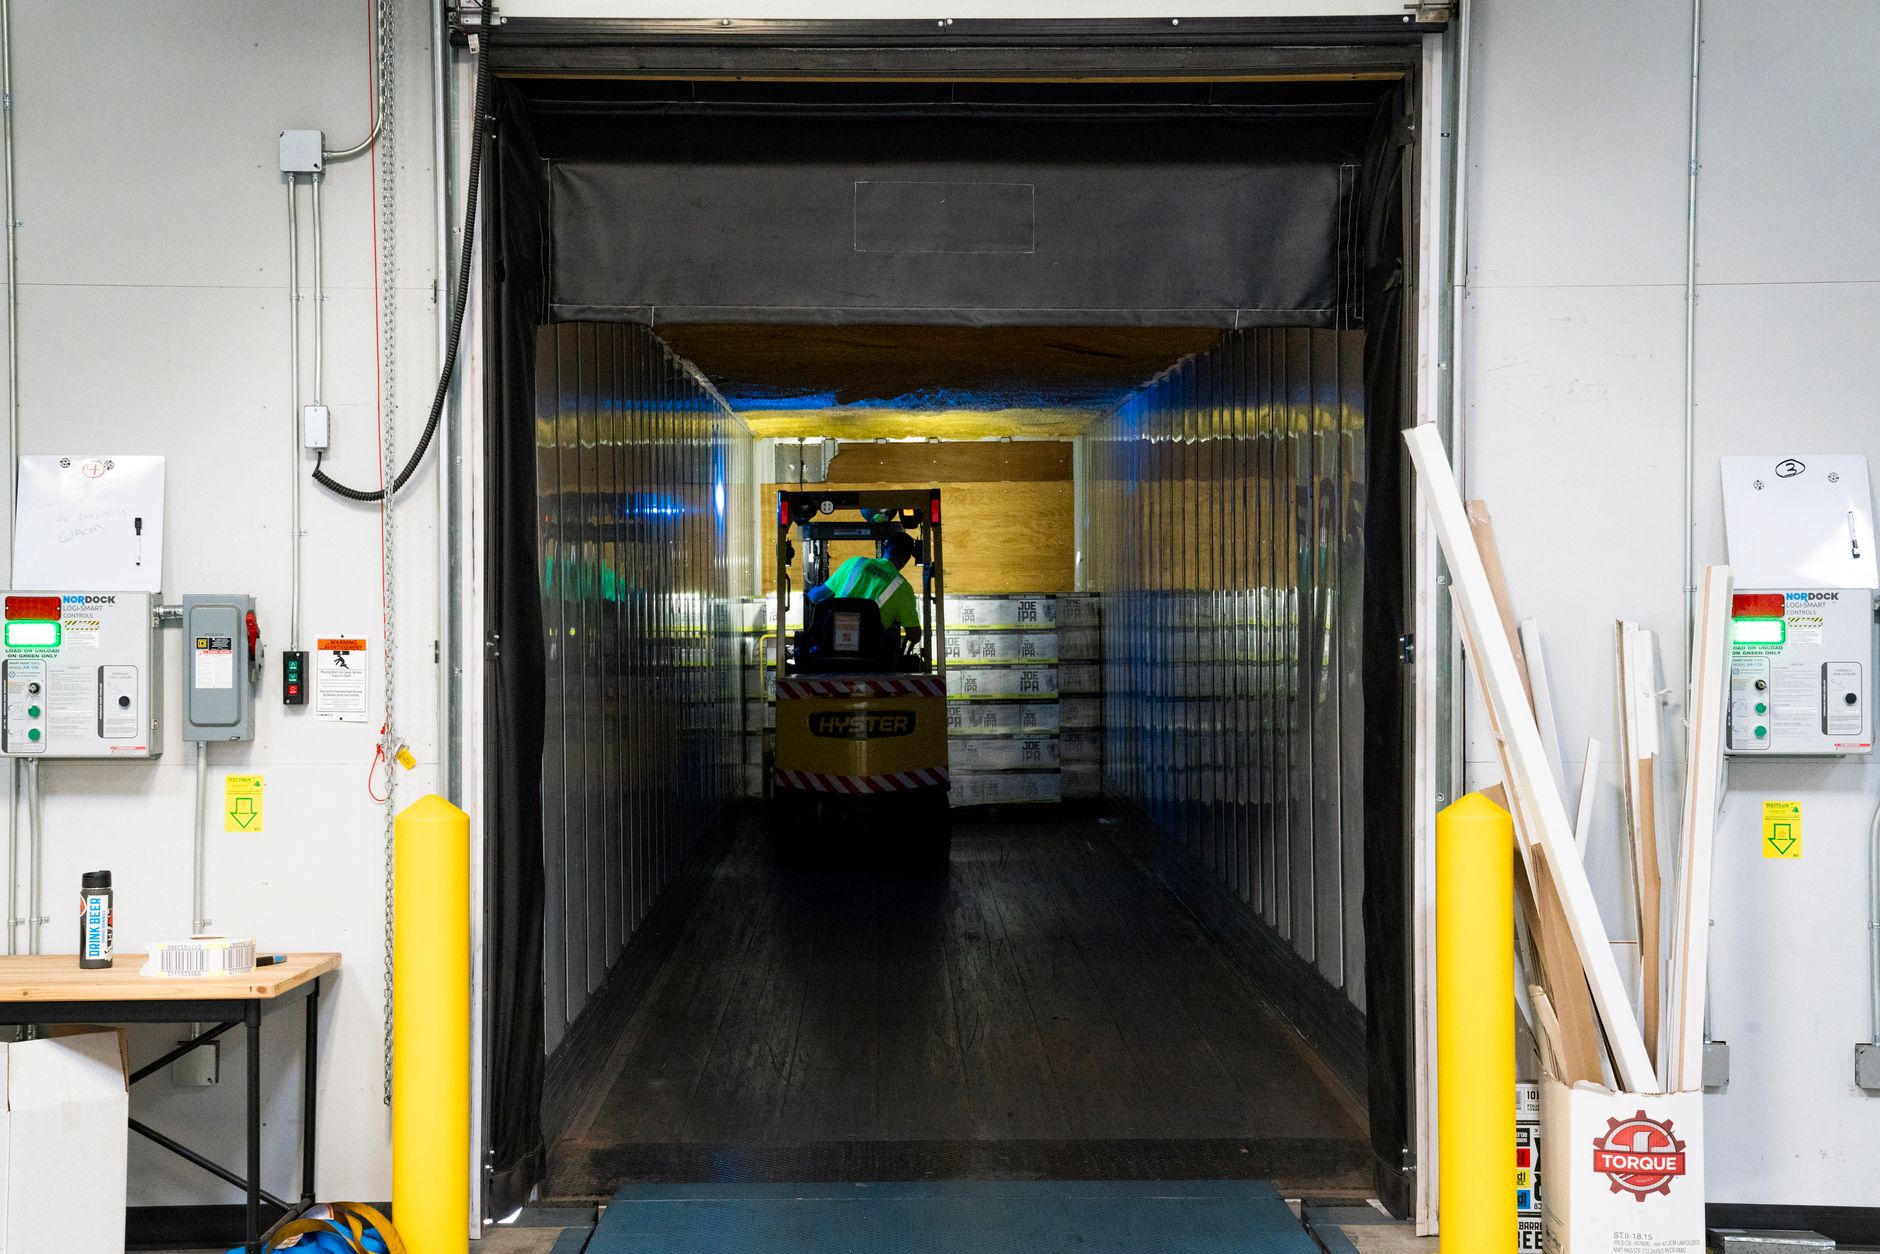
A robot takes repeatable runs, which leaves staff to load carts, check loads and handle exceptions. The mill still needs people at the machines, and the hours the model counts are only the ones moved off the floor.
Staff roles change. The people freed from carrying can move to inspection, load checks or floor care, where the mill's own priorities decide. The model should not count those hours as saved wages unless the mill actually redeploys or reduces the labor.
Training matters for the day to day. Staff need to know how to clear a path, how to respond when a unit stops, and what to do with a damaged load. A training plan belongs in the rollout, not after it.
Frequently asked questions
Want a warehouse robot at your textile mill?
Tell us about your site. We will recommend the robot, quote the lease, and keep it serviced.
Sources
- US Bureau of Labor Statistics, Occupational Employment and Wage Statistics (OEWS May 2024)
- U.S. Bureau of Labor Statistics, textile mills (NAICS 313) employment and injury data
- U.S. Bureau of Labor Statistics, textile product mills (NAICS 314) injury data
- FRED economic data series, textile mill employment index
- Data USA, fiber, yarn and thread mills profile
- IBISWorld, number of textile mill businesses in the United States
- Indian Textile Journal, bobbin transport system article
- Textile World, bobbin transport and spinning automation article
- iFactory, 50 AMR case study for a consumer goods plant